Natural Gas (CME) (NG) Has Dropped in Every 113-Day Midterm Summer Window Since 1994
Natural Gas (CME) is heading into a mid-May seasonal window that has rewarded shorts in every midterm election year since 1994, just as prices trade near the bottom of their recent range and weather-driven demand looks soft.
What is the seasonal pattern for Natural Gas (CME) (NG)?
Natural Gas (CME) has fallen in 8 of 8 midterm-year summer windows during this 113-day stretch starting May 17, with an average 9.11% gain in winning short trades.
- 8 for 8 in this window, with short trades averaging 9.11% profit across the last eight midterm election years.
- The upcoming seasonal window begins on May 17, 2026 and runs for 113 trading days, covering most of the late-spring and summer demand season.
- Percent Profitable is 100%, with 8 winners and 0 losers for the short-side pattern in this Natural Gas (CME) trading window.
- Average profit in winning years is 9.11%, with a median outcome of 10.72%, pointing to a consistent bearish NG seasonal trend in this phase.
- The TradeWave Ratio (TWR) of 2.12 suggests price typically travels meaningfully in the short direction within the window, while the Sharpe ratio of 1.32 reflects solid risk-adjusted returns.
- Individual years have seen adverse moves as deep as about 36% against the short before reversing, so intraperiod drawdowns can be sharp even when the final result is profitable.
According to historical data from TradeWave.ai, this mid-May through early-autumn stretch has behaved very differently from an average month on the natural-gas calendar. The next section looks at how that election-cycle pattern has played out in prior midterm years and what it implies for the upcoming window.
How has Natural Gas (CME) (NG) traded in past midterm-year summer windows?
Natural Gas (CME) has delivered profitable short-side trades in every one of the last eight midterm election years during the 113-day window that starts on May 17, with average gains of 9.11% for shorts. Today the front-month NG contract settled at 2.777, up 0.29% on the session and sitting not far above its 52-week low of 2.561, well below the 7.827 high of the past year.[3] That combination of a historically bearish seasonal window and a contract already trading near the bottom of its 12-month range gives this year’s setup an unusually tight margin for error.
Because this pattern is grouped by the presidential election cycle, it only looks at midterm election years, when policy uncertainty, regulatory noise and shifting fiscal expectations often collide with the core summer demand season for gas. That focus strips out other phases of the White House cycle and isolates how NG has behaved when Washington is in the middle of its four-year rhythm and Congress is on the ballot.
Across the eight midterm years in the sample, every single iteration of this Natural Gas (CME) trading window ended with prices lower than where they started, which is favorable for the short direction of the pattern. The strongest year for shorts was 1994, when NG fell 18.11% from entry to exit, while the softest win came in 2022 with a 2.17% decline over the window. Even the smaller wins still lined up with the broader historical seasonality that has leaned bearish for NG in this slice of the calendar.
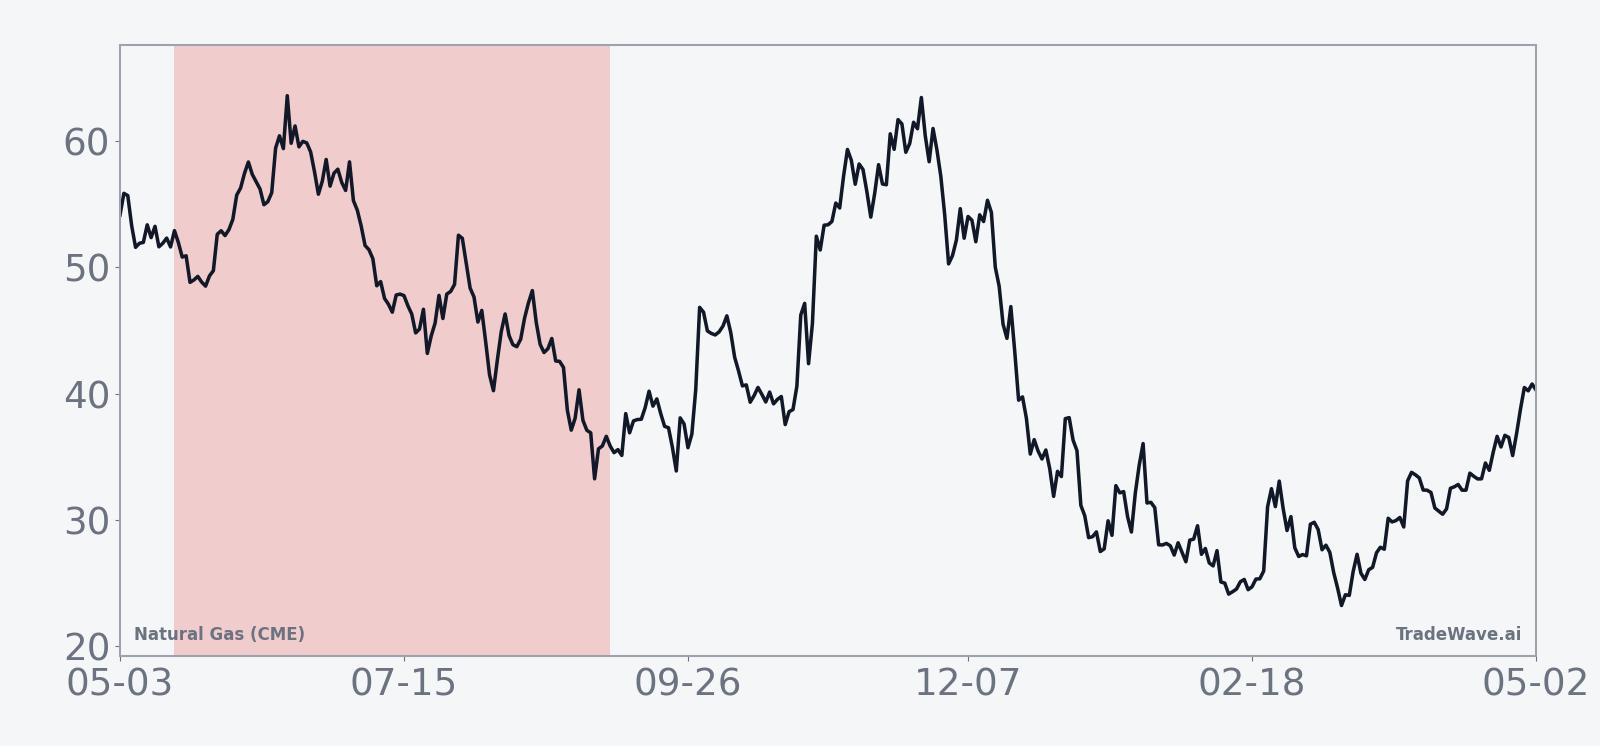
The historical seasonal average shows NG often chopping early in the window before trending lower into the heart of summer, which aligns with a pattern where short trades tend to see their best net results later in the period. That profile fits a market where early weather surprises or storage headlines can spark countertrend rallies, but the prevailing midterm-year summer tendency has still been for prices to finish the window below the starting point.
Per-year bars of net return, maximum favorable move and maximum adverse move show how far NG has swung inside this window before settling at the final outcome.
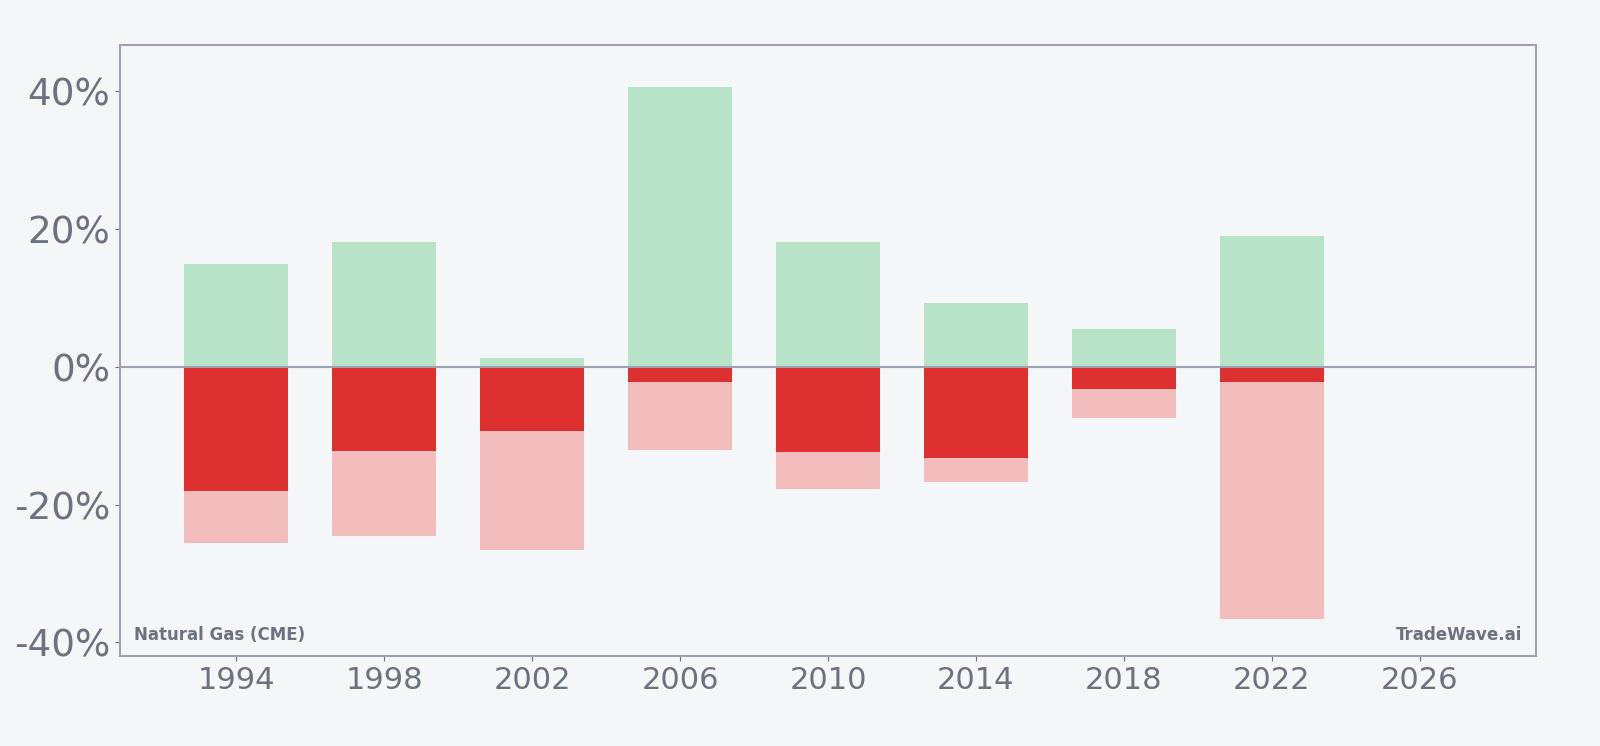
Intraperiod swings have been large. In 2022, for example, the maximum adverse move against the short reached about 36.57% before the market ultimately closed the window modestly lower, while 2006 saw a maximum favorable move of 40.63% in the short direction before some of that gain was given back by the end. That mix of big maximum favorable excursions and deep maximum adverse excursions means this historically bearish NG seasonal trend has come with plenty of volatility along the way.
History does not guarantee future results, and the worst intraperiod drawdowns in this window have been large even in years that ultimately finished as winners for the short side.
Why does Natural Gas (CME) (NG) follow this seasonal pattern?
One likely driver is the way summer weather, storage builds and policy noise line up in midterm election years. Analysts have pointed to periods when cooling demand underwhelms early expectations while production and storage rebuild, putting pressure on prices even as Washington debates energy policy and regulation. This pattern may reflect that combination of softer realized demand and rising inventories colliding with a risk-off tone around midterm campaigns, which has repeatedly favored lower NG prices into late summer.
What is driving Natural Gas (CME) (NG) today?
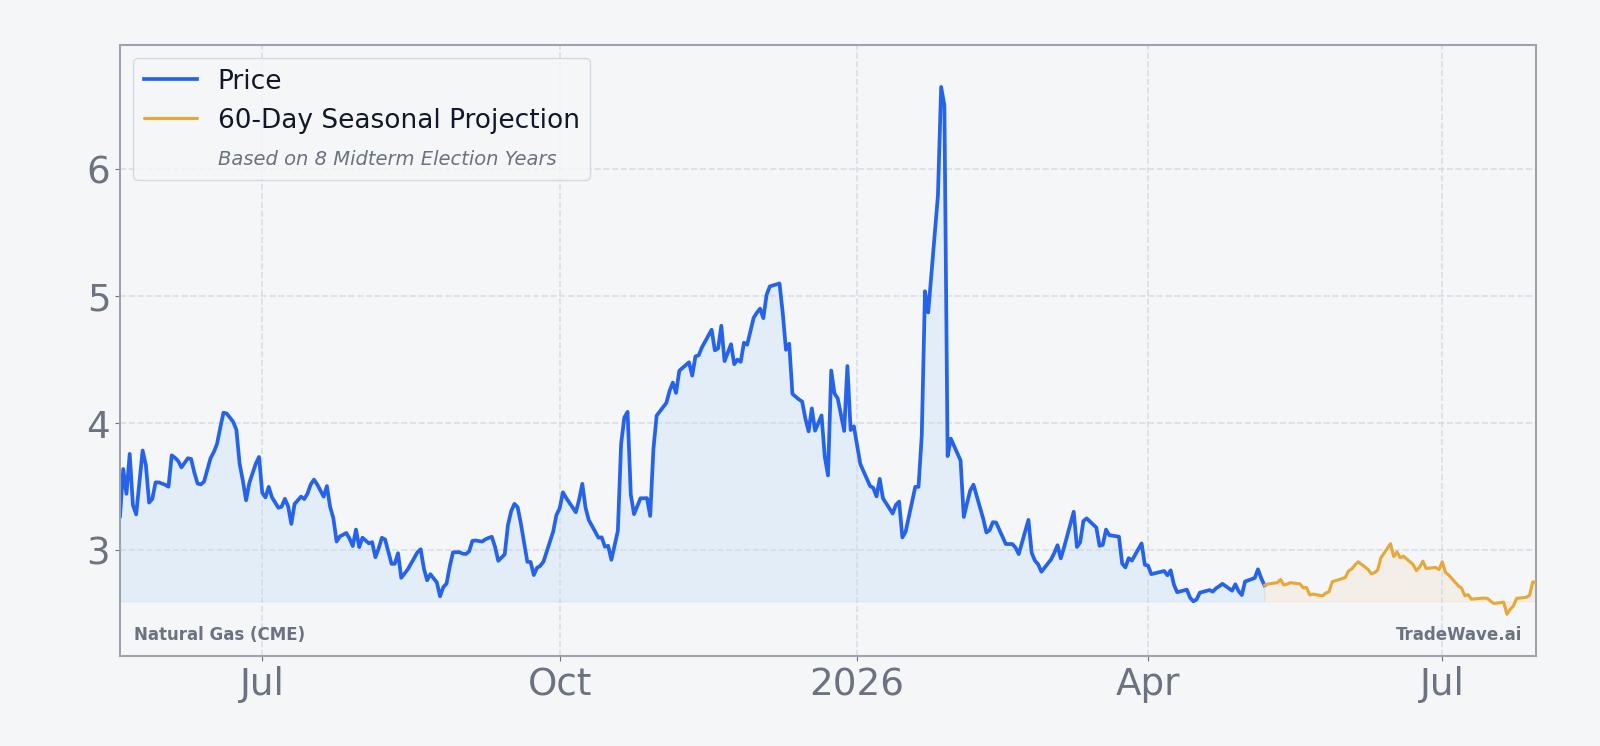
Front-month Natural Gas (CME) futures closed at 2.777 on May 8, up 0.008 or 0.29% on the day, with intraday trade confined to a tight 2.768 to 2.792 band and volume of just 2,695 contracts against a 20-day average of 115,439.25.[3] That leaves NG only about 8.4% above its 52-week low of 2.561 and roughly 64.5% below the 7.827 high of the past year, underscoring how far the contract has fallen from last year’s spikes.[3] On May 7, The Wall Street Journal reported that U.S. natural gas futures extended their decline amid a broader oil-market sell-off and light weather-driven demand, with traders eyeing the potential for hotter summers to eventually revive bullish sentiment.[3]
In February, U.S. natural gas futures slipped in choppy trade after a smaller-than-expected inventory withdrawal of 144 Bcf, with expectations of warmer temperatures weighing on future reports and reinforcing the sense of ample supply.[6] Earlier in the winter, cold snaps briefly sent prices sharply higher, but those surges faded as forecasts turned milder and storage data came in less supportive than bulls had hoped.[1][2][5] Add it up and NG heads into this midterm-year summer window from a position of relative weakness, with weather, storage and macro sentiment all leaning against a sustained rally for now.
The chart below places the latest move in the context of the past year, alongside a 60-day seasonal projection.
What should traders watch as this Natural Gas (CME) seasonal window approaches?
The first marker is timing. The 113-day window tied to the last eight midterm election years opens on May 17, so price action in the days around that date will show whether NG respects its usual pattern of early chop followed by a drift lower, or instead breaks higher against the historical grain. A sustained push back above the 50-day moving average near 2.862 would signal that buyers are starting to challenge the bearish seasonal script, while a failure to hold even modest rallies would fit the traditional short-friendly profile.[3]
Weather and storage data will be the second key test. If summer heat arrives later or proves less intense than current expectations, cooling demand could disappoint and reinforce the historical tendency for prices to sag as inventories rebuild.[3][4] Conversely, a string of hotter-than-expected weeks that forces larger-than-normal draws or smaller builds could blunt the usual midterm-year weakness and turn this window into one of the rare challenges to the pattern.
Finally, traders should keep an eye on policy and macro headlines that intersect with energy markets, from regulatory debates to export-capacity discussions. In prior midterm election years, those crosscurrents have often coincided with the bearish NG seasonal trend, but a shift toward more supportive policy or stronger global growth could change the tone. The historical record is clear: eight for eight short-side wins with meaningful intraperiod swings. The next few months will show whether 2026 adds a ninth chapter to that story or becomes the cycle that breaks it.
Sources
- MarketWatch, "Natural-gas prices soar as temperatures drop" (Jan 20, 2026).
- The Wall Street Journal, "U.S. Natural Gas Futures Gain Ahead of Delayed Storage Data" (Dec 29, 2025).
- The Wall Street Journal, "U.S. Natural Gas Futures Extend Decline" (May 7, 2026).
- Reuters, "US natgas prices gain over 2% on mid-July heat forecasts" (Jul 2, 2025).
- The Wall Street Journal, "U.S. Natural Gas Futures Give Back Some Gains" (Dec 8, 2025).
- The Wall Street Journal, "U.S. Natural Gas Futures Slip in Choppy Trade" (Feb 19, 2026).
About this seasonal analysis
Seasonal pattern data is sourced from TradeWave.ai, which analyzes historical price behavior across annual calendar windows going back up to 30 years. Read the full data methodology or the book The 100-Year Pattern by Afshin Moshrefi (2026 edition). Past performance of seasonal patterns does not guarantee future results. This article is for informational purposes only and does not constitute investment advice.