Natural Gas (CME) (NG) Has Dropped in All 8 Midterm Summers, Shorts Averaged 7.92%
Natural Gas (CME) is hovering near $3 just as it approaches a 111-day midterm-election-year seasonal window that has historically favored the short side and delivered sharp intraperiod swings.

What is the seasonal pattern for Natural Gas (CME) (NG)?
Natural Gas (CME) has fallen in 8 of 8 midterm-election-year summer windows during this 111-day stretch, with an average gain of 7.92% for short positions in winning years.
Key takeaways
- 8 for 8 in this window, with short trades averaging 7.92% profit across the last eight midterm election years.
- The upcoming 111-day Natural Gas (CME) trading window starts on May 22 and runs deep into late summer.
- Percent Profitable is 100%, with 8 winners and 0 losers for the short-side seasonal pattern.
- Average winner profit of 7.92% combines with a Sharpe ratio of 1.85, pointing to a historically consistent edge for shorts.
- The TradeWave Ratio of 1.86 signals that price has typically traveled meaningfully in the trade direction within the window, even before final settlement.
- Intraperiod swings have been large, with some years showing adverse moves of more than 20% against the short before finishing lower.
According to historical data from TradeWave.ai, this midterm-election-year stretch in natural gas has behaved very differently from an average summer, with a clear directional bias that traders often overlook.
How has Natural Gas (CME) (NG) traded in past midterm-year summer windows?
Natural Gas (CME) has delivered profitable short-side results in all eight midterm-election-year windows that match this 111-day stretch, averaging 7.92% gains for shorts and an 83% cumulative return across cycles. The next iteration of this historical seasonality begins on May 22, with NG futures last trading at $3.04, up 2.7% on the day and sitting about 61.1% below their 52-week high of $7.827.[1] That combination of a strong bearish seasonal pattern and a contract still well off last year’s highs gives this window unusual weight for energy desks that anchor risk to the presidential election cycle.
Grouping the data by the presidential election cycle matters here because this pattern only looks at the last eight midterm election years, not every calendar year. Midterm years often bring shifting policy debates on energy, infrastructure and climate, which can alter hedging behavior and storage strategies in ways that do not show up in generic “summer” seasonality.
A second view shows how yearly net results line up with the best and worst intraperiod swings.
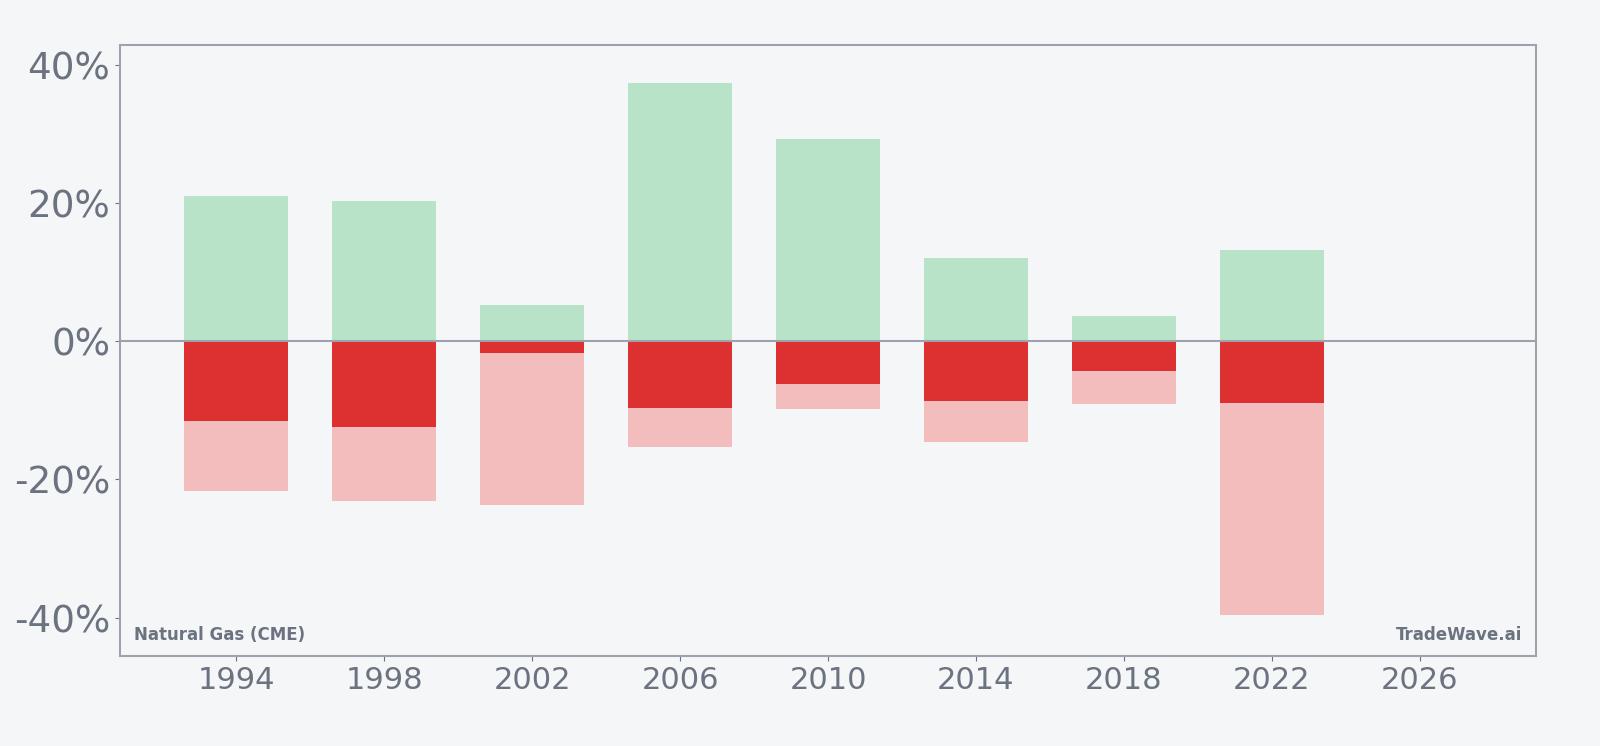
Across the eight midterm-year samples, every single window finished with NG lower than where it started, which is favorable for a short pattern. The strongest year for shorts was 1998, when the contract fell 12.46% from entry to exit, while 2002 was the softest outcome with a 1.73% decline that still counted as a win for the pattern. Add it up: the cumulative return for the short strategy across these eight windows is 83%, with a standard deviation of 3.62% and a Sharpe ratio of 1.85, which is unusually high for a commodity that often trades like a weather lottery.
The MFE/MAE profile shows why this NG seasonal trend has been both attractive and nerve-racking. In 2006, for example, the best intraperiod move in favor of the short reached 37.33%, but the worst drawdown against the position still hit 15.25% before prices rolled over. In 2022, the contract ultimately finished 8.87% lower over the window, yet shorts had to sit through a maximum adverse move of 39.69% at one point, underscoring how violent squeezes can be even in years that end up working for the pattern.
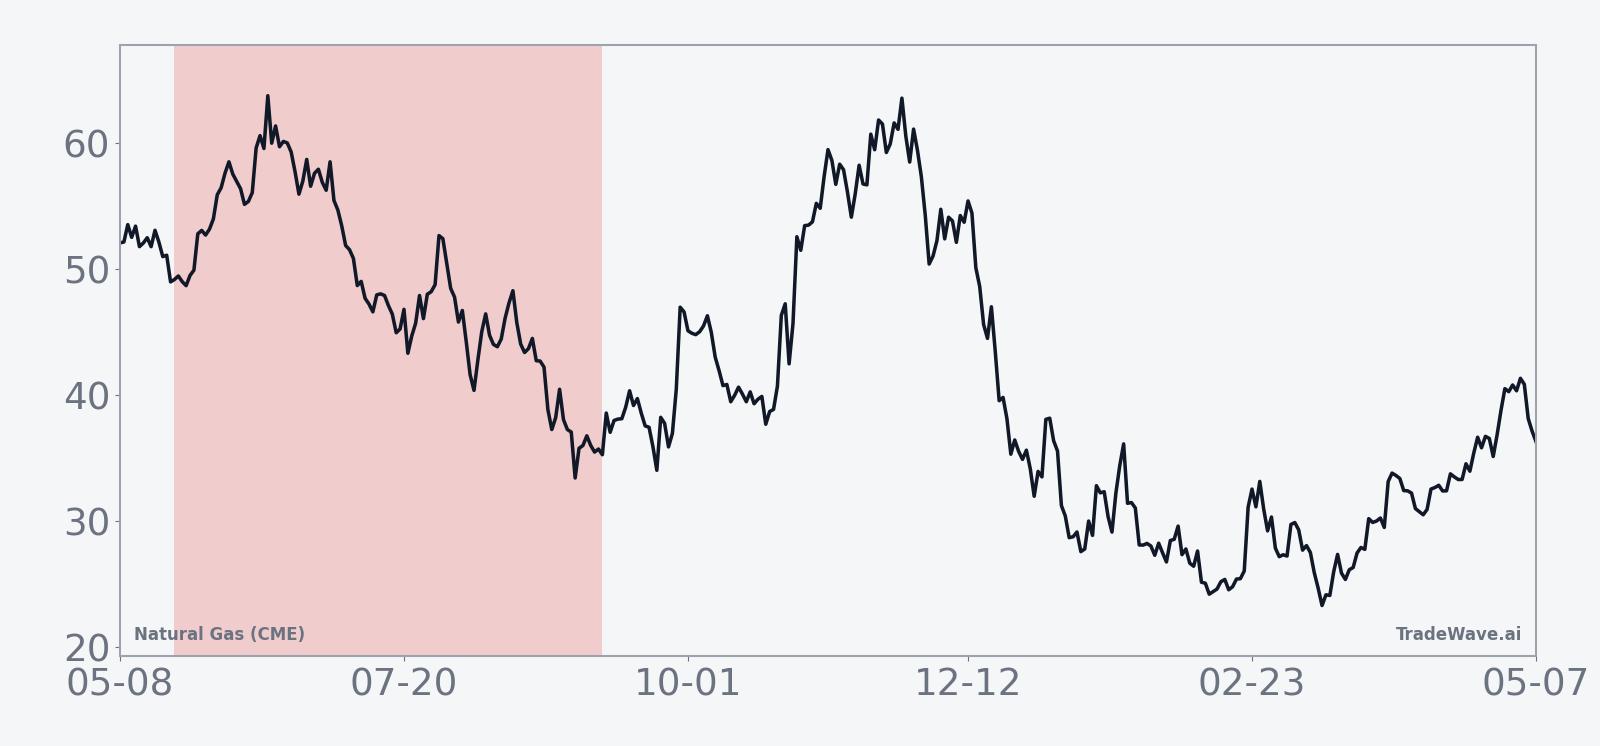
The typical path in the seasonal trend chart tilts lower over the full 111 days rather than collapsing all at once. In several years, NG chopped sideways or even spiked higher early in the window before weakness set in later in the summer, which fits the idea of weather and storage narratives flipping as updated forecasts and EIA data roll through. The cumulative return curve slopes steadily in favor of shorts, with no single year breaking the pattern, which is rare consistency for a contract known for its whipsaws.
History does not guarantee future results, and the adverse excursions within this window have at times been large even in years that ultimately finished lower.
Why does Natural Gas (CME) (NG) follow this seasonal pattern?
One likely driver is commodity supply and demand seasonality, as this window spans the transition from late spring into the core of the injection season when storage builds and shoulder-season demand can be soft. Analysts have also pointed to shifting weather expectations and evolving policy debates in midterm election years, which can change hedging behavior for utilities and producers without immediately altering physical balances.[2] The pattern may reflect a recurring tendency for early-summer optimism on heat-driven demand to fade as actual temperatures, LNG flows and storage data reset expectations.
What is driving Natural Gas (CME) (NG) today?
NG futures settled at $3.04, up 2.7% on the session, after trading between $2.967 and $3.05 on relatively light volume of 10,303 contracts versus a 20-day average of 116,168.8.[1] The contract has climbed 9.25% over the past month and is trading above its 50-day moving average of $2.85938, but it remains far below the 52-week high of $7.827, a reminder of how deep last year’s slide was.[1] That backdrop of a modest spring rebound inside a much larger downtrend is the canvas on which the upcoming midterm-year seasonal window will play out.
In December 2025, U.S. natural gas futures were heavily influenced by shifting winter weather forecasts and the pace of storage draws, with traders reacting to early cold followed by milder conditions that undercut heating demand.[3] On Dec 11, 2025, expectations centered on a 173 Bcf withdrawal that would trim a lingering storage surplus, while a week later the Energy Information Administration reported a 167 Bcf draw that cut the surplus versus the five-year average to 32 Bcf.[4] Those episodes underline how quickly sentiment can swing around weekly EIA data, a dynamic that will matter again as the market moves through the injection season covered by this NG seasonal trend.
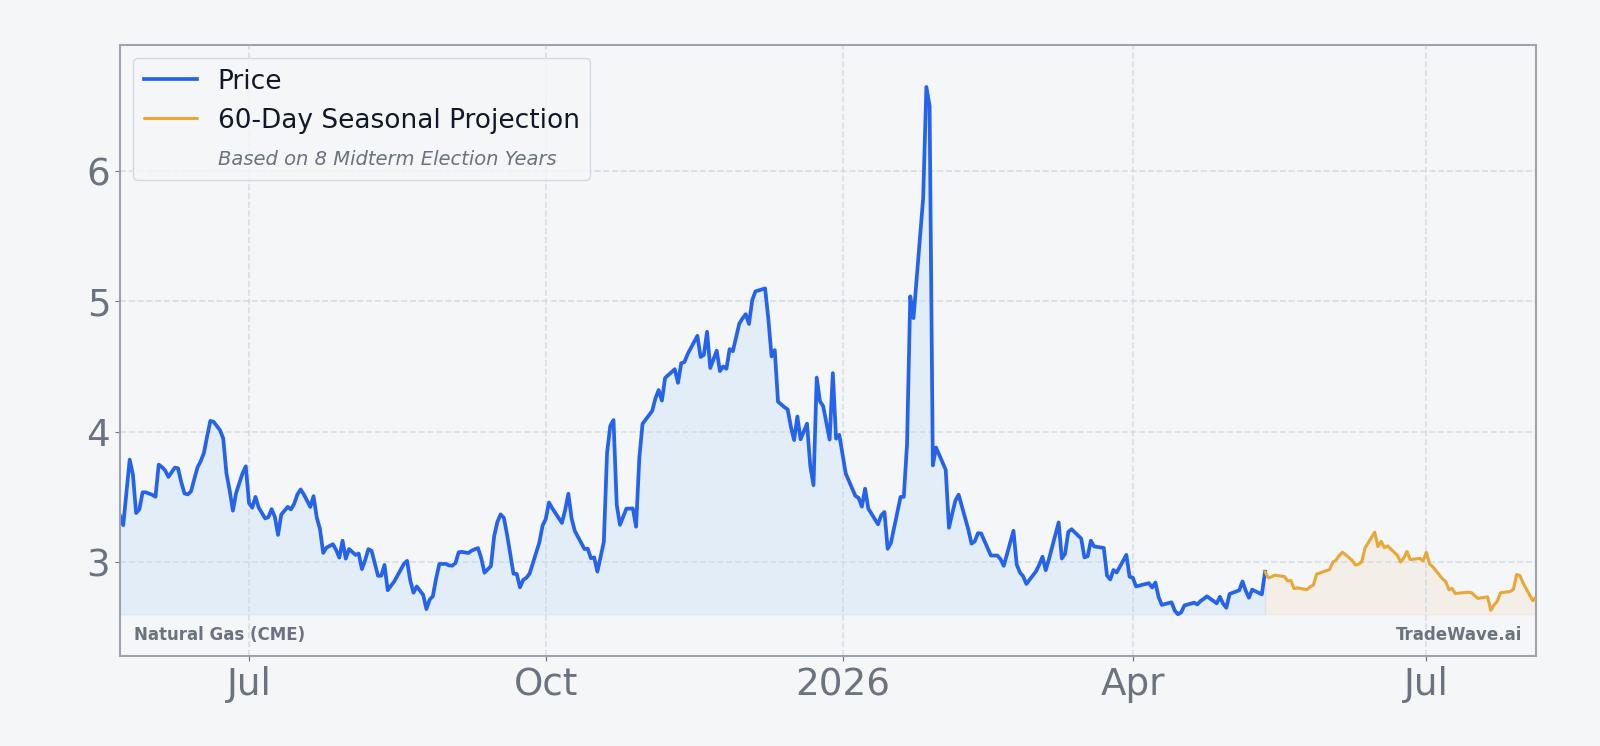
The chart below situates the latest move in its recent multi-month context alongside a short-term seasonal projection.
What should traders watch in this Natural Gas (CME) seasonal window?
The first marker is the calendar itself: the 111-day window starts on May 22 and runs through the heart of the injection season, when storage builds and weather narratives can flip quickly. Traders will be watching whether NG can hold above the 50-day moving average and the $3 handle as the window opens, or whether rallies continue to fade as they have in prior midterm election years.[1]
Weekly EIA storage reports will be the key macro catalyst inside this stretch, especially if injections come in larger than expected and rebuild a surplus versus the five-year average as they did after the December 2025 draws.[4] A pattern of heavier-than-forecast injections or persistent mild-weather forecasts would line up with the historical tendency for prices to soften over this window, while repeated bullish surprises on heat or LNG exports could stress the short-side pattern and produce the kind of sharp adverse moves seen in 2006 and 2022.
Price behavior relative to the seasonal projection on the 60-day chart is another tell. If NG starts to roll over in late May and June in line with the historical NG seasonal trend, that would reinforce the idea that the midterm-year pattern is still in play. A sustained break higher through resistance levels on strong volume, by contrast, would signal that this cycle is diverging from the last eight and that weather, policy or global gas dynamics are rewriting the script.
Finally, volatility itself is a signal. The historical MFE and MAE profile shows that even winning short windows have featured large squeezes before prices ultimately moved lower. Traders will be watching whether intraday and weekly ranges expand as the window progresses, and whether those spikes are being sold into or chased higher. How NG behaves around those swings will tell the market whether this midterm-year seasonal pattern is repeating or being challenged by a new regime.
Sources
- [1] The Wall Street Journal, “U.S. Natural Gas Settles Lower in Volatile Session,” Dec 18, 2025. wsj.com
- [2] The Wall Street Journal, “U.S. Natural Gas Picks Up Ahead of Storage Data,” Dec 10, 2025. wsj.com
- [3] The Wall Street Journal, “U.S. Natural Gas Futures Extend Decline,” Dec 12, 2025. wsj.com
- [4] The Wall Street Journal, “U.S. Natural Gas Settles Lower in Volatile Session,” Dec 18, 2025. wsj.com
About this seasonal analysis
Seasonal pattern data is sourced from TradeWave.ai, which analyzes historical price behavior across annual calendar windows going back up to 30 years. Read the full data methodology or the book The 100-Year Pattern by Afshin Moshrefi (2026 edition). Past performance of seasonal patterns does not guarantee future results. This article is for informational purposes only and does not constitute investment advice.