9-of-10 Losing Summers: Corn (CME) (ZC) Shorts Eye a 74-Day Window Averaging 12% Declines
Corn (CME) futures sit just below a 52-week high as a late-May seasonal window approaches that has historically favored downside moves and sharp intraperiod swings.
What is the seasonal pattern for Corn (CME) (ZC)?
Corn (CME) has fallen in 9 of 10 years during this late-May 74-day window, with an average 13.6% loss in winning years for the short setup.
- 9 for 10 in this window, with the short side averaging 13.6% gains in winning years.
- Percent Profitable is 90%, with 9 winners and 1 loser for the short pattern across the past decade.
- Including every year, Avg Profit - All is still a sizable 12%, reflecting only one losing season.
- The window runs 74 trading days starting May 28, capturing the heart of the Northern Hemisphere growing season.
- TradeWave Ratio of 2.02 signals that price has typically traveled meaningfully in the trade direction within the window.
- Sharpe ratio of 1.43 points to strong risk-adjusted returns for the historical short pattern, though intraperiod swings have been large.
According to historical data from TradeWave.ai, this upcoming stretch in corn futures has behaved very differently from an average summer on the calendar, and the next iteration begins in less than a week.
How has Corn (CME) (ZC) traded in this late-May seasonal window?
Corn (CME) has dropped in 9 of the past 10 years during the 74 trading days starting May 28, with the short side posting an average 13.6% gain in winning seasons. Today the front-month contract settled at 461.75 cents per bushel, down 0.1% on the session and about 5.3% below its 52-week high of 487.5, leaving prices elevated but off the top of the recent range.
TradeWave’s stats frame this as a short-biased window. Percent Profitable sits at 90%, with 9 winning short years and just 1 losing year across the past decade. Average profit in those winning years is 13.6%, while the all-years average, which includes the lone loss, still comes in at 12%. The Sharpe ratio of 1.43 suggests that, historically, the risk-adjusted outcome for shorts in this slice of the calendar has been unusually strong for a commodity contract.
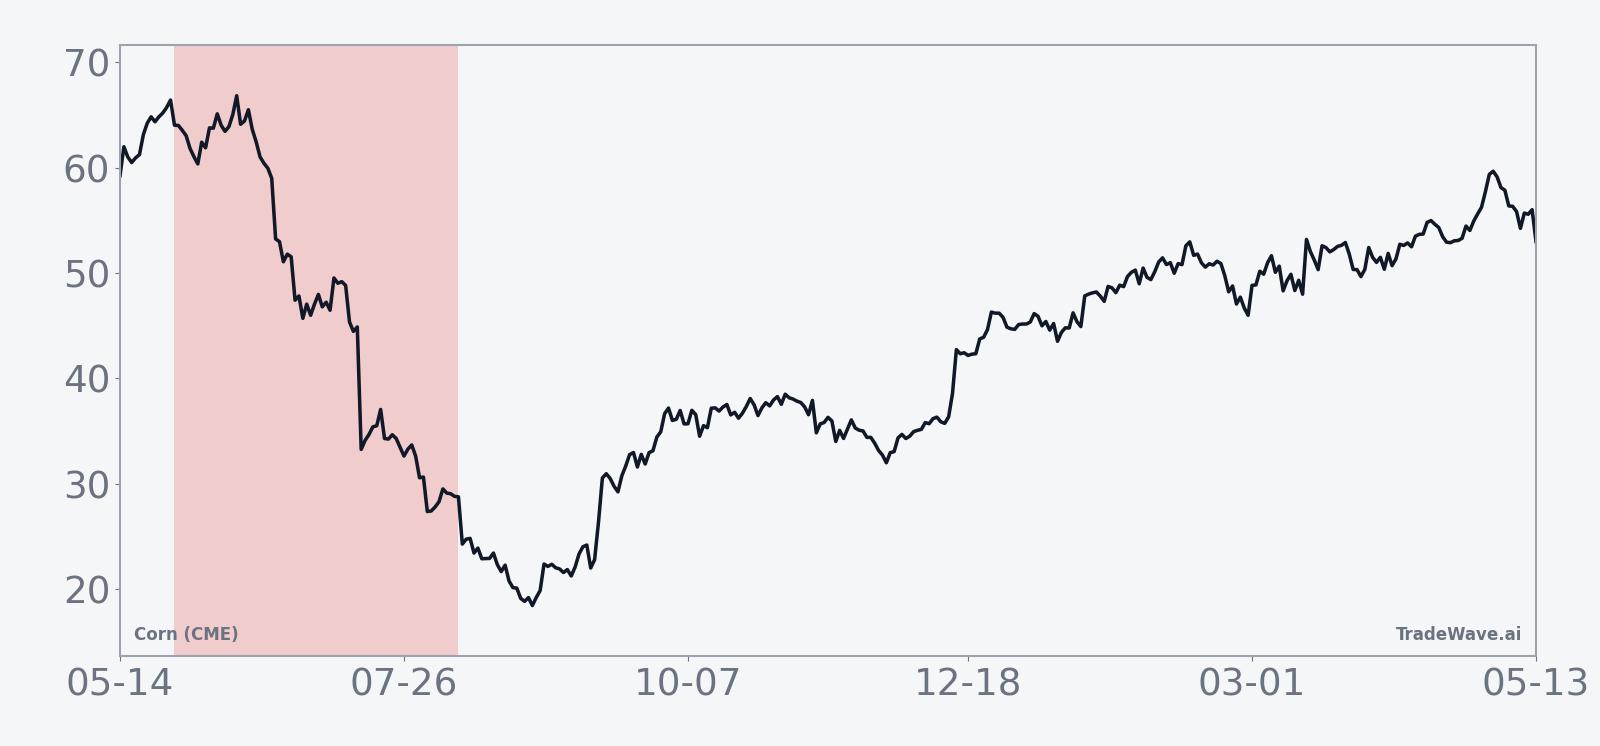
The 10-year seasonal trend chart shows that most of the downside for corn in this window has tended to accrue in the middle third of the period, after an initially choppy start. In several years, prices have drifted sideways or even ticked higher early on before breaking lower more decisively as the window progressed. That pattern fits a market that often waits for clearer visibility on crop conditions before repricing supply risk.
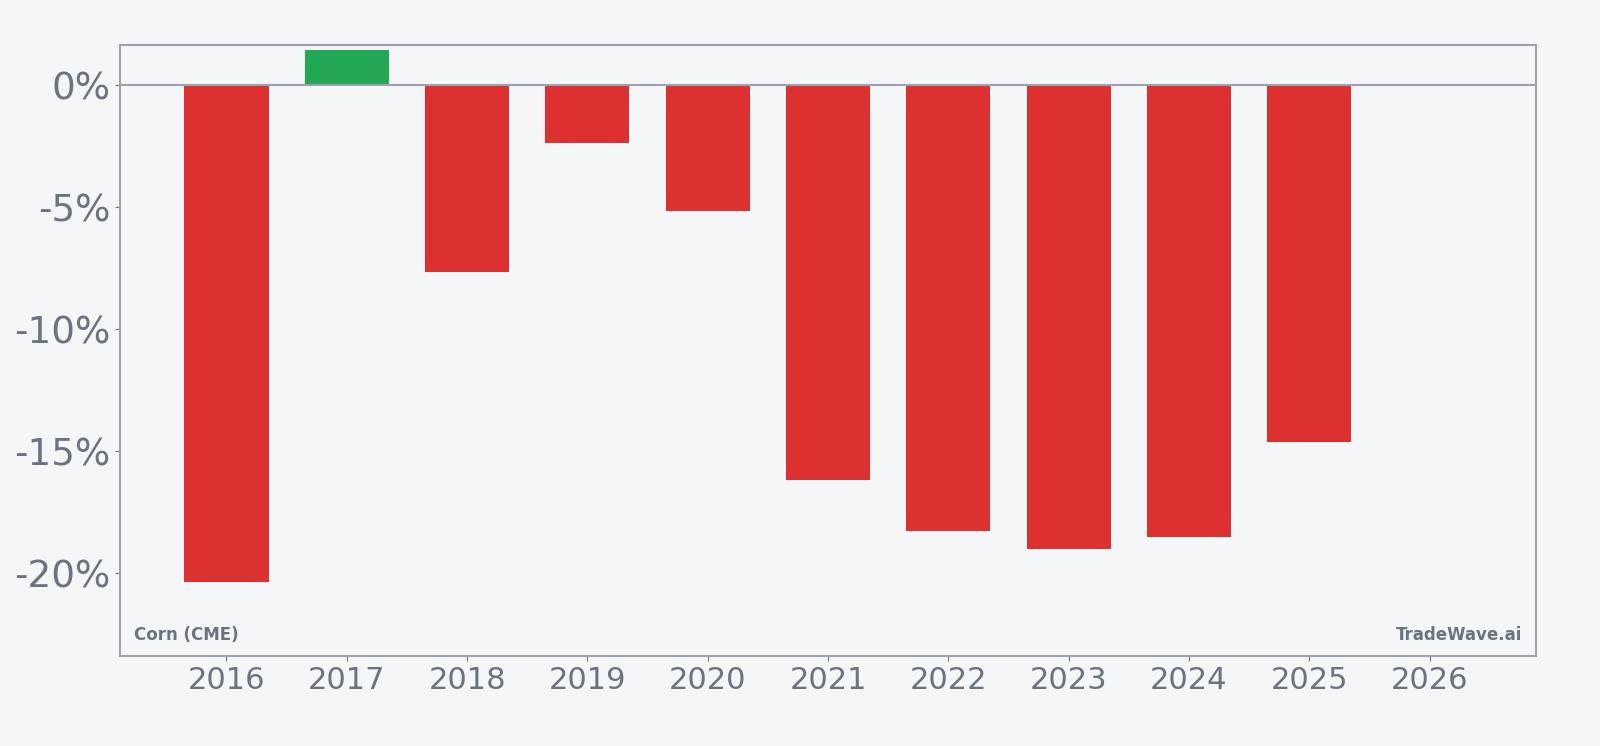
Year-by-year bars that combine net results with peak favorable and adverse moves highlight how far corn has swung inside this window.
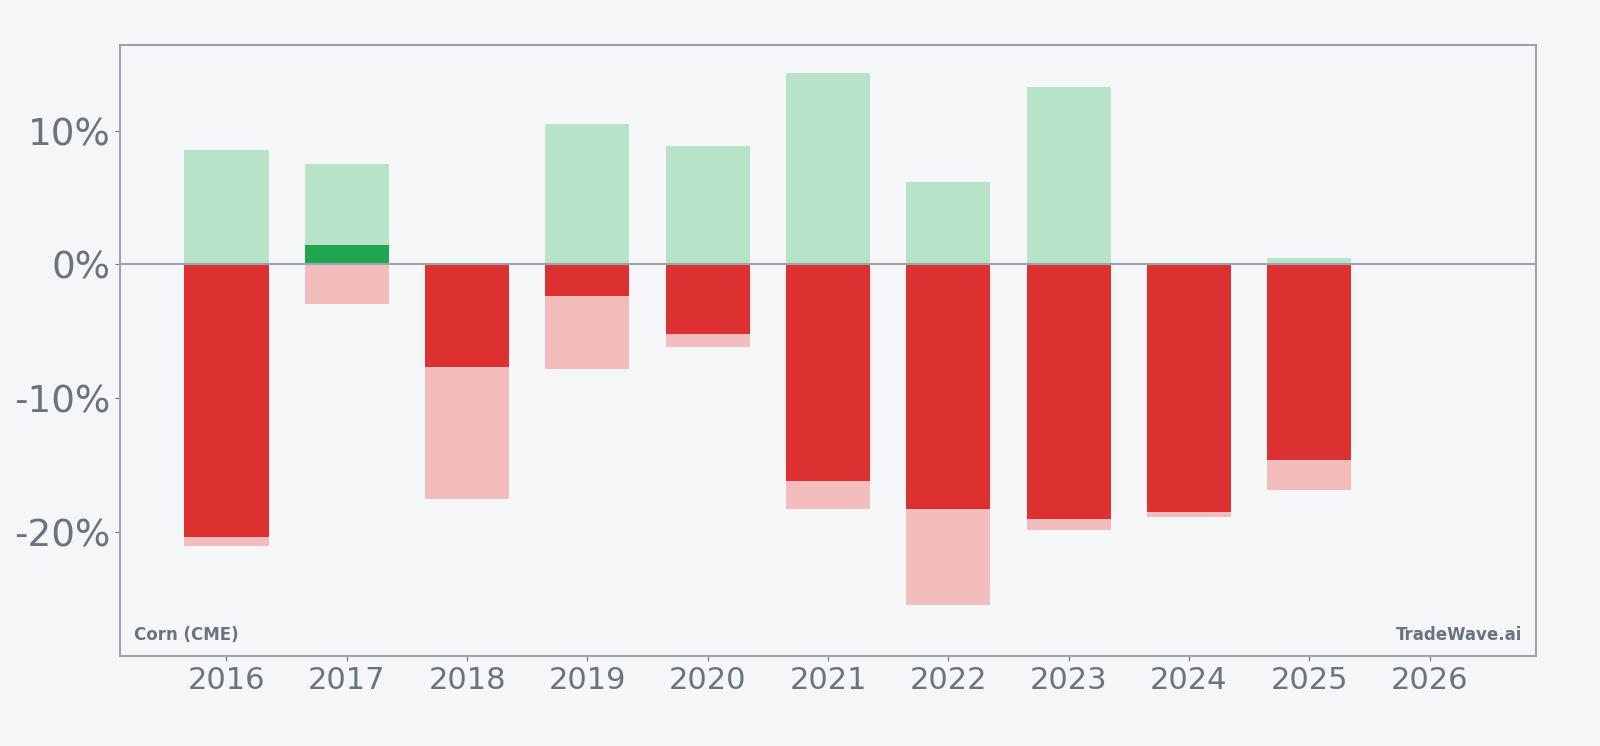
The bars with maximum favorable and adverse excursions show that even in strong short years, corn has often staged sizable rallies inside the window before rolling over. In 2016, for example, the short trade finished up 20.38%, but the contract still saw an 8.52% move against shorts at one point, while the worst drawdown from entry reached 21.06%. At the other end of the spectrum, 2017 stands out as the lone losing year for shorts, with a modest 1.43% net loss and a relatively contained 2.93% worst adverse move, underscoring that the pattern’s failures have been shallow compared with its best outcomes.
History does not guarantee future results; adverse excursions (MAE) can be large even in winning windows.
Why does Corn (CME) (ZC) follow this seasonal pattern?
This late-May through summer window lines up with the key growing season in the U.S. Corn Belt, when weather forecasts, planting progress and early crop-condition reports start to firm up supply expectations. One likely driver is that initial fears about planting delays or drought often ease as better data arrives, encouraging hedging and pressuring prices after spring weather premiums are built in. The pattern may also reflect commercial selling and risk management as producers and merchandisers lock in prices ahead of harvest, adding a structural short bias to this part of the calendar.
What is driving Corn (CME) (ZC) today?
Corn futures ended Friday at 461.75 cents, down 0.5 cents on the day, leaving the contract roughly 5.3% below its 52-week high of 487.5 and well above the 52-week low of 368.75. Volumes remain light relative to the 20-day average of 223,238 contracts, with just 11,066 contracts changing hands in the latest session, as traders weigh a calmer macro backdrop against still-elevated price levels.
In January 2026, a U.S. Department of Agriculture report showing higher-than-expected ending stocks for corn and soybeans knocked grain futures sharply lower, reminding the market how quickly supply estimates can reset price expectations.[1] On Apr 30, 2026, Chicago grain futures came under renewed pressure as crude oil retreated and forecasts pointed to improving weather across the central United States, easing concerns about planting and early crop stress.[2] Those earlier shocks have faded, but they left corn trading in a broad range where macro inputs like energy prices and weather models can swing sentiment quickly.
The chart below situates the latest move in its recent multi-month context and overlays the upcoming seasonal projection.
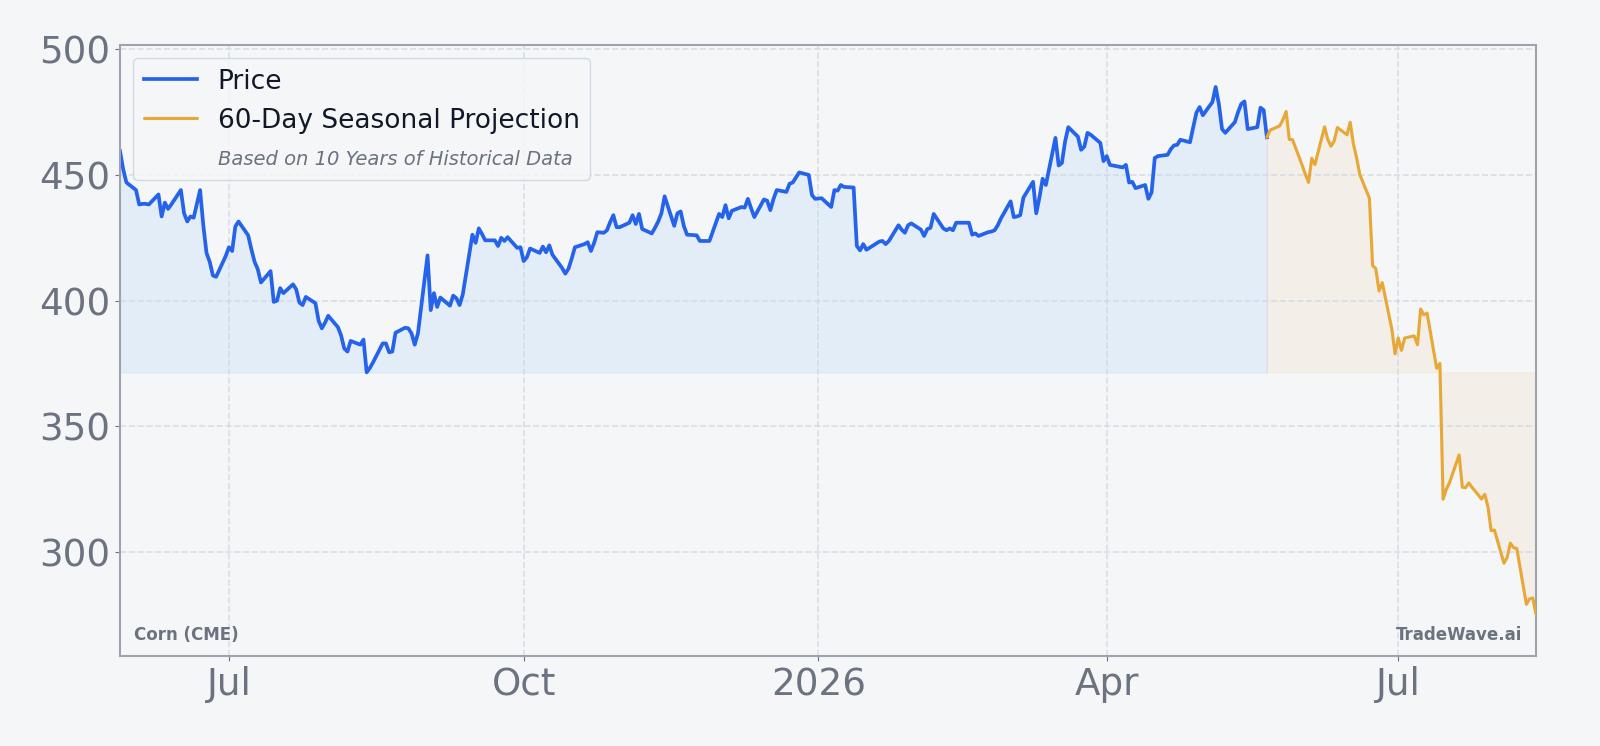
What should traders watch as this seasonal window opens?
With corn sitting near the upper half of its 52-week range and the short-biased seasonal window set to begin on May 28, the next few weeks will test whether this decade-long pattern repeats or fades. The first key watchpoint is weather: if forecasts continue to show favorable conditions across the Corn Belt, the market may be more willing to lean into the historical tendency for prices to soften as supply confidence builds.[2] Conversely, any shift toward hotter, drier outlooks could blunt or delay the usual seasonal pressure.
Second, traders will be watching upcoming USDA updates on acreage, yield assumptions and ending stocks, given how sharply the January report reset expectations earlier this year.[1] A string of reports that confirm comfortable stock levels would rhyme with prior years in this window, when improving balance-sheet visibility coincided with lower prices. Finally, price action itself will matter: if corn fails to break lower despite historically bearish seasonality, that would signal a regime shift in the ZC seasonal trend and force short sellers to reassess how much weight to give this pattern in a year shaped by shifting weather and macro inputs.
Sources
About this seasonal analysis
Seasonal pattern data is sourced from TradeWave.ai, which analyzes historical price behavior across annual calendar windows going back up to 30 years. Read the full data methodology or the book The 100-Year Pattern by Afshin Moshrefi (2026 edition). Past performance of seasonal patterns does not guarantee future results. This article is for informational purposes only and does not constitute investment advice.