9 of 10 Early-Summer Windows Have Hit Lean Hogs (LH) Shorts for 20%+ Declines
Lean Hogs is approaching a historically weak 60-day early-summer stretch, just as prices hover below recent highs and traders weigh tight supply against choppy consumer demand.
What is the seasonal pattern for Lean Hogs (LH)?
Lean Hogs has fallen in 9 of 10 years during this early-June 60-day window since 2016, with an average 20.31% gain in winning short years.
- 9 for 10 in this window, with winning short years averaging 20.31% price declines from entry to exit.
- The 60-day Lean Hogs trading window starts on Jun 4 and has historically favored short exposure in early summer.
- Percent Profitable is 90%, with 9 winners and 1 loser across the past decade of this LH seasonal trend.
- Average profit across all years, including the lone losing year, is still a hefty 18% in the trade direction.
- Intraperiod swings are large, with several years showing double-digit peak run-ups and deep drawdowns before the move completes.
- Add it up: a 413% cumulative return for the short pattern across ten early-summer windows since 2016.
According to historical data from TradeWave.ai, this early-June window in Lean Hogs has behaved very differently from an average month on the calendar. The next section walks through what that pattern has looked like over the past decade and how it frames the upcoming 2026 setup.
How has Lean Hogs (LH) traded in the early-summer seasonal window?
Lean Hogs has delivered profitable short-side moves in 9 of the past 10 early-summer windows, with winning years averaging 20.31% declines over the 60-day stretch. The next iteration of this historical seasonality begins on Jun 4 and runs through early August, a period that has often seen sharp repricing as summer demand expectations collide with actual slaughter and export flows. For livestock traders, this is one of the most statistically consistent Lean Hogs trading windows on the calendar, but it has also come with deep intraperiod swings that can punish mistimed entries.
The trade direction for this pattern is explicitly short, which means negative returns are the favorable outcome for the strategy. Across the ten-year lookback, the window has produced a 413% cumulative return in the trade direction, with an 18% average move when every year is included. The lone losing year was 2023, when Lean Hogs finished the window up 0.86% from entry, even though prices still swung nearly 20% in the favorable direction at one point before reversing.
Average winner gains of 20.31% highlight how powerful the down years have been, but the distribution is not gentle. In 2018, for example, the contract dropped 36.28% from entry to exit, with the worst intraperiod drawdown from the entry level reaching 36.35% before the move stabilized. In 2021, a similar pattern played out, with a 25.79% net decline and a 28.73% maximum adverse excursion from the starting price, underscoring how quickly risk can build even in years that ultimately reward shorts.
The historical seasonal average shows weakness building fairly steadily through the window rather than a single crash point. Returns tend to drift lower from the early days of June into mid-July, with the bulk of the move often realized before the final two weeks. That profile suggests the typical pattern is a grinding repricing lower rather than a one-day shock, even though individual years have seen sharp air pockets.
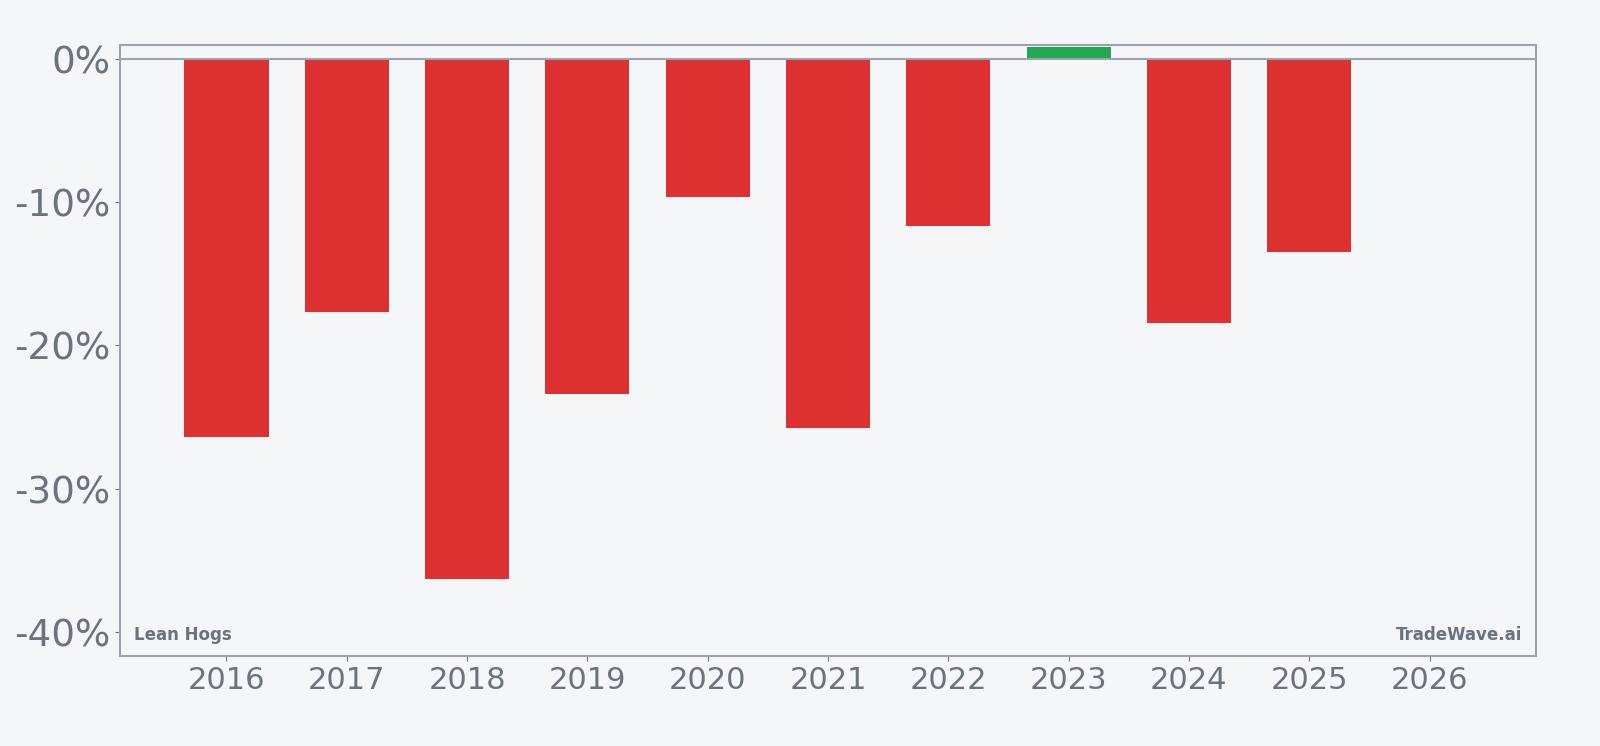
Year-by-year net returns and intraperiod swings show how often early-summer weakness has appeared and how large the moves have been.
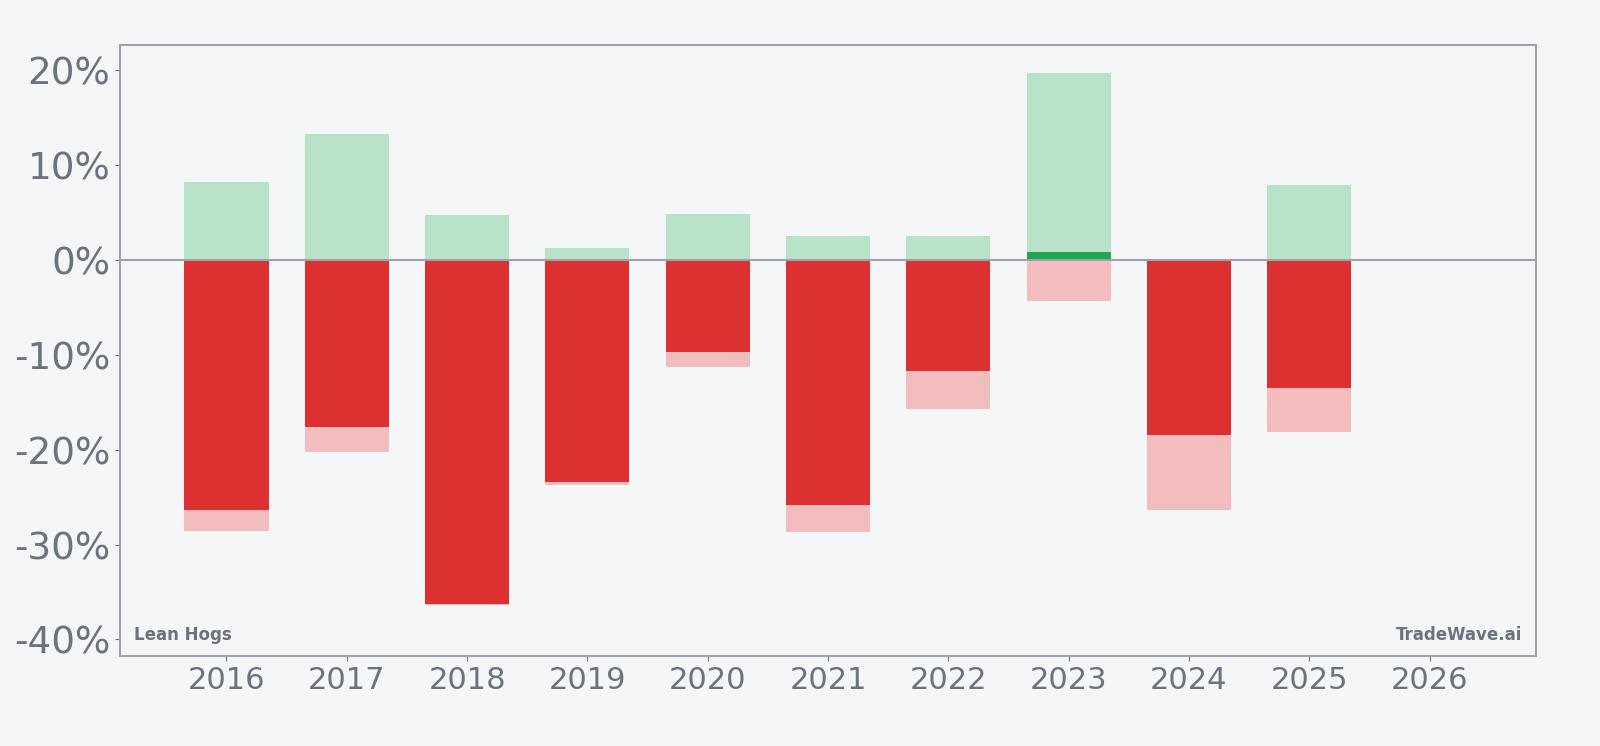
The combined net, peak favorable move and worst drawdown bars show a high-variance environment where both sides of the tape can be tested. Several years, including 2016, 2018 and 2024, saw maximum adverse excursions from entry in the mid-20% to high-20% range even as the final net move still favored shorts. That mix of large maximum favorable excursion and large maximum adverse excursion is a reminder that this historically bearish Lean Hogs seasonal pattern has not been a straight line.
History does not guarantee future results; adverse excursions (MAE) can be large even in winning windows.
Why does Lean Hogs (LH) follow this seasonal pattern?
This early-summer Lean Hogs seasonal pattern likely reflects commodity supply and demand seasonality more than technical quirks. Analysts often point to the transition from spring grilling demand into midsummer, when slaughter numbers rise, carcass weights fluctuate and export flows can soften just as domestic consumption levels off. The result has often been a window where expectations built up in late winter and spring get marked back to reality, producing the repeated early-summer pressure seen in the historical seasonality.
What is driving Lean Hogs (LH) today?
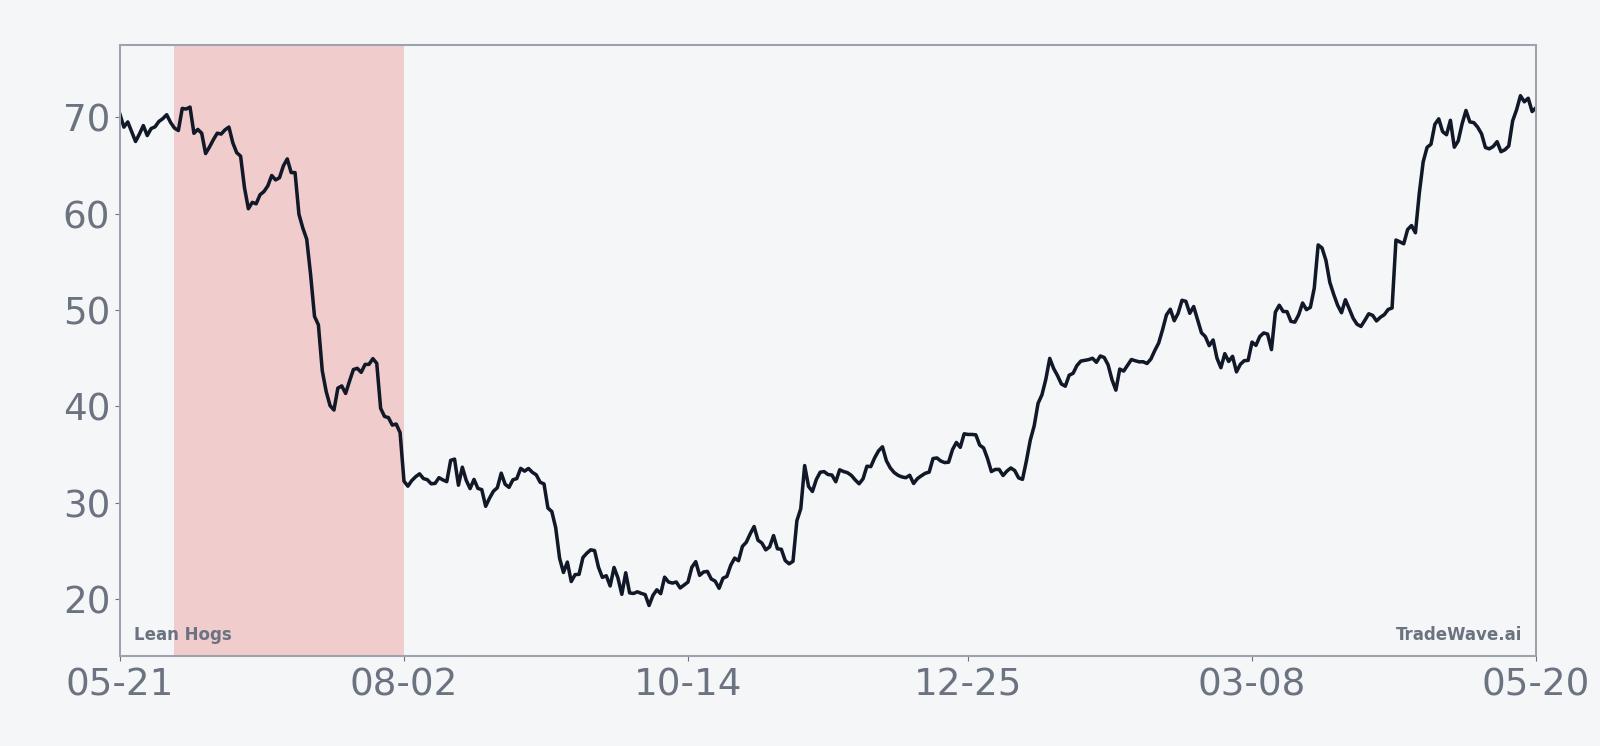
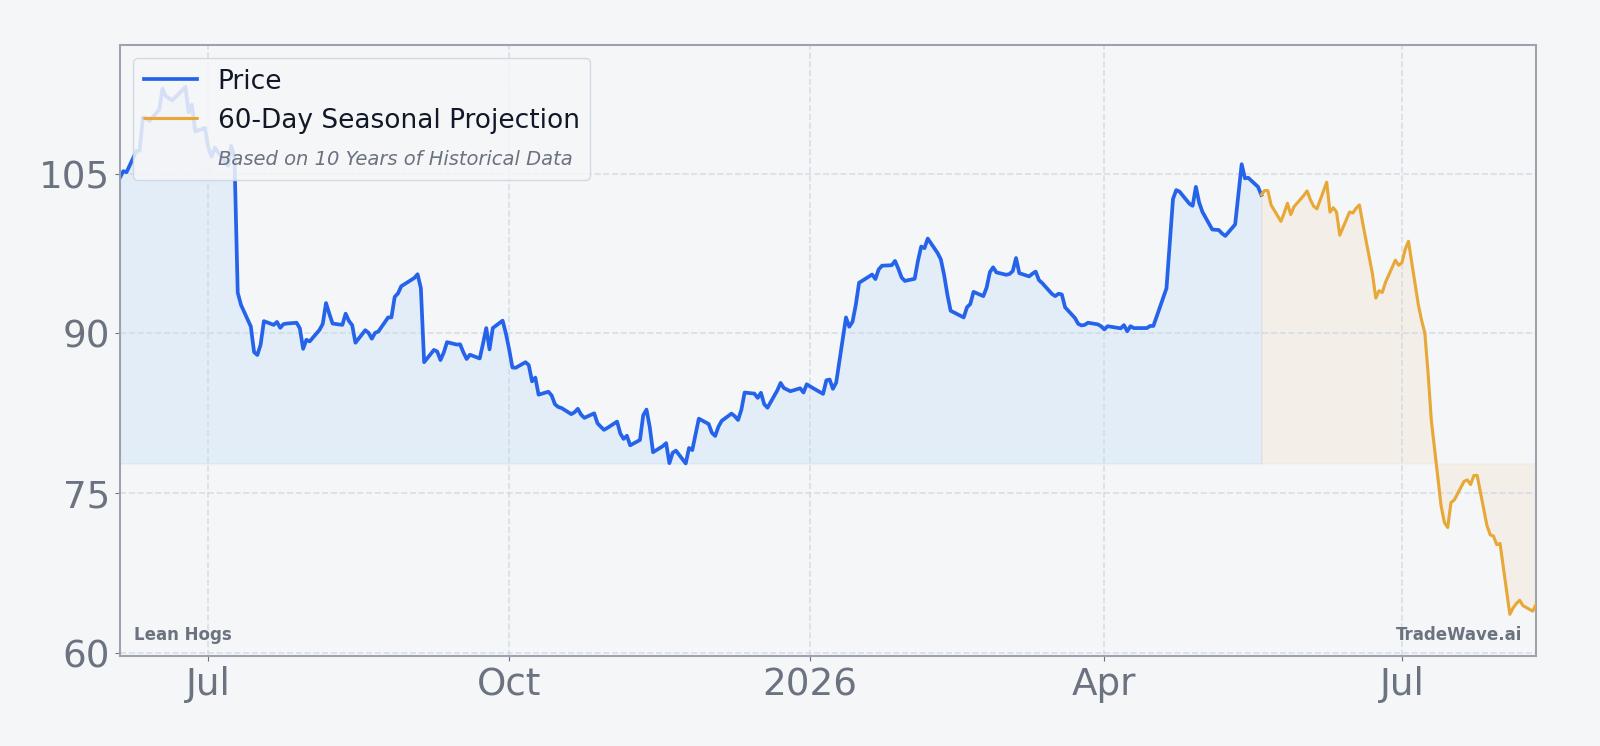
With the 2026 early-summer window still two weeks away, Lean Hogs is trading without a clear fresh macro catalyst and with limited near-term data on either the dollar or global protein demand. The front-month contract last settled at 101.975 on May 19, leaving it below the 52-week high of 113.375 but well above the 77.125 low, and roughly in line with a 50-day moving average near 95.77 based on recent settlement data. In the past month the contract has gained 12.62%, a reminder that the upcoming historically weak seasonal stretch is approaching from a position of relative strength rather than distress.
That backdrop matters because Lean Hogs is a key input into food inflation and protein margins, and its swings often ripple into livestock equities and broader commodity indices. A firm tape heading into a historically soft window can amplify volatility if slaughter data, cold storage reports or export numbers fail to match bullish expectations. For traders who track historical seasonality, the combination of a strong one-month rally and a looming short-favored window is exactly the kind of setup that has produced outsized moves in prior years.
The chart below situates the latest move in its recent multi-month context and overlays the upcoming 60-day seasonal projection.
How do supply, demand and positioning intersect with this Lean Hogs seasonal trend?
While detailed positioning and inventory data are limited in the current dataset, the structure of the Lean Hogs seasonal pattern lines up with well-known fundamentals in the hog complex. Early summer often brings heavier marketings as producers move animals out of barns ahead of the hottest months, which can swell near-term supply even if farrowings and herd numbers are not expanding aggressively. At the same time, domestic demand can plateau after the initial grilling-season surge, and export buyers sometimes step back if currency moves or trade headlines make U.S. pork less competitive.
In that environment, even modest surprises in weekly slaughter, carcass weights or export sales can trigger outsized price reactions. The historical pattern of large maximum favorable and adverse excursions inside the window suggests that speculative positioning has often been stretched heading into June, leaving the market vulnerable to squeezes and air pockets before the prevailing trend reasserts itself. For risk managers, the key takeaway is that this is not a quiet shoulder season for Lean Hogs; it is a period where both fundamentals and positioning have repeatedly combined to produce big tape swings.
What should traders watch in the upcoming Lean Hogs (LH) window?
As the Jun 4 start date approaches, the first thing to watch is whether the recent 12.62% one-month rally stalls or extends into the window. A failure to make new highs as the calendar flips into June would be more consistent with the historical pattern of early-summer softness, while a decisive breakout above the 113.375 area would signal that this cycle is starting from a very different place than most of the past decade. Traders will also be focused on weekly slaughter and carcass-weight data, which can quickly shift perceptions of near-term supply.
Second, export sales and any currency-driven shifts in global protein trade will matter for how aggressively packers and producers hedge into the window. A firm dollar and softer overseas demand have historically lined up with some of the deeper drawdowns in Lean Hogs, while strong export prints can blunt the seasonal downside even if they do not fully erase it. Finally, behavior inside the window itself will be the real test of this LH seasonal trend: if prices start to roll over in the first few weeks and intraperiod rallies are sold rather than chased, that would echo the pattern seen in 9 of the last 10 years. If instead the contract grinds higher with shallow pullbacks, it would mark a rare challenge to one of the more consistent early-summer patterns in the livestock complex.
Sources
About this seasonal analysis
Seasonal pattern data is sourced from TradeWave.ai, which analyzes historical price behavior across annual calendar windows going back up to 30 years. Read the full data methodology or the book The 100-Year Pattern by Afshin Moshrefi (2026 edition). Past performance of seasonal patterns does not guarantee future results. This article is for informational purposes only and does not constitute investment advice.