Tariff Shock: 50% Brazil Levy Hits Beans Just as Coffee (KC) Enters Weak June Stretch
Coffee futures are sliding toward 52-week lows just as a historically bearish 14-day early-June seasonal window comes into play for short trades.
What is the seasonal pattern for Coffee (KC)?
Coffee has fallen in 14 of 15 years during this early-June 14-day window for short trades, with an average gain of 4.5% in winning years.
- 14 for 15 in this window, with short trades averaging 4.5% gains in winning years and a 4% average across all years.
- The early-June Coffee trading window runs 14 days from Jun 4 and has been profitable for shorts in 93% of years.
- There have been 14 winning years and just 1 losing year for the short trade setup across the 15-year lookback.
- Average loss in the lone losing year was -6.87%, showing that when the pattern fails it can fail hard.
- The TradeWave Ratio of 2.45 signals that Coffee typically travels meaningfully in the trade direction within this window.
- Sharpe ratio of 0.99 points to a historically attractive risk-adjusted profile for this specific seasonal short pattern.
According to historical data from TradeWave.ai, this early-June stretch in Coffee has behaved very differently from an average month on the calendar, with a clear downside tilt for short trades.
How has Coffee (KC) traded in this early-June seasonal window?
Coffee has delivered profitable short trades in 14 of the past 15 years during the 14-day window that begins on Jun 4, averaging 4.5% gains in winning years. Today the front-month KC contract settled at 252.65 cents per pound, down 2.5% on the session and sitting just above its 52-week low of 252.40 while more than 40% below last year’s 437.95 peak.
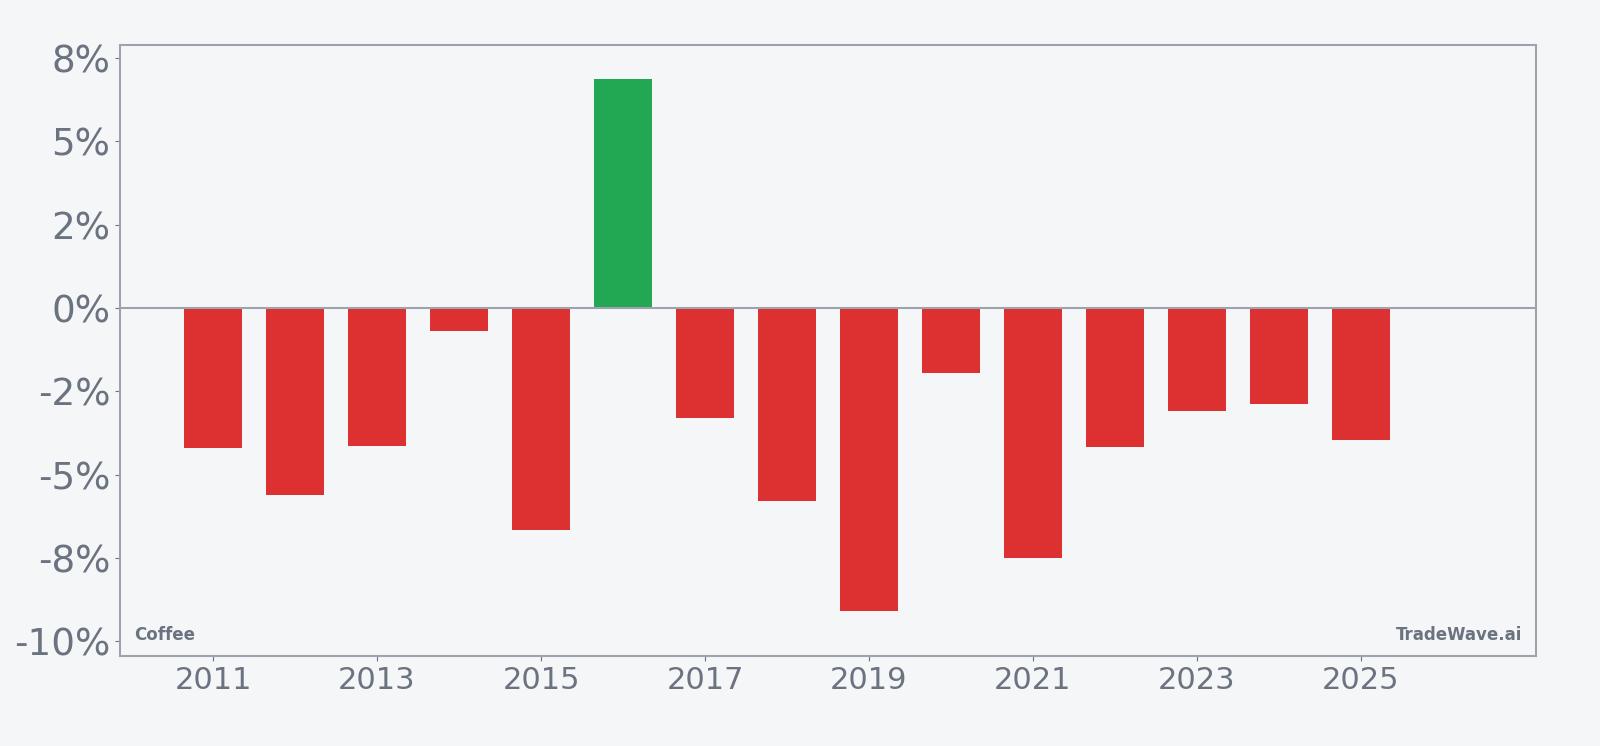
For this pattern the trade direction is explicitly short, so negative net returns are the favorable outcome. Across the 15-year sample, 14 years delivered profits for shorts and only one year produced a loss, giving the window a 93% success rate for the strategy. Average profit in those winning years is 4.5%, while including the lone losing year trims the all-years average to 4%, which is still a sizable move for a two-week Coffee trade.
The per-year table shows how that consistency has played out. In 2016, for example, the short trade gained 6.87% as Coffee fell from 131.70 to 140.75 on a net-return basis for the pattern, while 2019 stands out as one of the strongest years for shorts with a 9.09% net gain and a worst intraperiod drawdown of -10.22% from entry. The only losing year in the sample posted a -6.87% result, underscoring that when the pattern misses, it can miss by a meaningful margin.
The 15-year seasonal trend chart shows that, on average, Coffee tends to weaken fairly steadily across the window rather than spiking in a single session. The typical path is a grind lower, with modest early softness that often accelerates into the back half of the period, which aligns with the high share of profitable short years.
Year-by-year bars that combine net results with peak rallies and worst drawdowns help frame how far Coffee has tended to move inside this window.
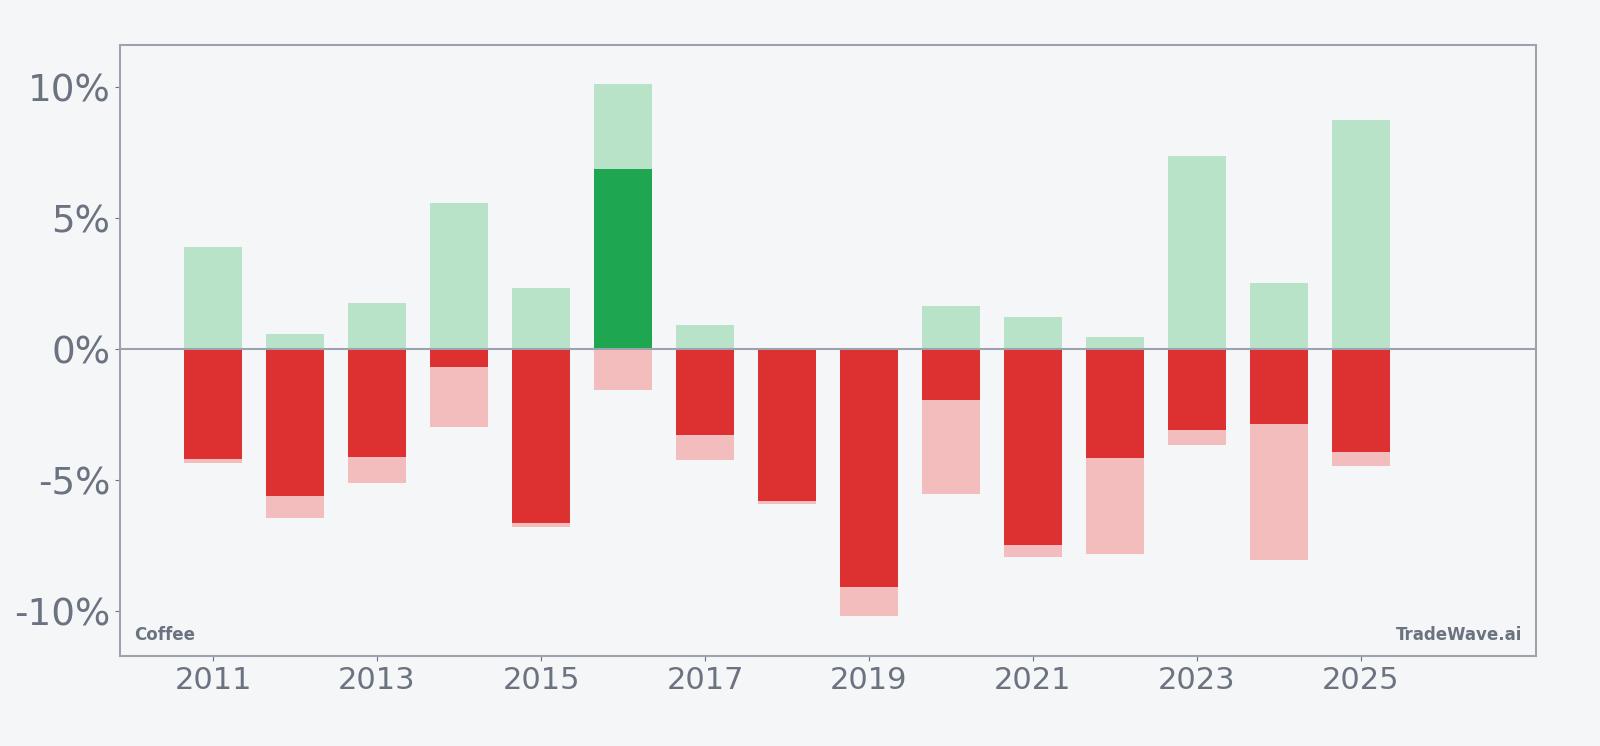
The combined net, peak favorable move and worst drawdown bars show that even in winning years, Coffee often experiences sizable countertrend rallies before resuming lower. Maximum favorable excursions for shorts have reached into high single digits in several years, while maximum adverse excursions have at times pushed beyond -8%, highlighting that intraperiod volatility can be sharp in both directions even when the final outcome favors the seasonal short.
History does not guarantee future results; adverse excursions (MAE) can be large even in winning windows.
Why does Coffee (KC) follow this seasonal pattern?
This early-June Coffee seasonal pattern likely reflects commodity supply and demand seasonality around the Northern Hemisphere summer, when weather risks, harvest expectations and shipping flows can shift positioning. Analysts often point to the way roasters and traders adjust hedges ahead of key crop updates, which can create short-term pressure on futures prices. The pattern may also capture how speculative capital rotates around other soft commodities at this time of year, leaving Coffee vulnerable to profit-taking and fresh short interest.
What is driving Coffee (KC) today?
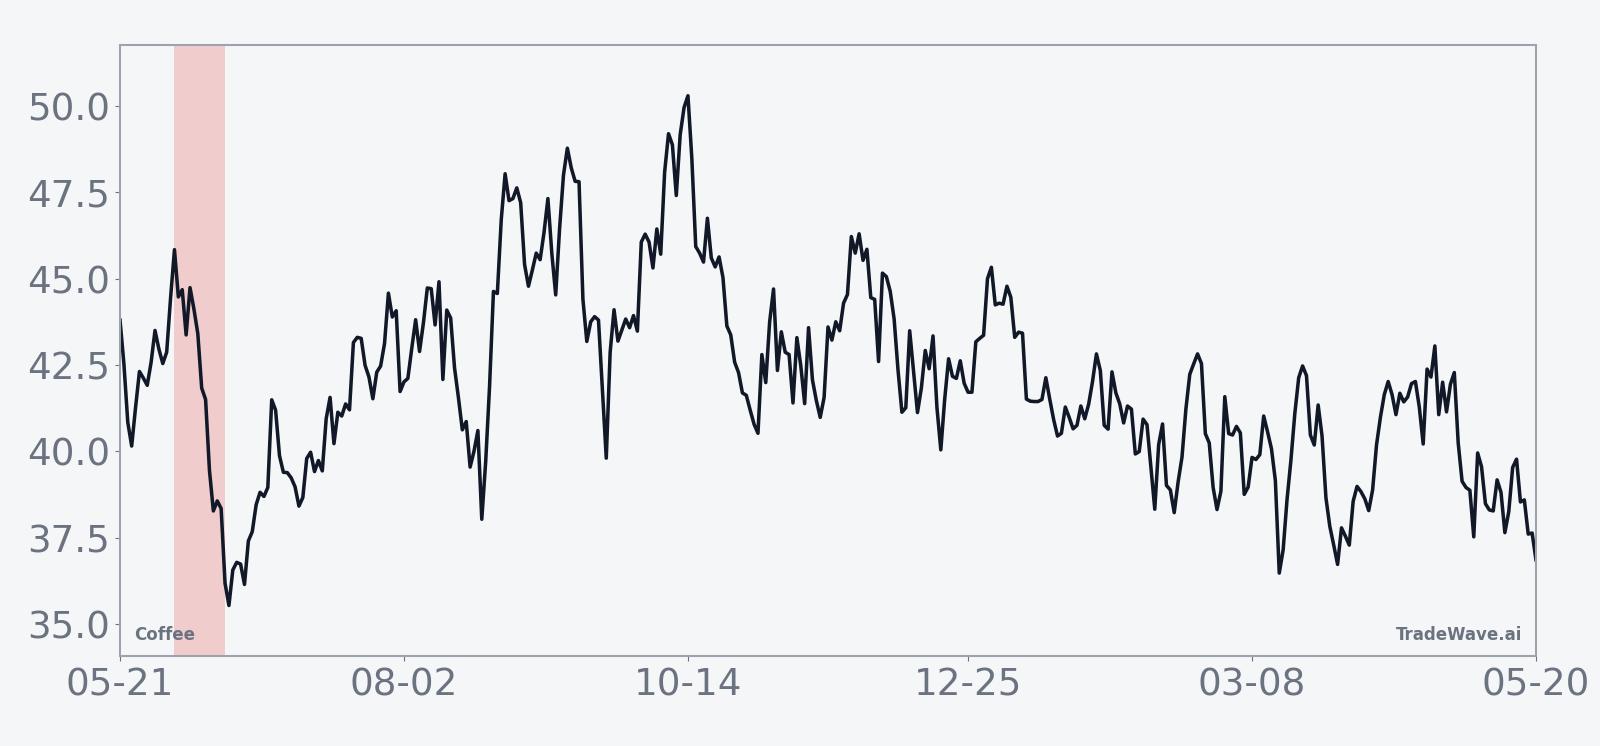
Coffee futures dropped 2.5% on Jun 4 to 252.65, extending a one-month slide of 15.63% and leaving the contract just 0.1% above its 52-week low of 252.40 while trading far below last year’s 437.95 high. Volume reached 19,764 contracts against a 20-day average of 8,542, signaling heavier-than-normal activity as prices probe the bottom of the recent range. With the 50-day moving average up at 290.85, Coffee is trading well under its short-term trend line, reinforcing the picture of a market that has already broken down ahead of the seasonal window.
The chart below situates the latest move in its recent multi-month context and overlays the 60-day seasonal projection.
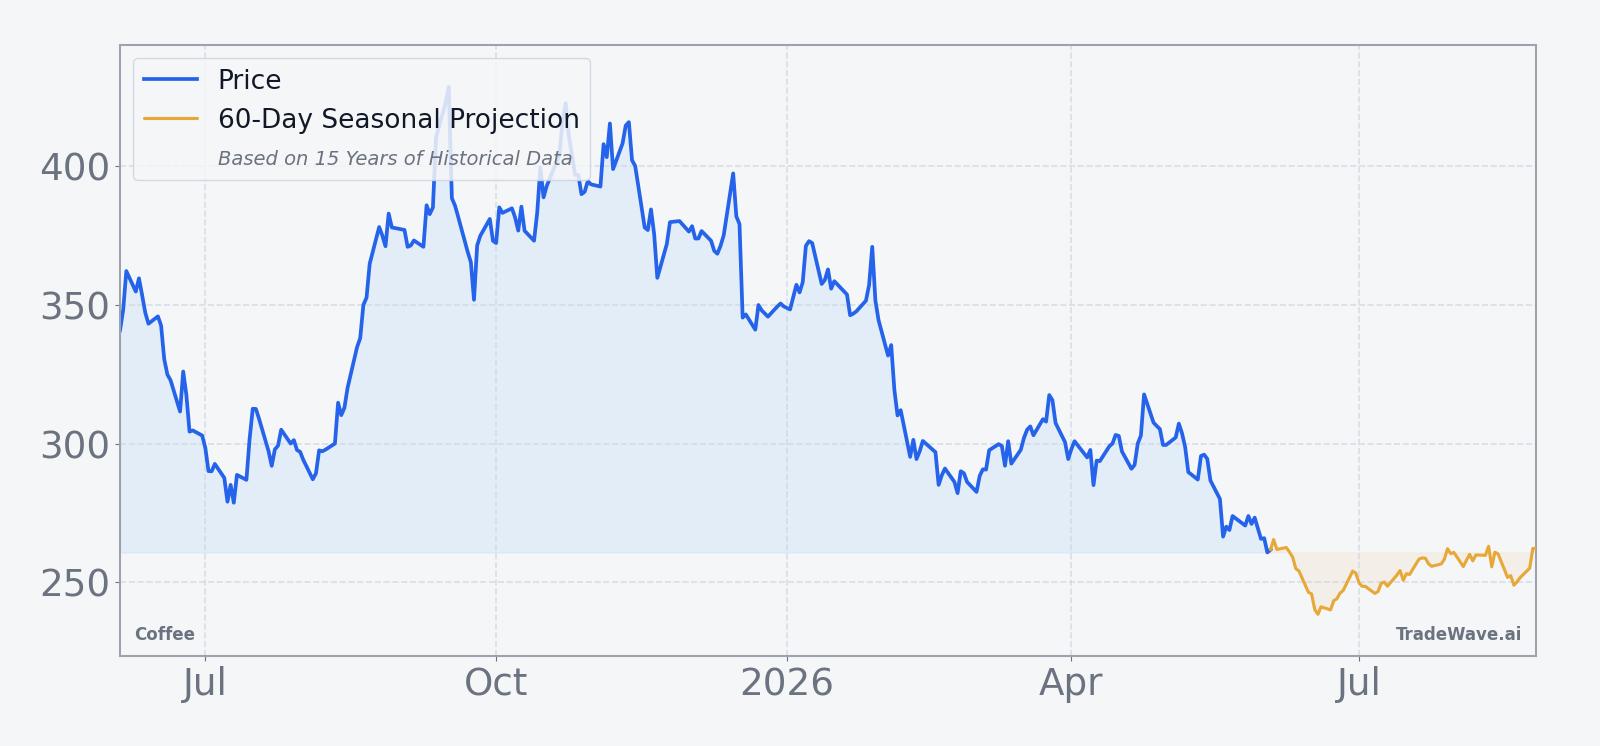
Macro drivers around Coffee remain centered on trade policy and tariff risk rather than fresh headlines. In Aug 2025, Reuters reported that a 50% levy on beans imported from Brazil was expected to raise Arabica and Robusta prices and increase volatility, a reminder that policy shocks can quickly reshape the cost curve for roasters and the risk profile for futures traders.[1] While that story is dated, it underlines how sensitive Coffee can be to shifts in trade rules and how quickly supply expectations can flip from comfortable to tight.
On the supply and demand side, the current price slide suggests traders are more focused on near-term availability and perhaps better-than-feared crop prospects than on longer-term tariff overhangs. With positioning, inventory and term-structure data limited in the latest snapshot, the tape itself is the clearest signal: Coffee has broken down through support, is hugging 52-week lows and is doing so just as a historically bearish seasonal window for shorts opens. For roasters, that combination can offer a chance to layer in hedges at lower prices, while for speculative accounts it raises the stakes on whether this year will follow the 14-for-15 pattern or resemble the rare losing year.
What should traders watch in this Coffee (KC) window?
First, watch whether Coffee can hold the 252 area that currently marks both the 52-week low and the lower end of the recent intraday range. A clean break and sustained trade below that level during the next two weeks would be consistent with the historical early-June pattern of further downside for the short trade. A sharp bounce back toward the 50-day moving average near 291, especially on lighter volume, would look more like the kind of adverse excursion that has occasionally challenged shorts inside this window.
Second, keep an eye on macro headlines around trade policy and any renewed discussion of tariffs on Brazilian beans, which have previously been flagged as catalysts for price spikes and volatility.[1] Even older policy moves show how quickly the Coffee curve can reprice when levies change, so any fresh talk on that front during the window could either reinforce the downside trend or trigger a squeeze against crowded shorts.
Third, monitor daily volume and open interest for signs that speculative money is leaning heavily into the seasonal pattern. If volumes stay elevated while prices grind lower, it would suggest the historical short bias is attracting capital. If instead volumes fade and price action stabilizes or reverses, that would hint that this year’s window may diverge from the 14-for-15 track record.
Finally, traders should track how Coffee behaves around any weather or crop updates that hit during the window. Historically, this period has seen meaningful intraperiod swings even in winning years, so a sudden shift in frost risk, rainfall or harvest expectations could produce the kind of sharp intraday rallies that show up as large adverse excursions in the seasonal stats. How Coffee trades through those shocks will tell investors whether 2026 is lining up as another textbook early-June slide or a rare exception to the pattern.
Sources
- [1] Reuters, "Keurig Dr Pepper to buy Dutch coffee company JDE Peet's for over $18 billion", Aug 24, 2025.
About this seasonal analysis
Seasonal pattern data is sourced from TradeWave.ai, which analyzes historical price behavior across annual calendar windows going back up to 30 years. Read the full data methodology or the book The 100-Year Pattern by Afshin Moshrefi (2026 edition). Past performance of seasonal patterns does not guarantee future results. This article is for informational purposes only and does not constitute investment advice.