Lean Hogs (HE) Trades Near Range Highs as a Historically Weak 60-Day Summer Window Nears
Lean Hogs futures are trading near the upper end of their recent range just as a historically bearish 60-day summer seasonal window comes into view for the contract.
What is the seasonal pattern for Lean Hogs (HE)?
Lean Hogs has fallen in 14 of 15 years during this mid-June to mid-August window, with an average 18.8% gain in winning short years.
- 14-for-15 record for short positions in this window, with 93% profitable years over the past 15 cycles.
- The upcoming 60-day Lean Hogs trading window starts on Jun 17 and has historically favored downside moves in prices.
- Percent Profitable stands at 93%, with 14 winners and just 1 loser for the short-side seasonal pattern.
- Average profit in winning years is 18.8%, while Avg Profit - All, including the lone losing year, is still a strong 17%.
- The pattern’s TradeWave Ratio of 2.46 and Sharpe ratio of 1.6 point to sizable directional moves with solid risk-adjusted returns.
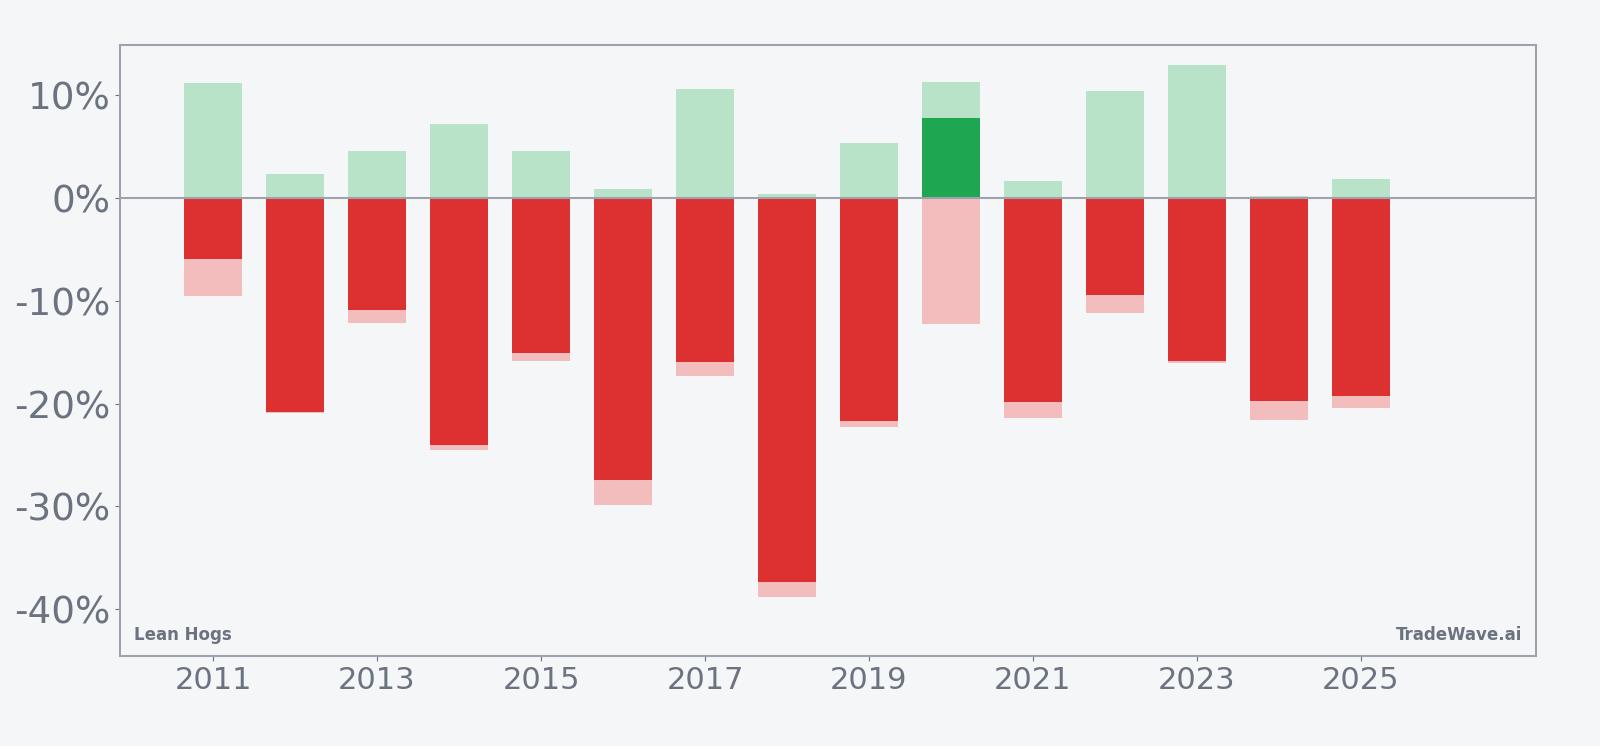
- Past years show that even successful shorts can see double-digit adverse swings inside the window before resolving lower.
According to historical data from TradeWave.ai, this mid-June Lean Hogs window has behaved very differently from an average summer stretch, with a clear directional bias that many futures traders overlook.
How has Lean Hogs (HE) traded in the upcoming summer seasonal window?
Lean Hogs has delivered profitable short-side trades in 14 of the past 15 years during the 60-day window that begins on Jun 17, with winning years averaging 18.8% moves in favor of the shorts. The contract settled at 98.75 in the latest session, leaving it below the 52-week high of 113.7 but still well above the 52-week low of 77.35, so the seasonal window is approaching with prices closer to the top half of the yearly range.
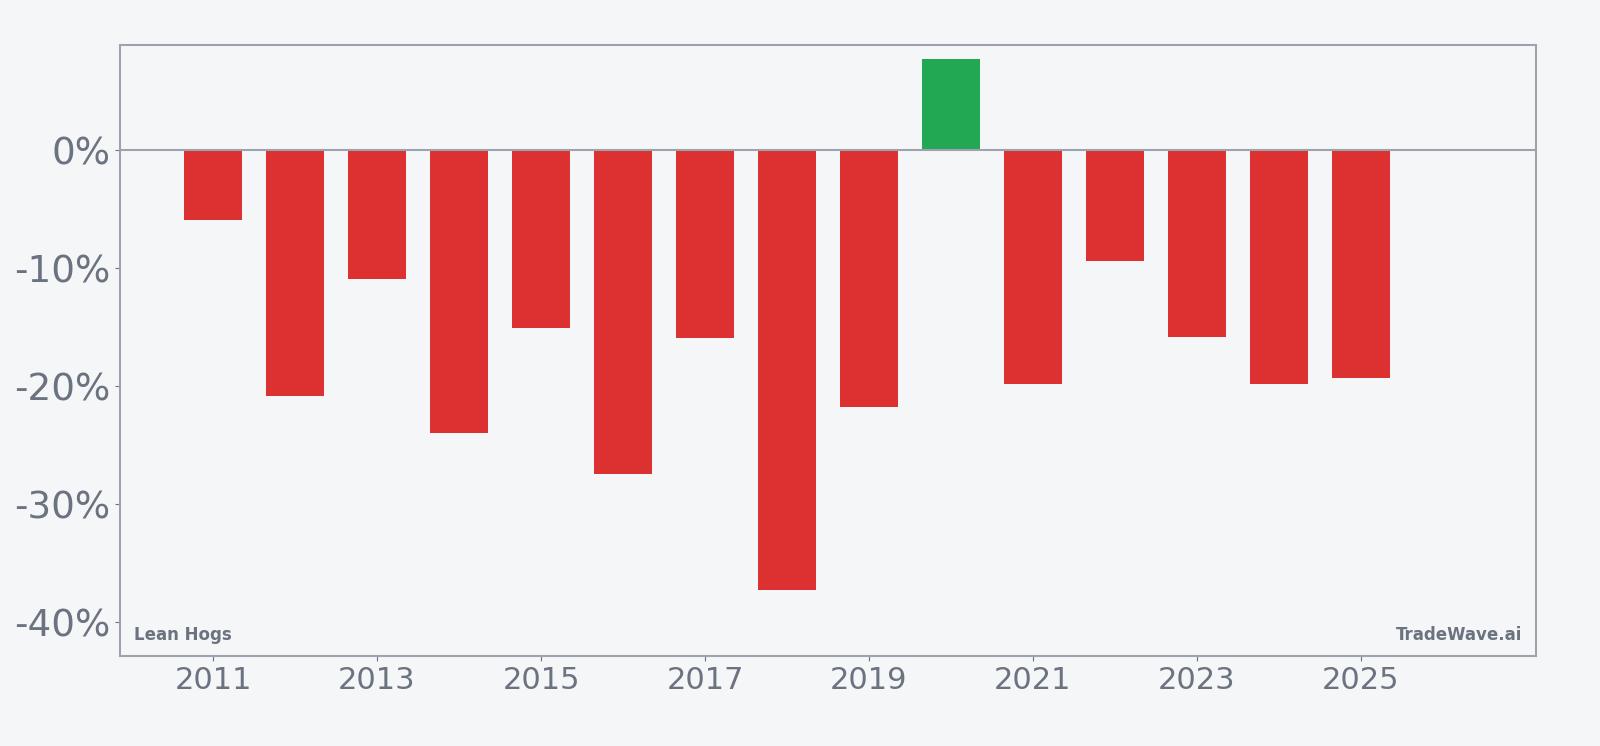
Year-by-year net returns and intraperiod swings show how consistently this window has rewarded short exposure while still delivering sizable rallies along the way.
The trade direction for this pattern is explicitly short, and the track record is unusually one-sided for a commodity contract. Percent Profitable sits at 93%, with 14 winning short years against just one losing year, and the all-years average outcome is a 17% gain for shorts over the 60-day stretch. Average profit in the winning years is 18.8%, which lines up with the median profit of 19.3%, suggesting that the typical successful summer decline in Lean Hogs has been both large and relatively consistent in size.
The volatility profile inside the window is just as important as the final outcomes. The TradeWave Ratio of 2.46 indicates that prices have tended to travel meaningfully in the trade direction during the window, while the Sharpe ratio of 1.6 points to strong risk-adjusted returns based on end-of-window results. Looking at individual years, the strongest short-side outcome came in 2018, when the contract fell 37.31% from an entry near 83.72 to an exit around 52.48, with the worst intraperiod drawdown from entry reaching 38.78% before the move was done. The weakest year for the pattern was 2020, which posted a 7.79% loss for shorts as prices rose from 49.65 to 53.52, even though the contract still swung more than 12% against the trade at one point during the window.
The historical seasonal trend chart shows that, on average, Lean Hogs prices tend to roll over early in the window and grind lower through much of the 60-day span, with only modest relief rallies. The cumulative return profile across the 15-year sample builds steadily in favor of shorts, reflecting the fact that losing years have been rare and that big down moves like 2016, 2018 and 2024 have added up to a 900% cumulative return for the pattern. Add it up and the message is clear: this specific mid-June to mid-August slice of the calendar has been one of the most reliable bearish stretches for Lean Hogs in the modern data set.
History does not guarantee future results; adverse excursions (MAE) can be large even in winning windows.
Why does Lean Hogs (HE) follow this seasonal pattern?
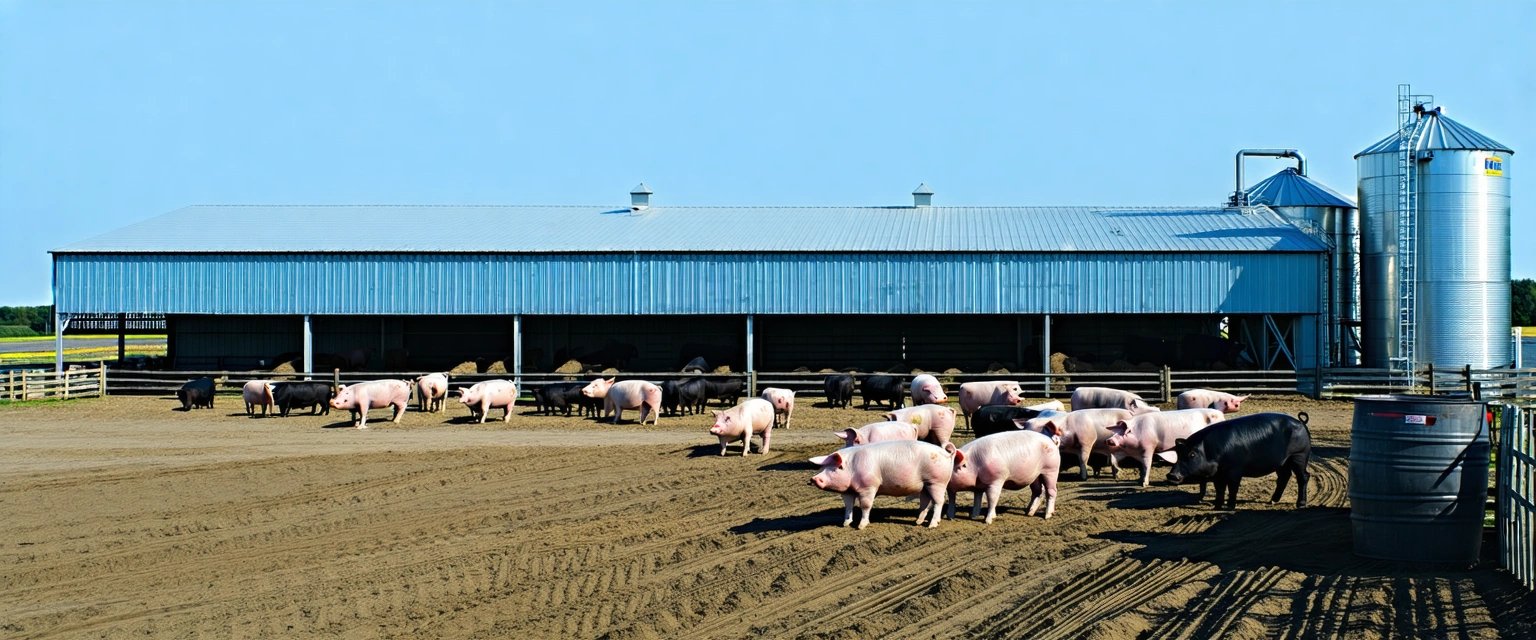
This Lean Hogs seasonal pattern likely reflects commodity supply and demand seasonality rather than pure chart behavior. Analysts often point to summer hog market dynamics, including heavier slaughter runs, shifting feed costs and grilling-season demand that peaks earlier in the year, as drivers of softer prices into late summer. The repeated success of short positions in this window may capture that tendency for supply to outpace demand just as the market transitions out of the strongest consumption months.
What is driving Lean Hogs (HE) today?
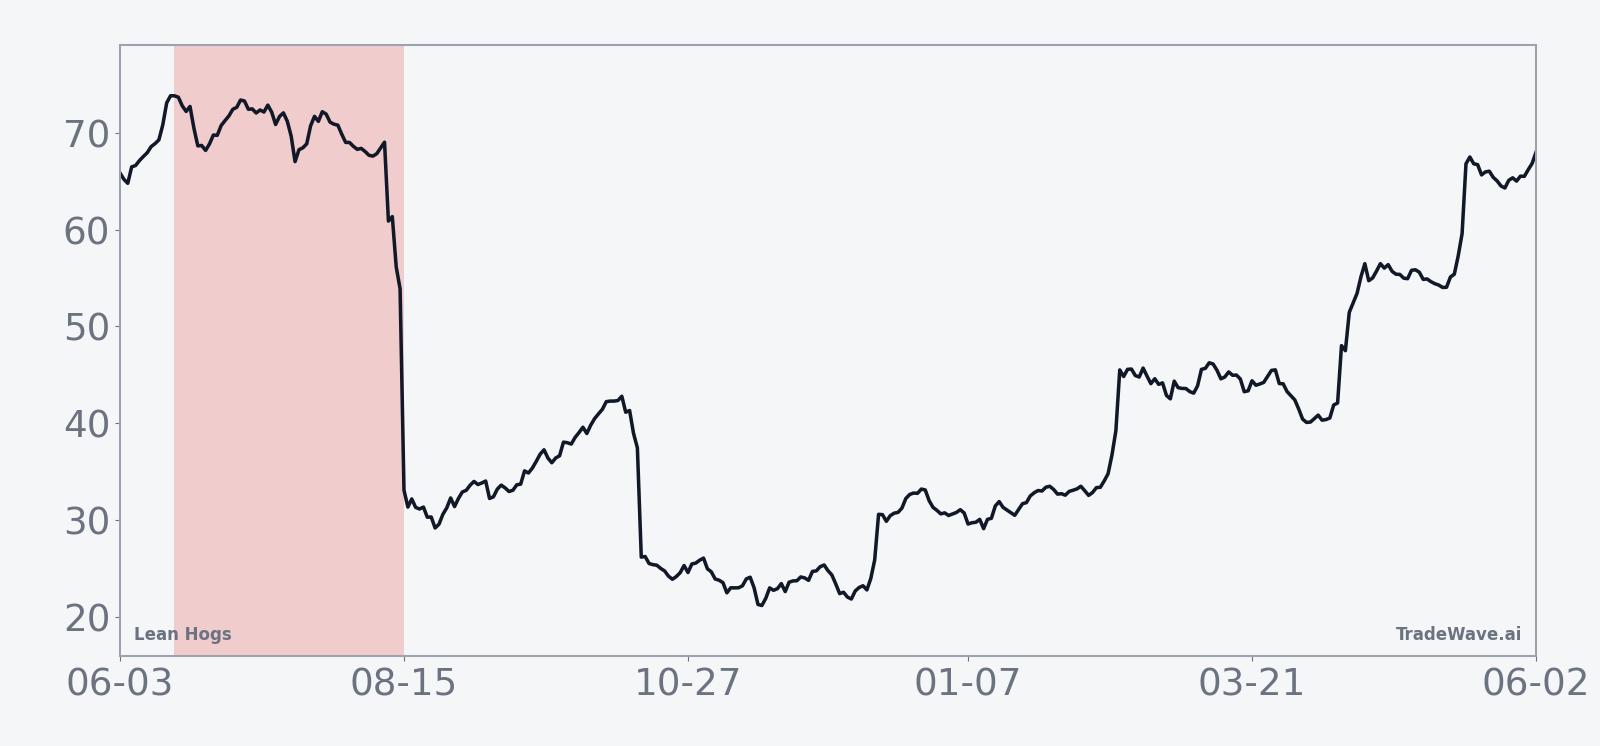
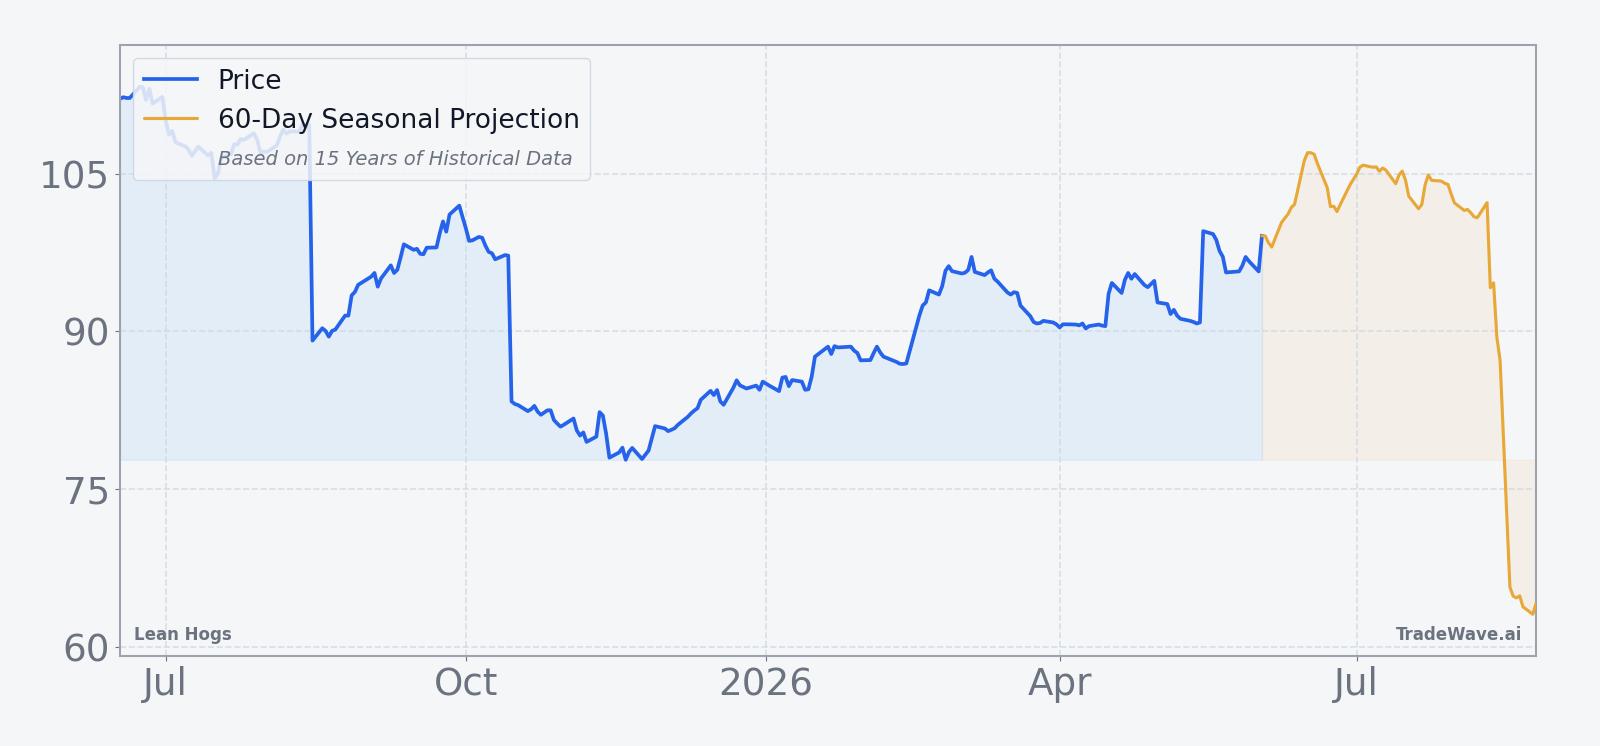
Front-month Lean Hogs futures last settled at 98.75, leaving the contract below its 52-week high of 113.7 and comfortably above the 52-week low of 77.35, with a one-month gain of 7.78% that has pulled prices back above the 50-day moving average around 93.16. That puts the market in a firmer short-term uptrend heading into mid-June, even as the historical seasonality points to a tendency for prices to weaken once the upcoming window opens.
The chart below situates the latest move in its recent multi-month context alongside the 60-day seasonal projection.
How could supply and demand shape this Lean Hogs seasonal window?
Lean Hogs sits at the intersection of livestock supply cycles and consumer demand patterns, and both sides of that equation tend to shift as summer progresses. On the supply side, producers often bring more animals to market in late June and July, when earlier farrowing decisions translate into heavier slaughter numbers. On the demand side, the strongest grilling-season buying for pork typically clusters around late spring and early summer holidays, which can leave wholesale and retail demand comparatively softer as the calendar moves deeper into August.
In that context, the historical pattern of lower Lean Hogs prices during this 60-day window fits a story of supply catching up to, and sometimes overtaking, demand. When more hogs hit the pipeline just as consumer enthusiasm cools, packer margins can compress and futures prices have often adjusted lower to clear the market. The seasonal window does not move in a straight line every year, but the repeated tendency for prices to finish the period below their mid-June levels suggests that these fundamental forces have mattered more often than not.
Logistics and weather can amplify or blunt the pattern in any given year. Hotter-than-normal conditions can stress animals and affect weight gains, while transportation bottlenecks or plant disruptions can temporarily tighten or loosen supply at key hubs. Those factors help explain why some years, such as 2016 and 2018, saw very deep declines with large adverse excursions, while others delivered more modest moves even though the direction still favored shorts.
How are traders typically positioned around this Lean Hogs window?
Positioning data for Lean Hogs is often dominated by commercial hedgers on one side and speculators on the other, with managed money flows tending to chase momentum rather than lead it. In years when prices have already rallied into mid-June, producers have historically had an incentive to add hedges, which can increase selling pressure just as the seasonal window opens. Conversely, when the market has been weak heading into the window, some of that hedging may already be in place, leaving less incremental supply to hit the tape.
The pattern’s strong short-side track record suggests that traders who have leaned into the historical seasonality have often been rewarded, but the intraperiod swings show that timing and risk management still matter. In several years, including 2017 and 2023, Lean Hogs saw double-digit rallies at some point during the window before ultimately finishing lower, which would have pressured shorts that were too early or too highly leveraged. The combination of a high Percent Profitable figure and sizable maximum adverse excursions is a reminder that this is a volatile contract, not a slow-moving index future.
What should traders watch as Lean Hogs (HE) enters this seasonal window?
As Jun 17 approaches, the key test for this Lean Hogs seasonal pattern will be whether the recent rebound stalls near the upper half of the 52-week range or extends toward the prior high around 113.7. A failure to break meaningfully higher before or early in the window would be consistent with past years in which prices rolled over and trended lower into August. By contrast, a decisive breakout above the 52-week high that holds through the bulk of the 60-day stretch would mark a clear departure from the historical script.
Fundamentally, traders should track weekly slaughter and carcass weight data, wholesale pork prices and any signs of demand fatigue at the retail level. If heavier supplies and softer cutout values start to show up just as the seasonal window opens, that would align with the historical pattern of pressure on Lean Hogs futures. Weather and logistics will also matter: extreme heat, plant outages or transportation snarls could tighten or loosen supply in ways that either reinforce or offset the usual summer tendency.
On the technical side, the 50-day moving average near 93.16 and the 52-week low around 77.35 are natural downside reference points if the contract starts to follow its typical seasonal path. How price behaves around those levels during the window will offer a real-time check on whether the 14-for-15 short-side record is holding up or breaking down. For traders who watch seasonality closely, the next 60 days in Lean Hogs will be less about predicting an exact move and more about seeing whether a long-running summer pattern in this futures market still has teeth.
Sources
About this seasonal analysis
Seasonal pattern data is sourced from TradeWave.ai, which analyzes historical price behavior across annual calendar windows going back up to 30 years. Read the full data methodology or the book The 100-Year Pattern by Afshin Moshrefi (2026 edition). Past performance of seasonal patterns does not guarantee future results. This article is for informational purposes only and does not constitute investment advice.