Corn (CME) (ZC) Has Dropped in All 10 of These Mid-June-August Windows for Shorts
Corn (CME) is trading just under recent highs as it approaches a 58-day summer seasonal window that has delivered consistent downside for prices even in volatile crop years.

What is the seasonal pattern for Corn (CME) (ZC)?
Corn (CME) has fallen in 10 of 10 years during this mid-June to early-August window, with an average gain of 13.12% in winning short trades.
- 10 for 10 in this window, with short positions averaging 13.12% gains across the past decade.
- The 58-day seasonal window begins Jun 13 and has historically favored downside in Corn (CME) prices.
- Percent Profitable is 100%, with 10 winners and 0 losers for the short trade setup.
- Median profit on winning shorts is 14.96%, pointing to frequent double-digit moves within the window.
- The TradeWave Ratio of 2.21 signals that price typically travels meaningfully in the trade direction during this stretch.
- A Sharpe ratio of 1.5 on end-of-window outcomes shows a strong risk-adjusted profile for this specific seasonal short.
According to historical data from TradeWave.ai, this upcoming mid-June window in Corn (CME) has behaved very differently from an average summer on the grain desk. TradeWave.ai's seasonal database flags it as one of the most consistently bearish stretches for ZC over the past decade.
How has Corn (CME) (ZC) traded in this mid-June to early-August window?
Corn (CME) has delivered winning short trades in all 10 of the past years during the 58-day window that starts on Jun 13, with average profits of 13.12% for those shorts. The front-month contract settled Monday at 447.75 cents per bushel, up 0.2% on the day and about 7.1% below its 52-week high of 481.75, leaving room for either a retest of the top of the range or a slide back toward last year’s lows as the seasonal window opens.
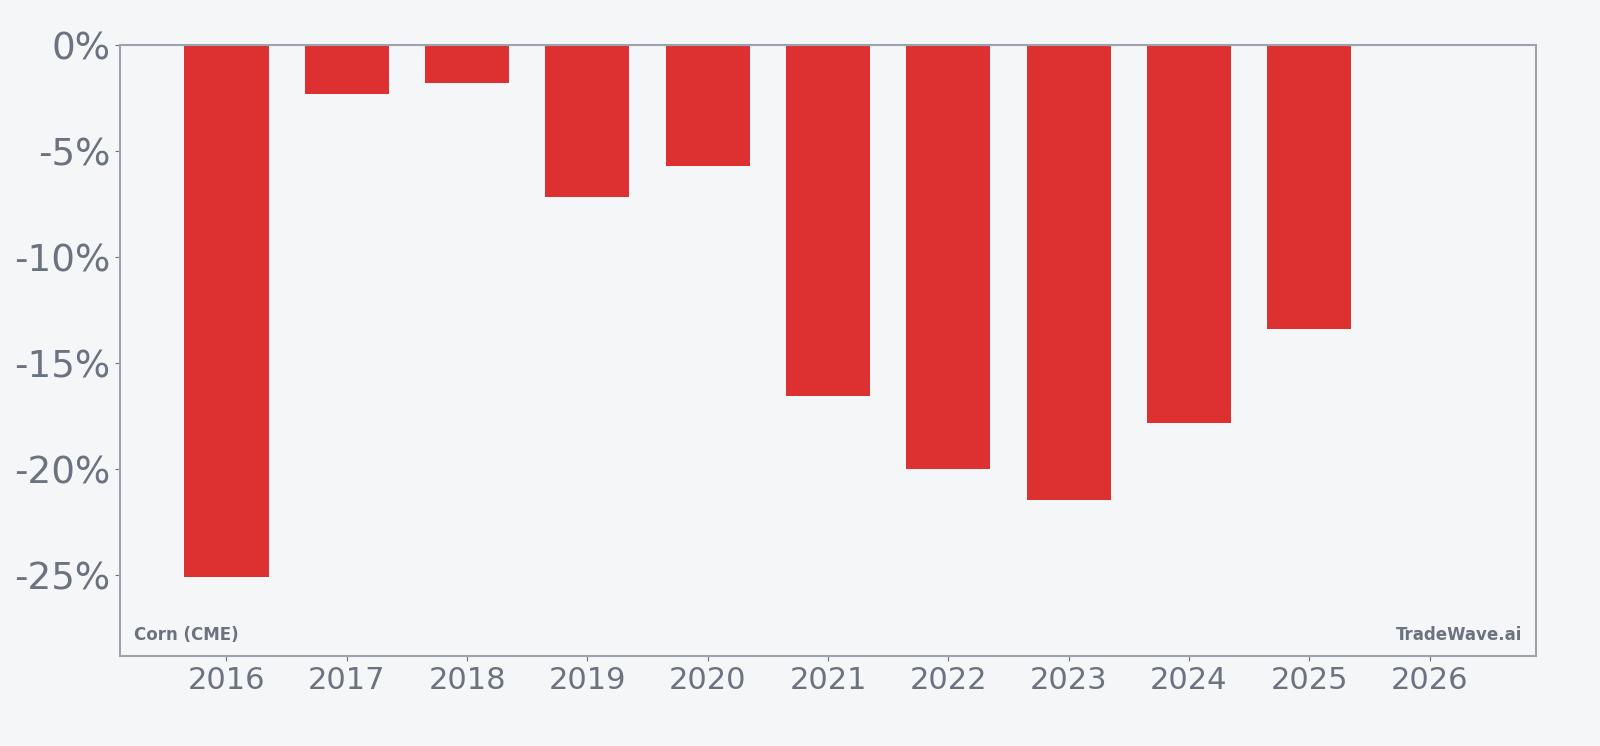
Year-by-year net returns and intraperiod swings show how consistently this window has rewarded shorts while still delivering sizable rallies and drawdowns along the way.
Trade direction for this pattern is explicitly short, and the record is clean: 10 winners, 0 losers, with a cumulative return of 234% across the decade for the strategy of shorting at the window open and covering at the close. Average winner gains of 13.12% and a median of 14.96% show that the typical year has not been a marginal drift lower but a meaningful slide in prices. The strongest year in the sample was 2016, when a short entered around 430 cents and exited near 322.25, a 25.06% gain as corn broke hard during the heart of the U.S. growing season. At the other end of the spectrum, 2018 still produced a profitable short, but the net move was just 1.8% as prices chopped and then eased into the window close.
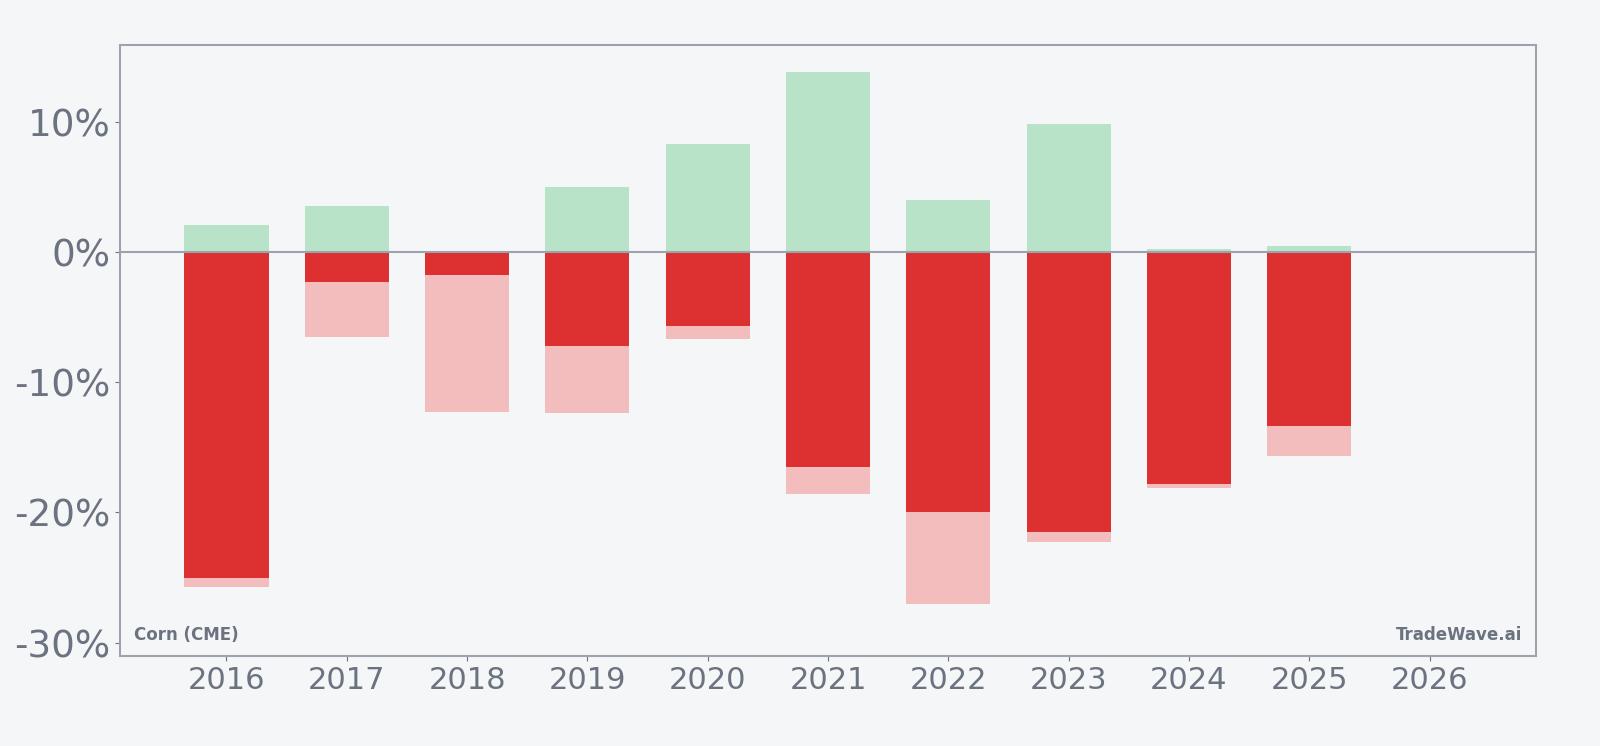
The maximum favorable move and maximum adverse move profile underlines how volatile this summer stretch can be even when the final result has favored shorts. In 2021, for example, the short trade ultimately gained 16.53%, but the contract first rallied as much as 13.84% from the entry before rolling over, while the worst drawdown from entry reached 18.58%. Across the sample, many years show peak favorable excursions in the mid to high single digits and adverse swings that can exceed 20%, which means intraperiod risk management has mattered as much as the direction of the seasonal bias.
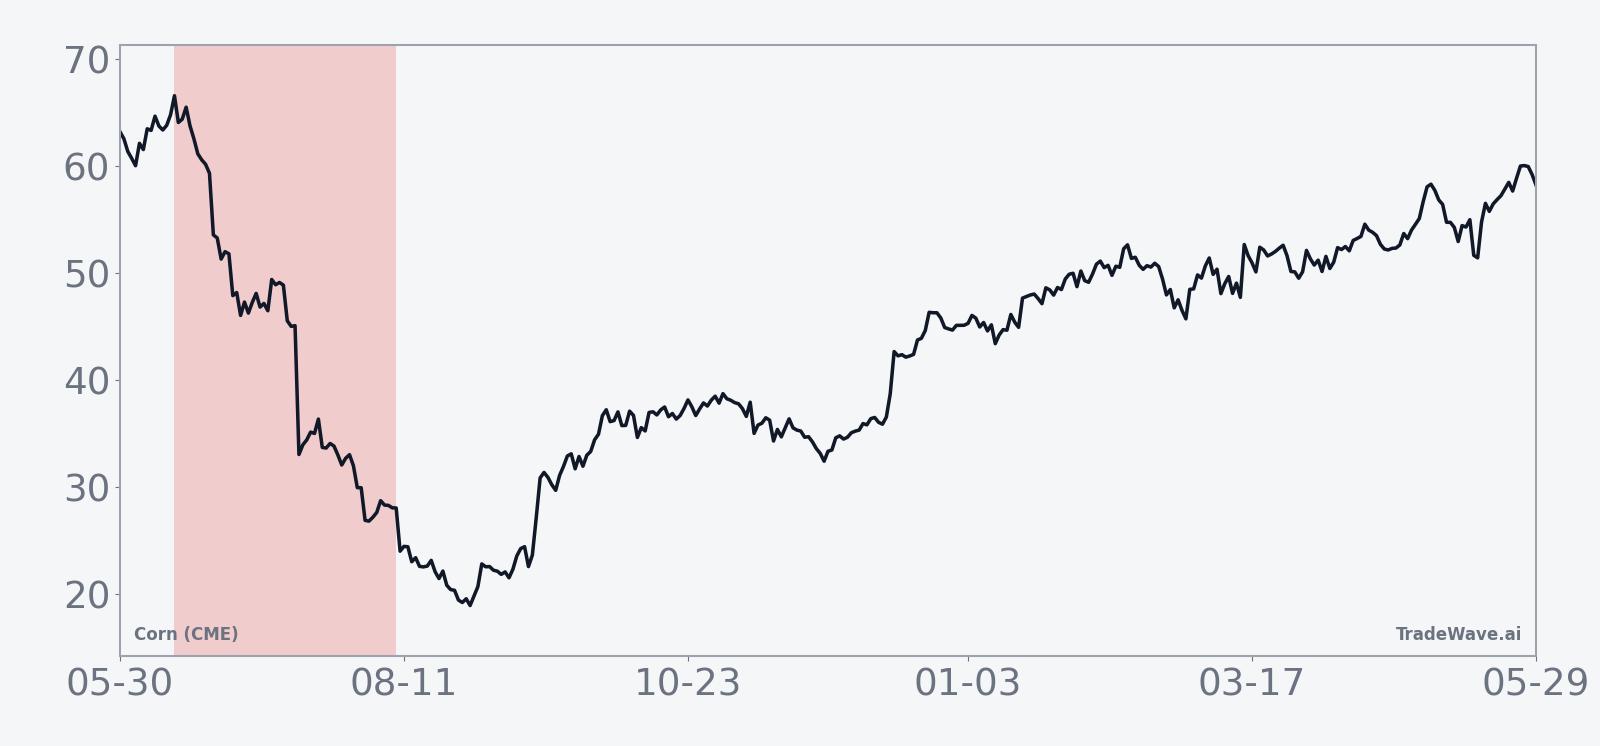
The ten-year average seasonal trend chart shows a pattern of early resilience followed by a more decisive break. On average, corn prices tend to hold or even firm slightly in the first part of the window before weakness accelerates into the back half, consistent with weather and crop-condition headlines that often shift from planting to yield risk and then to supply comfort. The cumulative return curve for the pattern climbs steadily for the short strategy, with no multi-year flat spots, which is unusual for a commodity that often trades in boom-and-bust cycles.
Put together, the message from the seasonal window is blunt: over the past decade, mid-June through early August has been a reliable period for lower corn prices, with shorts winning every time but facing sizable intraday and intraweek swings along the way.
Why does Corn (CME) (ZC) follow this seasonal pattern?
This pattern may reflect classic commodity supply and demand seasonality around the U.S. growing season. By mid-June, planting is largely complete and weather visibility improves, so worst-case yield fears often ease while USDA reports and early crop-condition data start to confirm ample supply. Analysts have also pointed to large farmer selling and hedging flows into summer, as producers lock in prices ahead of harvest, which can add incremental pressure to futures during this specific window.
History does not guarantee future results, and even in this strongly bearish seasonal window, adverse moves against the short side have at times been large before prices ultimately rolled over.
What is driving Corn (CME) (ZC) today?
Corn futures are trading at 447.75 cents, up 1 cent on the session, with the front-month contract sitting between its 52-week low of 368.75 and high of 481.75 as traders weigh heavy U.S. stocks against weather risk. Volume on Monday’s move, at 12,801 contracts, is well below the 20-day average of 130,601.95, suggesting positioning is still relatively light ahead of the key summer reports and the upcoming seasonal window.
On Jan 12, the U.S. Department of Agriculture raised its projection for U.S. corn ending stocks to 2.23 billion bushels in its January World Agricultural Supply and Demand Estimates, about 200 million bushels above the prior month, a shift that has kept a lid on rallies through the first half of the year.[1] In February, a Reuters survey of analysts projected 2026 U.S. corn plantings at about 94.9 million acres, indicating farmers planned to keep acreage large despite narrow margins, reinforcing the idea of ample supply if weather cooperates.[2] USDA inventory data for Dec 1 also showed larger corn stocks, consistent with the higher ending-stocks estimate and a market that has struggled to sustain bullish momentum.[1]
Those macro supply signals help explain why corn has lagged some other commodities even as agriculture-focused funds have seen a mean-reversion rally within the broader commodity complex.[2] Strategists tracking agriculture ETFs have noted that grains have been part of a catch-up move rather than a leadership trade, which fits with a futures curve and fundamental backdrop that still point to comfortable U.S. availability rather than scarcity.[2]
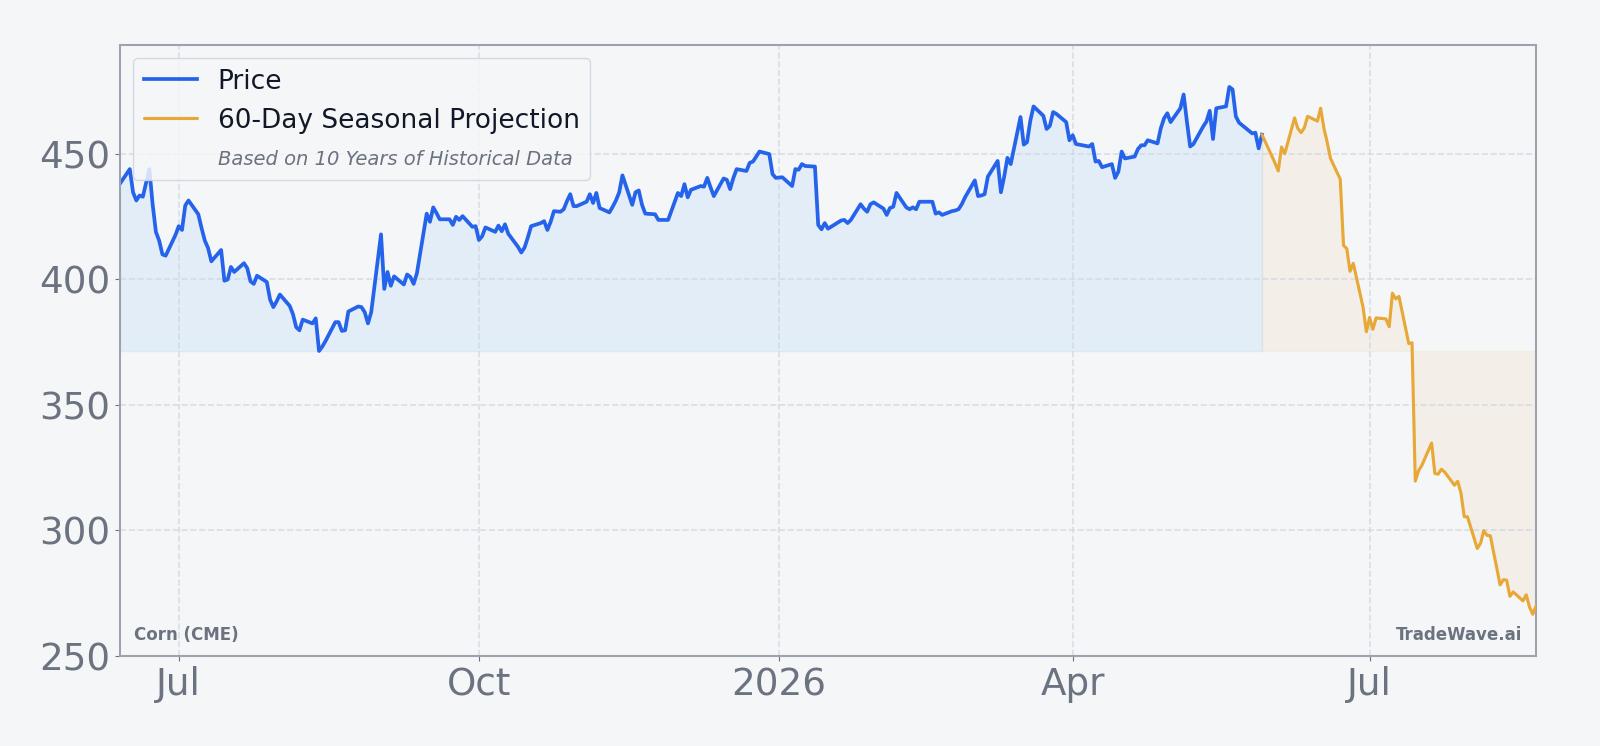
The chart below situates the latest move in its recent multi-month context and overlays the upcoming seasonal projection.
How do supply, demand, and logistics shape this seasonal window for Corn (CME) (ZC)?
The mid-June to early-August stretch lines up with a critical phase in the U.S. corn supply and demand calendar. By this point, planting intentions have largely turned into planted acres, and the market has a clearer read on how much corn is actually in the ground. The Reuters poll pointing to 94.9 million acres for 2026 underscores that farmers have been willing to keep corn area high even when margins are tight, which can amplify downside pressure if weather does not significantly threaten yields.[2]
On the demand side, the higher ending-stocks estimate of 2.23 billion bushels signals that recent consumption has not been strong enough to absorb prior bumper crops, leaving a cushion that can absorb moderate weather scares.[1] Ethanol demand, feed usage, and export flows all matter at the margin, but with stocks elevated, the burden of proof tends to fall on bulls to show that demand is accelerating fast enough to tighten the balance sheet. In many of the past 10 years, that proof has not arrived during this window, and prices have drifted or broken lower as the market priced in comfortable carryout.
Logistics and inventory trends also play a role. USDA’s report of larger Dec 1 corn stocks, which fed into the higher ending-stocks figure, implies that grain has been sitting in bins longer, giving commercial hedgers and farmers more flexibility to sell into summer rallies.[1] When weather headlines spark short-covering spikes, that stored supply can quickly meet the bid, capping rallies and reinforcing the historical pattern of intraperiod upside spikes that ultimately fade into lower closes by early August.
What should traders watch as Corn (CME) (ZC) enters this seasonal window?
For this year’s iteration of the pattern, the first watchpoint is the calendar itself: the 58-day window opens on Jun 13 and runs through early August, overlapping key USDA reports and the heart of U.S. pollination. Traders will be watching whether any early-season weather scares can push ZC back toward the 481.75 high or whether rallies stall below that level, which would be more consistent with the historical seasonal trend.
Second, the supply narrative bears close monitoring. Any revisions to the 2.23 billion bushel ending-stocks estimate, fresh quarterly stocks data, or updates to the 94.9 million acre planting outlook could either reinforce or challenge the bearish seasonal bias.[1][2] A surprise cut to acreage or a sharp downgrade to yield expectations would test the durability of the pattern, while confirmation of big acres and comfortable stocks would align with the decade-long record of lower prices in this window.
Third, watch how intraperiod volatility behaves relative to history. Past years have seen maximum favorable moves for shorts in the high single to mid-20% range and maximum adverse moves that can also reach double digits, so the path has rarely been smooth. If this summer brings sharp rallies that fail quickly and roll into lower lows, it would echo the 2016 and 2021 playbook. If instead corn grinds sideways with shallow swings, that would mark a clear departure from the typical ZC seasonal trend.
Finally, keep an eye on cross-asset flows into agriculture and commodity funds. Sector commentary earlier this year framed grains as part of a mean-reversion rally within commodities rather than a structural bull story, which leaves room for capital to rotate away again if macro inflation worries cool or if energy and metals reclaim leadership.[2] Add it up: a contract sitting below its 52-week high, a decade-long record of profitable shorts in this specific summer window, and a supply backdrop that still looks heavy. How corn behaves between mid-June and early August will show whether that historical pattern still has teeth.
Sources
About this seasonal analysis
Seasonal pattern data is sourced from TradeWave.ai, which analyzes historical price behavior across annual calendar windows going back up to 30 years. Read the full data methodology or the book The 100-Year Pattern by Afshin Moshrefi (2026 edition). Past performance of seasonal patterns does not guarantee future results. This article is for informational purposes only and does not constitute investment advice.