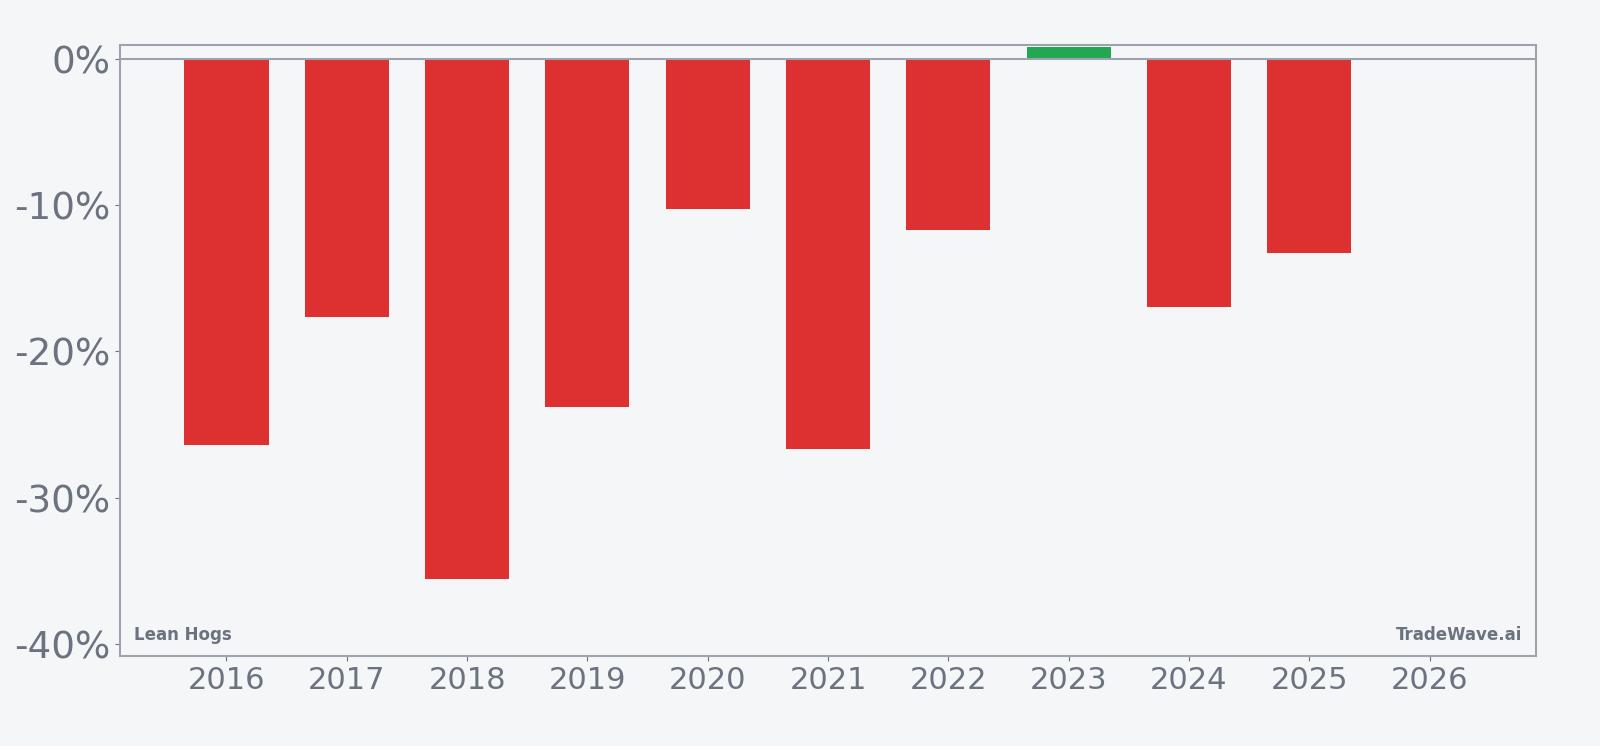
Lean Hogs (LH) Has Averaged 20.25% Declines in Winning Short Years During This 59-Day Window
Lean Hogs is moving through a 59-day early-summer stretch that has delivered steady downside in most of the past decade, shaping the risk backdrop for hog traders and protein markets.
What is the seasonal pattern for Lean Hogs (LH)?
Lean Hogs has fallen in 9 of 10 years during this early-summer 59-day window, with an average loss of 20.25% in winning short years.
- 9 for 10 in this window for short positions, with average winning-year declines of 20.25% and only one small losing year.
- The current Lean Hogs seasonal window begins on Jun 5 and runs for 59 trading days, covering much of the early-summer demand lull.
- Percent Profitable sits at 90%, with 9 winners and 1 loser for the short trade direction across the past decade.
- Including every year, Avg Profit - All is a still-hefty 18%, showing that the lone losing year did little to dent the overall downside bias.
- Maximum adverse moves have reached more than 20% against the short in some years, so intraperiod drawdowns can be sharp even when the window finishes lower.
- A TradeWave Ratio of 2.23 and a Sharpe ratio of 1.69 point to a historically strong and directional seasonal edge for this Lean Hogs trading window.
According to historical data from TradeWave.ai, this early-summer stretch in Lean Hogs has behaved very differently from an average month on the calendar, with a clear directional tilt that many futures traders overlook.
How has Lean Hogs (LH) traded in this early-summer seasonal window?
Lean Hogs has delivered profitable short trades in 9 of the past 10 years during the 59 trading days starting Jun 5, with average winning-year declines of 20.25%. The current window is underway again, running through early August, and historically has marked one of the softest stretches of the year for the contract. That combination of a strong downside seasonal trend and a live window makes this period a focal point for hog risk managers and speculative traders alike.
Across the full 10-year lookback, the short-side Avg Profit - All of 18% shows that even after including the lone losing year, the typical outcome has been a sizable decline. The median profit of 17.3% is close to the average, which suggests the distribution of outcomes is not dominated by a single outlier year. Annualized, the pattern translates to a 17.73% return profile for the short trade direction, paired with a Sharpe ratio of 1.69 that signals historically strong risk-adjusted performance.
The per-year breakdown shows how consistent that downside bias has been. In 2018, the short trade would have captured a 35.54% decline from entry to exit, the strongest year in the sample, while 2021 delivered a 26.7% drop and 2016, 2019 and 2024 each saw losses of more than 16% for Lean Hogs over the window. The only losing year for the short pattern was 2023, when the contract finished the window up just 0.86% from entry, despite a maximum favorable move of 19.73% at one point during the period.
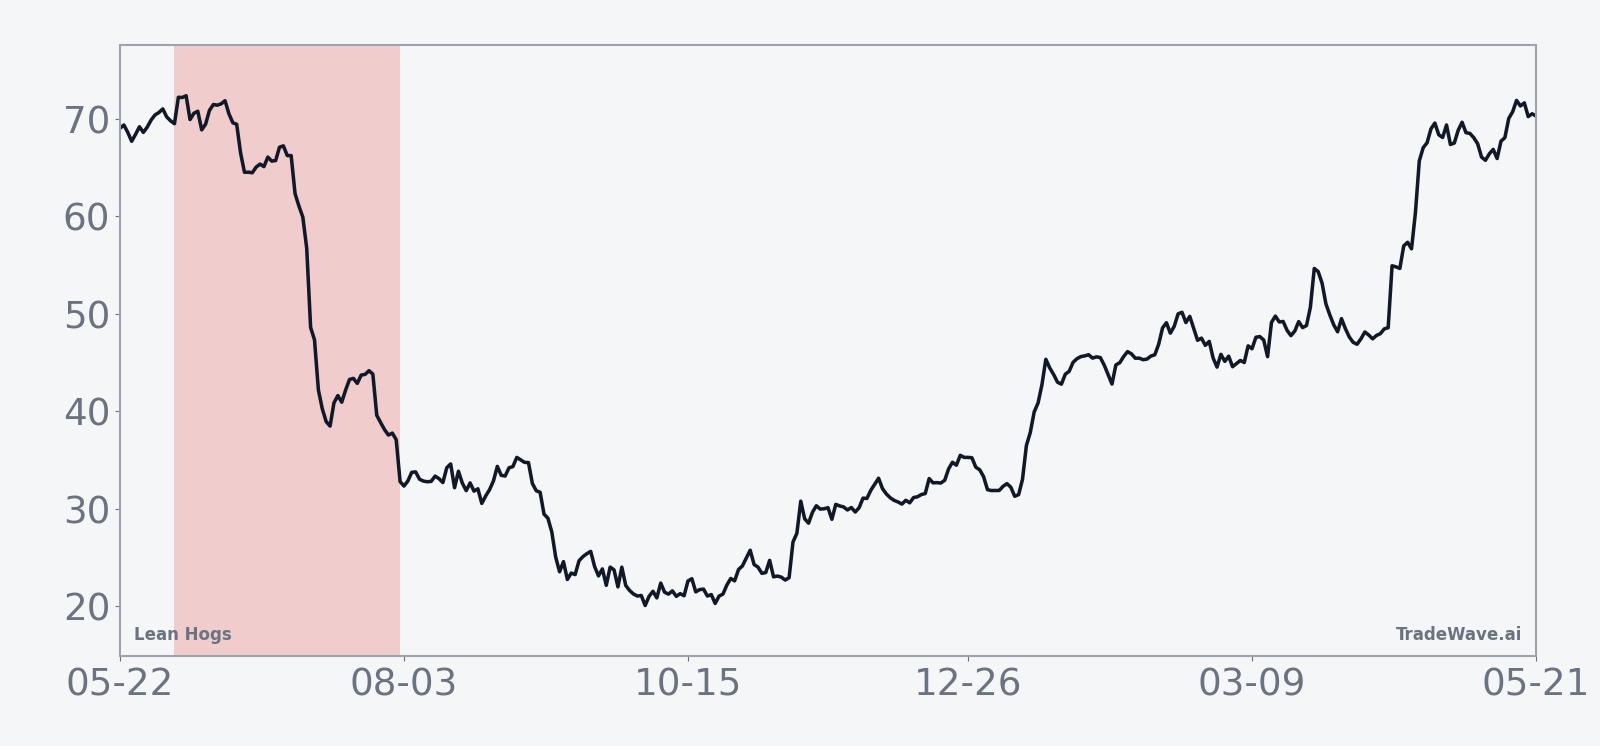
The historical seasonal trend chart shows that most of the downside in Lean Hogs has tended to accrue steadily through the middle of the window rather than in a single air pocket. The average path slopes lower from mid-June into July, with only modest countertrend rallies, which fits a narrative of gradually softening demand and heavier supply hitting the market as summer progresses.
A combined view of net returns and intraperiod swings highlights how far Lean Hogs has typically moved during this window before settling at the final outcome.
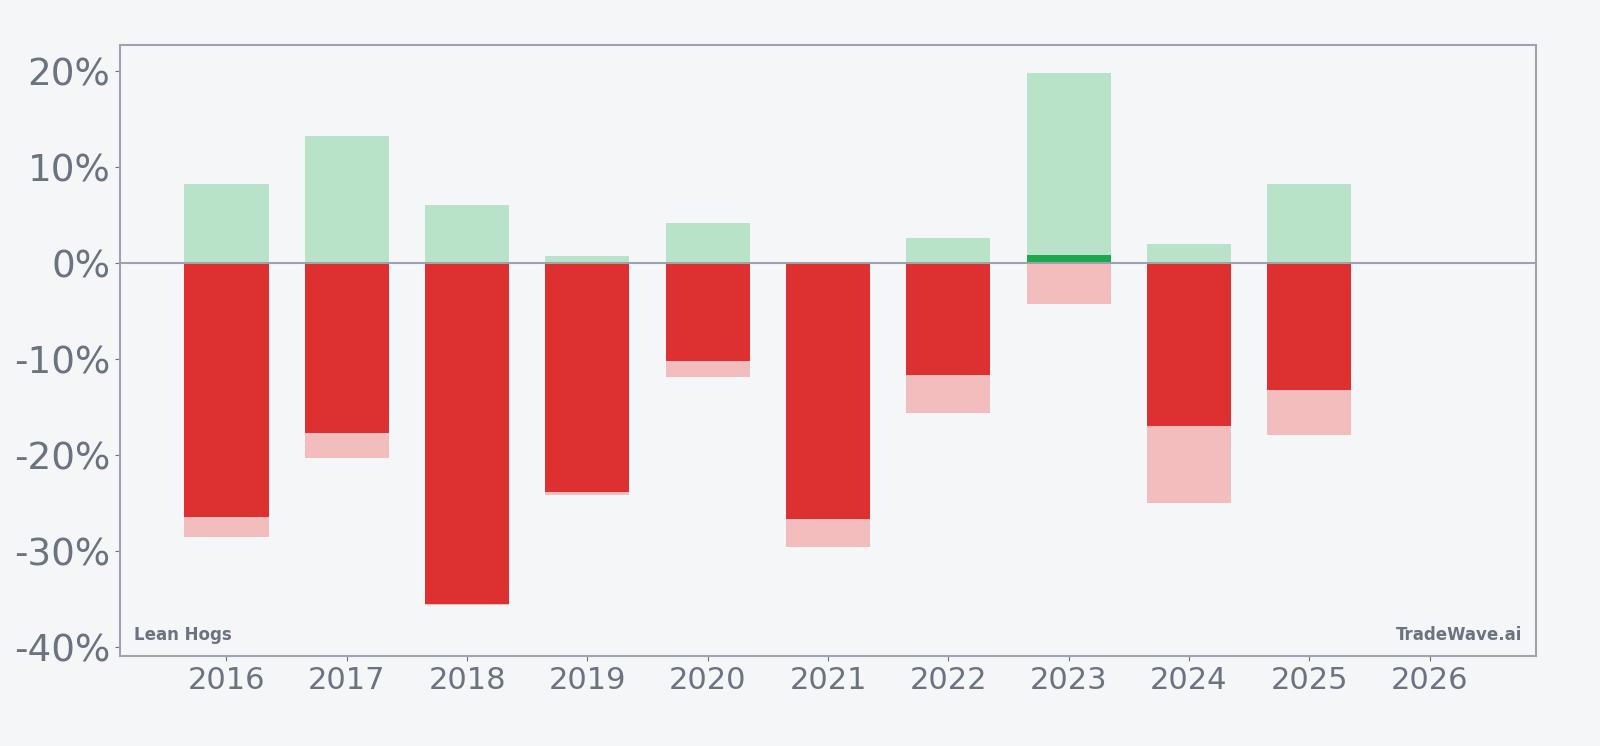
The combined net, maximum favorable excursion and maximum adverse excursion profile shows that in strong years like 2018 and 2021, Lean Hogs not only finished sharply lower but also spent much of the window trading below the eventual exit level. In weaker years such as 2016 and 2024, maximum adverse moves against the short reached roughly 20% to 30% at points, underscoring that even a historically bearish window can feature painful rallies before the trend reasserts itself. Add it up: 9 winning short years out of 10, double-digit average declines and a solid TradeWave Ratio of 2.23 make this one of the more pronounced seasonal patterns in the livestock complex.
History does not guarantee future results; adverse excursions (MAE) can be large even in winning windows.
Why does Lean Hogs (LH) follow this seasonal pattern?
This early-summer Lean Hogs seasonal pattern likely reflects a mix of commodity supply and demand seasonality. On the supply side, heavier marketings and slaughter schedules often bring more hogs to market into mid-summer, while demand can soften after the initial grilling-season ramp, pressuring prices. Analysts also point to hedging flows from producers and packers during this period, which may reinforce the tendency for Lean Hogs to drift lower across June and July.
What is driving Lean Hogs (LH) today?
Front-month Lean Hogs futures settled recently at 102.0, leaving the contract below its 52-week high of 113.375 and above the 52-week low of 77.125, with a one-month gain of 0.72% and 20-day average volume of 14,791 contracts. That places prices roughly in the middle of the past year’s range as the early-summer seasonal window gets going, with the 50-day moving average near 96.97 acting as a reference line for trend followers. With no major fresh macro or sector-specific headlines in the hog complex, traders are watching how price behaves relative to that moving average as the historically weak seasonal stretch unfolds.
The chart below situates the latest move in its recent multi-month context and overlays the 60-day seasonal projection.
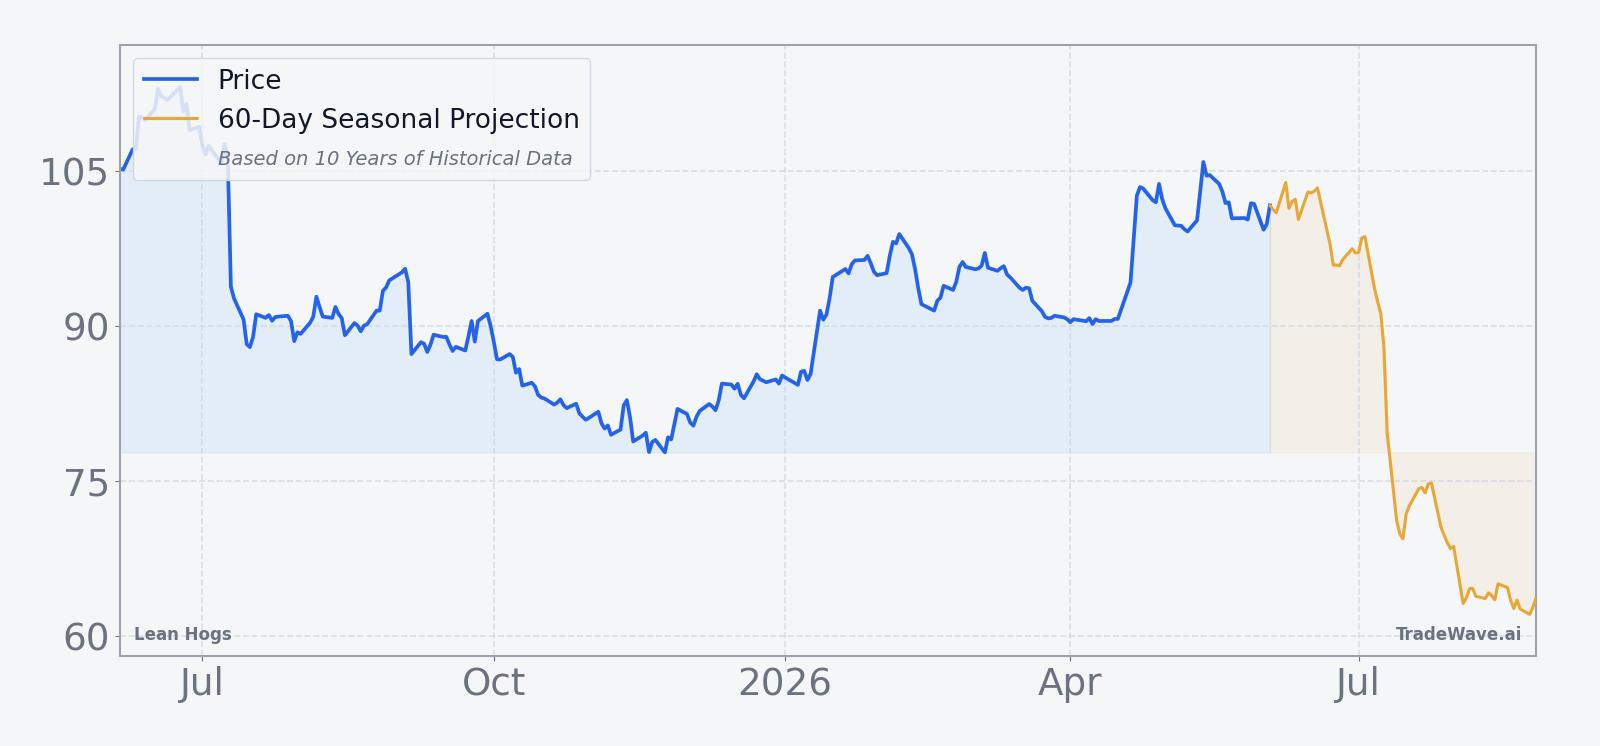
In the near term, the key question for the Lean Hogs seasonal outlook is whether prices respect the pattern’s tendency to weaken from mid-June into July or instead hold firm above the 50-day moving average. A sustained break below that moving average would align with the historical seasonality and could encourage additional hedging from producers, while a push back toward the 52-week high would mark a clear divergence from the typical early-summer path. Either way, the combination of a live seasonal window and a contract trading mid-range on the chart sets up a period where price action can carry more information than usual about how this year’s fundamentals stack up against the past decade.
What should traders watch in this Lean Hogs (LH) seasonal window?
For this 59-day window, the first thing to watch is how Lean Hogs trades around the 50-day moving average near 96.97 and whether rallies toward the 52-week high of 113.375 fade or extend. A pattern of lower highs and lower lows into July would be consistent with the historical seasonality, while a decisive breakout above the recent range would contradict the typical early-summer weakness. Traders should also monitor weekly slaughter and carcass-weight data, along with export demand, for signs that supply is building faster than consumption, which has often coincided with the stronger down years in this window. Finally, intraday volatility and any sharp countertrend spikes will matter: in prior cycles, some of the best short years still featured sizable rallies before rolling over, so how Lean Hogs behaves inside the band of recent highs and the 50-day average will help confirm whether this year is tracking the historical script or writing a new one.
Sources
About this seasonal analysis
Seasonal pattern data is sourced from TradeWave.ai, which analyzes historical price behavior across annual calendar windows going back up to 30 years. Read the full data methodology or the book The 100-Year Pattern by Afshin Moshrefi (2026 edition). Past performance of seasonal patterns does not guarantee future results. This article is for informational purposes only and does not constitute investment advice.