Lean Hogs (LH) Enters 58-Day Window That Has Delivered 462% Cumulative Short Profits
Lean Hogs is approaching a 58-day early-summer stretch that has delivered double-digit declines for short sellers in every one of the past 10 years.
What is the seasonal pattern for Lean Hogs (LH)?
Lean Hogs has fallen in 10 of 10 years during this early-summer 58-day window, with an average gain of 19.22% for short positions in winning years.
- 10 for 10 in this window, with short trades averaging 19.22% gains across winning years over the past decade.
- Seasonal window runs from Jun 6 and spans 58 trading days, covering the heart of the early-summer hog market.
- Percent Profitable is 100%, with 10 winners and 0 losers for the short-side pattern in this Lean Hogs trading window.
- Annualized return across the sample is 18.86%, with a cumulative 462% gain for the short strategy over 10 years.
- TradeWave Ratio (TWR) of 2.47 signals that price has typically traveled meaningfully in the trade direction within the window.
- Sharpe ratio of 1.89 indicates strong risk-adjusted performance, even as individual years saw sizable intraperiod swings.
According to historical data from TradeWave.ai, this early-summer stretch in Lean Hogs has behaved very differently from an average month on the calendar, and the next iteration is only days away.
How has Lean Hogs (LH) traded in this early-summer seasonal window?
Lean Hogs has delivered profitable short trades in all 10 of the past years during the 58-day window that begins on Jun 6, with average gains of 19.22% for those short positions. The upcoming window opens with front-month futures recently settling at 99.50 cents per pound, leaving the contract below its 52-week high of 113.375 and above the 52-week low of 77.125, a band that frames the potential range for another volatile early-summer move.
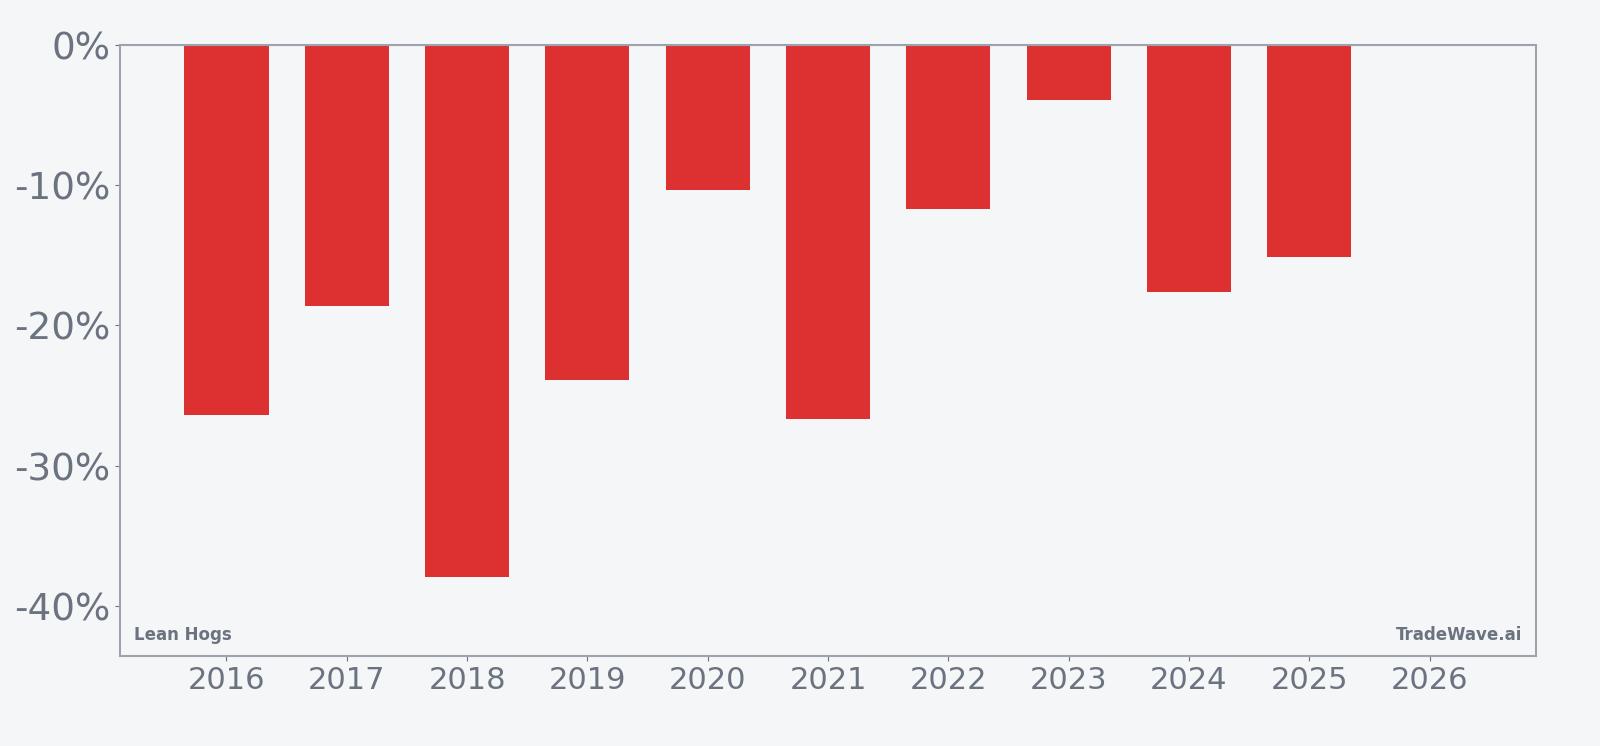
Year-by-year net returns and intraperiod swings show how consistently this window has rewarded shorts while still delivering sizable rallies and drawdowns along the way.
The trade direction for this pattern is explicitly short, and every one of the 10 years in the sample delivered a negative net return for Lean Hogs prices over the window. Percent Profitable sits at 100%, with 10 winners and 0 losers for the short strategy, which is rare consistency for any commodity seasonal pattern. Average profit of 19.22% for winning years means that, in a typical season, prices have dropped enough over the 58 days to generate a high-teens percentage gain for shorts.
Because all years were profitable for the short side, the average profit across all years is effectively the same as the winner average, and there is no dilution from losing seasons. The annualized return of 18.86% and cumulative 462% gain over the decade underline how powerful this specific Lean Hogs seasonal trend has been when repeated year after year. A Sharpe ratio of 1.89 shows that the risk-adjusted profile has been strong, even though individual years saw meaningful volatility.
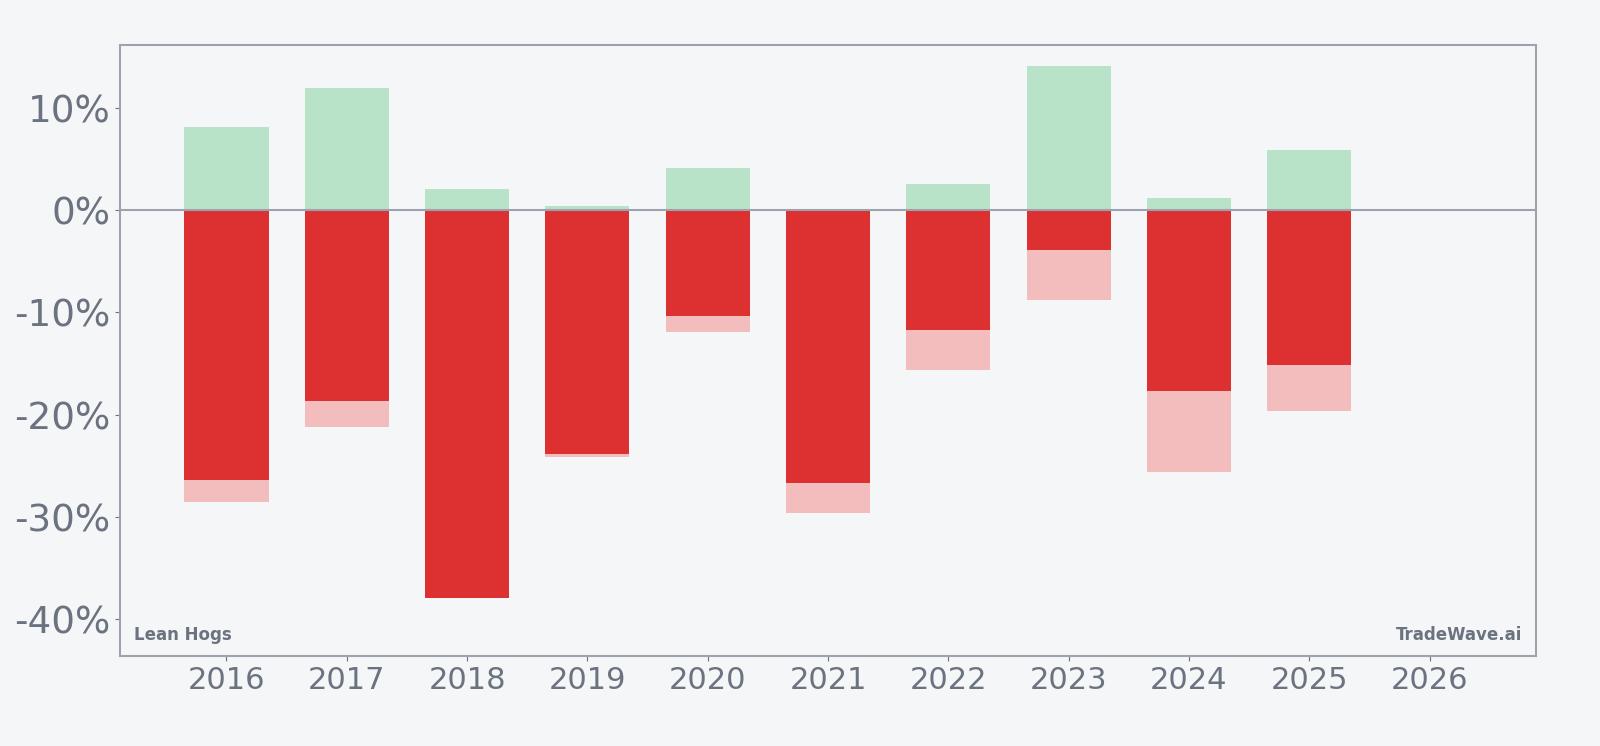
The maximum favorable move within the window, or MFE, has often been large, with several years showing double-digit peak gains for shorts before the window closed. At the same time, maximum adverse excursions, or MAE, have also been significant in some seasons, with intraperiod rallies of more than 20% against the short position before prices rolled over again. That combination of big MFE and sizable MAE points to a high-variance window where the dominant trend has been lower, but the path has rarely been smooth.
The per-year table shows 2018 as one of the strongest seasons for shorts, with a net return of about 37.9% as prices fell from roughly 79.95 to 49.65 over the window. On the other side, 2023 stands out as the mildest year, with a net decline of about 3.91% despite a sizable intraperiod rally that produced a 14.07% favorable move at one point before prices retraced. Add it up: even the softer years still ended with lower prices, while the bigger seasons delivered deep drawdowns in Lean Hogs.
The cumulative return chart for this pattern slopes steadily in favor of the short side, with few flat stretches and no meaningful multi-year reversals. That steady climb in cumulative gains suggests the early-summer Lean Hogs seasonal pattern has not been driven by a single outlier year, but by repeated, medium-sized declines that stack over time. The historical seasonal trend line also hints that much of the typical downside has tended to accrue in the middle of the window, after an initial period of choppy trade.
History does not guarantee future results; adverse excursions can be large even in winning windows, and short positions in volatile commodities like Lean Hogs can face sharp squeezes before the seasonal pattern reasserts itself.
Why does Lean Hogs (LH) follow this seasonal pattern?
This early-summer Lean Hogs seasonal pattern likely reflects commodity supply and demand seasonality more than technical quirks. Analysts often point to rising slaughter numbers and heavier hog weights into summer, which can increase pork supply just as some consumer demand shifts away from peak grilling season. The result has historically been pressure on Lean Hogs prices in June and July, creating a window where short positions have tended to benefit from the fundamental backdrop.
What is driving Lean Hogs (LH) today?
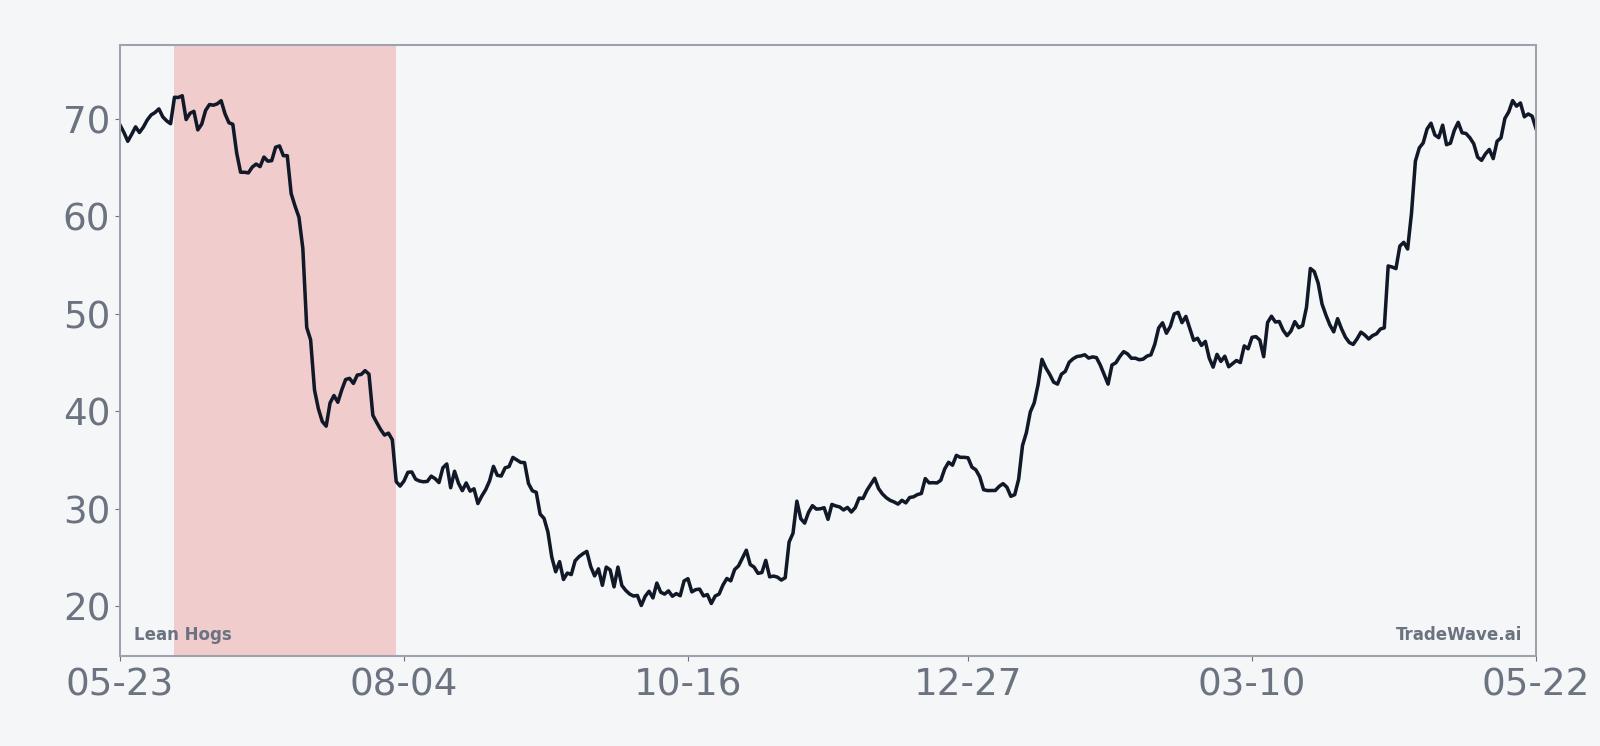
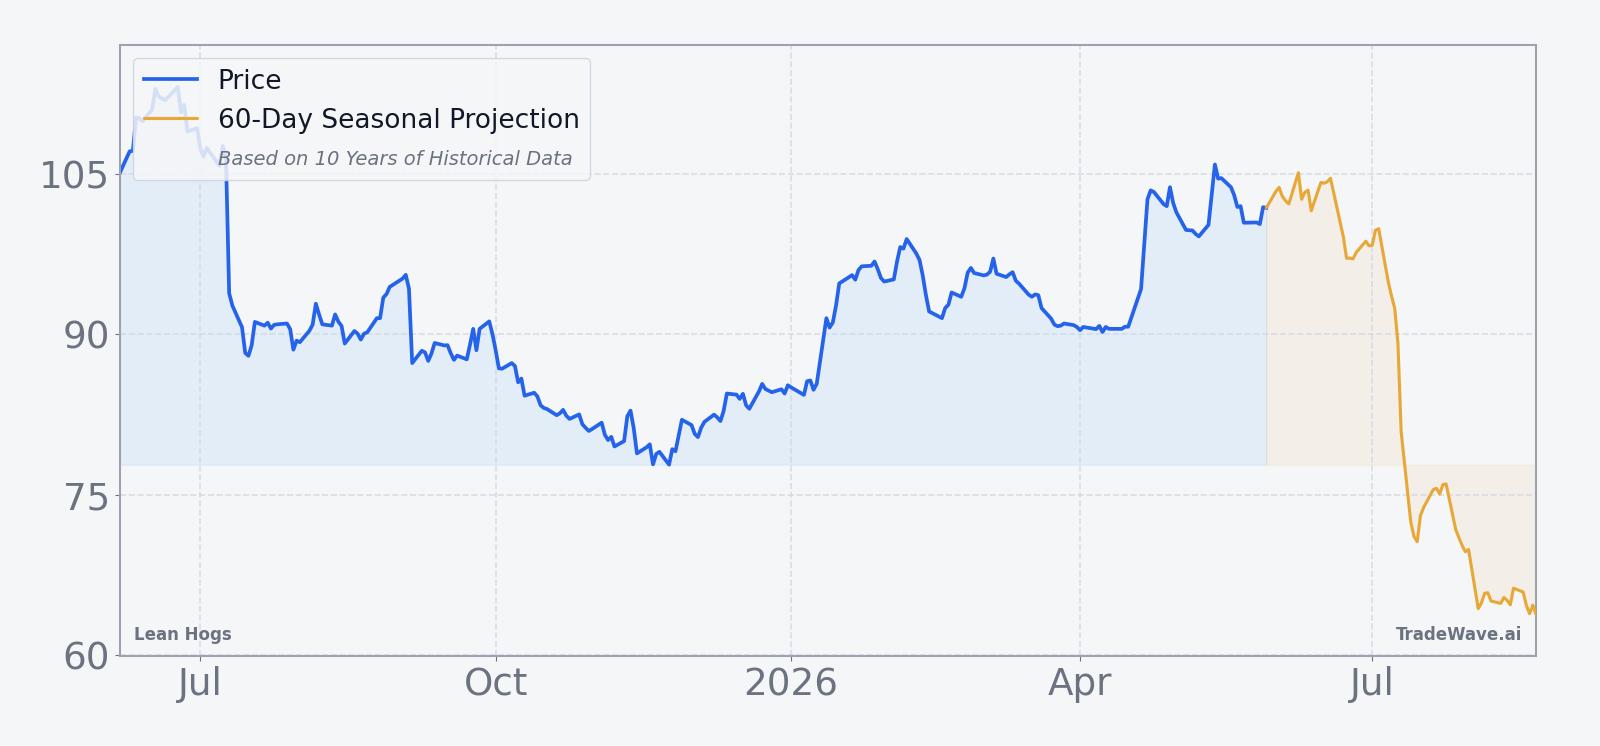
Front-month Lean Hogs futures last settled at 99.50 cents per pound, leaving the contract below its 52-week high of 113.375 and above the 52-week low of 77.125, with a one-month return of -2.43% heading into the new month. The 50-day moving average sits at 96.516, so prices are trading modestly above that intermediate trend line, while 20-day average volume of 11,369 contracts points to a market that is active but not yet in panic mode. With no major fresh macro or livestock-specific catalysts flagged in the latest data, traders are watching how this balance between soft recent performance and still-elevated prices interacts with the historically weak early-summer seasonal window.
The chart below situates the latest move in its recent multi-month context and overlays the upcoming 60-day seasonal projection.
What should traders watch in this Lean Hogs (LH) seasonal window?
The key test for this year is whether Lean Hogs respects a decade-long pattern of early-summer weakness or finally breaks it. With prices sitting between the 52-week extremes and only slightly above the 50-day moving average, the contract has room to move in either direction as the Jun 6 window opens. Historically, the middle of the 58-day stretch has seen the heaviest downside, so traders will be watching whether any early rallies fade or extend.
On the macro side, watch for shifts in feed costs, broader commodity sentiment and the US dollar, all of which can influence hog producer margins and hedging behavior. A stronger dollar or softer grain prices can pressure Lean Hogs if producers become more aggressive sellers into futures strength. Conversely, a sudden spike in feed costs or a risk-on commodity bid could fuel short squeezes that test the resilience of the historical pattern.
Supply and demand data will also matter. Weekly slaughter numbers, carcass weights and any signs of bottlenecks in processing or export logistics can quickly change the tone of the market. If slaughter runs heavy and export demand softens, that would align with the historical seasonal tendency toward lower prices. If instead packers pull back or export flows surprise to the upside, the market could see sharper countertrend rallies inside the window.
From a technical perspective, the 50-day moving average near 96.516 and the 52-week high around 113.375 are the key reference points. Sustained trade below the 50-day average as the window progresses would fit the historical pattern of early-summer softness. A decisive break above the recent range and a push toward the 52-week high would be an early sign that this year may diverge from the past decade’s Lean Hogs seasonal trend.
Finally, volatility itself is a signal. The historical MFE and MAE profile shows that even winning short seasons have included sharp rallies and deep intraperiod drawdowns. If this year’s window opens with unusually quiet price action and compressed ranges, that would be a notable departure from the typical pattern and could set up a delayed but more violent move later in the window. If instead the contract quickly starts swinging in wide daily ranges, traders will be looking to see whether those swings resolve in the same direction they have for 10 straight years.
Sources
About this seasonal analysis
Seasonal pattern data is sourced from TradeWave.ai, which analyzes historical price behavior across annual calendar windows going back up to 30 years. Read the full data methodology or the book The 100-Year Pattern by Afshin Moshrefi (2026 edition). Past performance of seasonal patterns does not guarantee future results. This article is for informational purposes only and does not constitute investment advice.