Lean Hogs (LH) Has Dropped in 10 Straight Early-Summer Windows as June 6 Nears
Lean Hogs futures are trading near the upper half of their 52-week range as an early-summer window that has delivered 10 straight years of double-digit declines approaches.
What is the seasonal pattern for Lean Hogs (LH)?
Lean Hogs has fallen in 10 of 10 years during this early-summer window, with an average gain of 19.22% in winning short trades.
- 10 for 10 in this window, with winning short trades averaging 19.22% gains over the past decade.
- Seasonal window starts Jun 6 and runs 58 trading days, covering the heart of the early-summer hog market.
- Percent Profitable is 100%, with 10 winners and 0 losers across the 10-year lookback.
- Annualized return for the pattern is 18.86%, with a cumulative 462% gain for the short side over the sample.
- The TradeWave Ratio of 2.47 signals that price typically travels meaningfully in the trade direction within the window.
- Intraperiod swings are sizable, with individual years showing deep drawdowns even as the short bias has held.
According to historical data from TradeWave.ai, this early-summer stretch in Lean Hogs has behaved very differently from an average month on the livestock calendar, and the next iteration is only days away.
How has Lean Hogs (LH) traded in this early-summer seasonal window?
Lean Hogs has posted a short-side win in every single early-summer window over the past decade, with average gains of 19.22% for traders positioned short. The next 58-day window begins on Jun 6, with futures currently sitting between a 52-week low of 77.125 and a high of 113.375, leaving plenty of room for either a fresh squeeze or another seasonal slide.
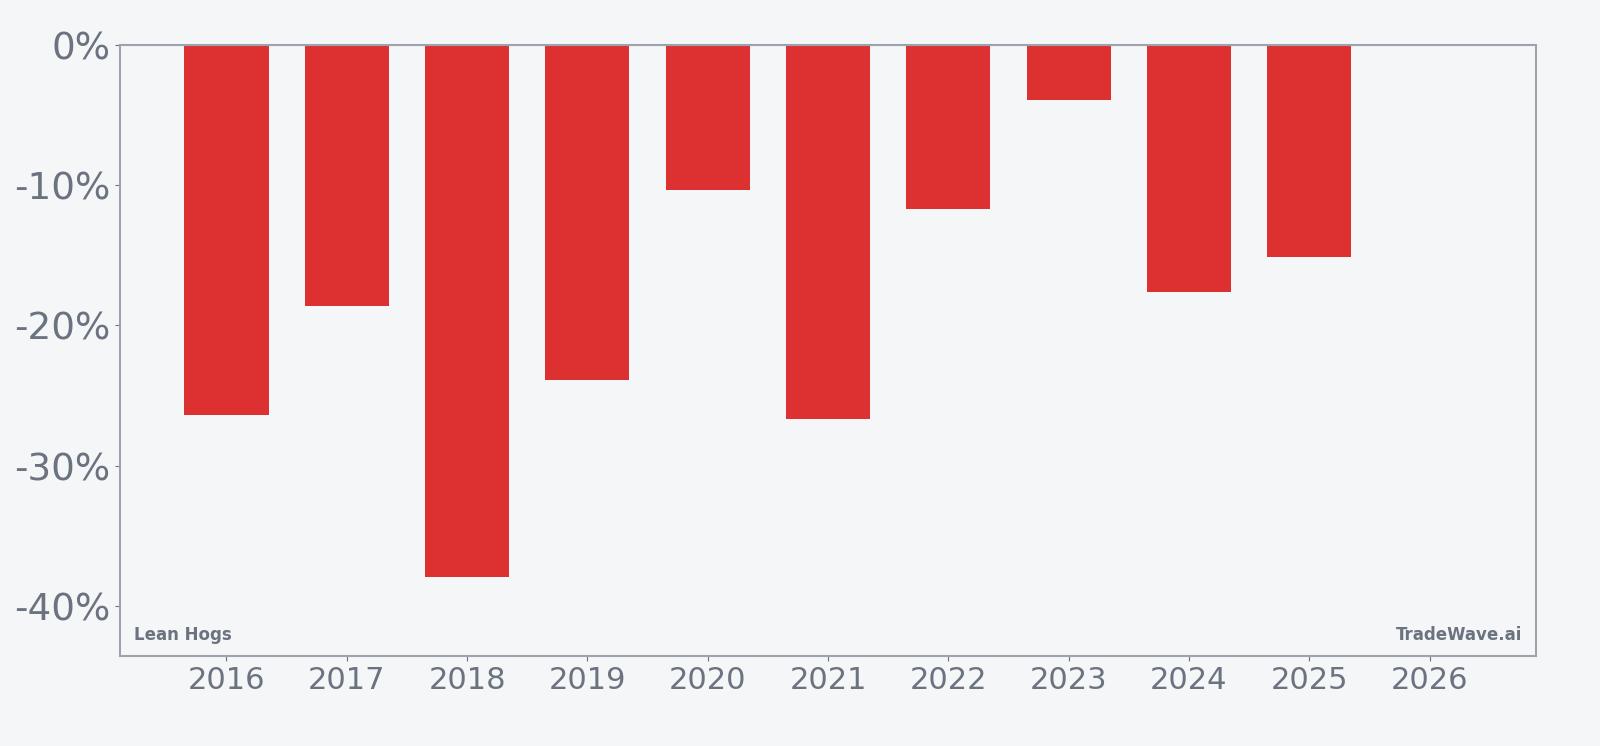
Year-by-year net returns and intraperiod swings underline how consistently this window has leaned lower, even when rallies appeared along the way.
Across the 10-year sample, the trade direction is unambiguously short. Every year from 2016 through 2025 finished the window with Lean Hogs lower, producing a 100% win rate for short exposure and a cumulative 462% gain for the pattern. Average profit of 19.22% per trade and a Sharpe ratio of 1.89 point to a historically strong risk-adjusted profile for this specific slice of the calendar.
The per-year breakdown shows how that plays out in practice. The strongest year for the pattern was 2018, when a short entered around 79.95 and exited near 49.65, a 37.9% gain as prices slid through the window. The softest outcome was 2023, which still delivered a 3.91% short-side gain from 88.325 to 84.875, even though intraperiod rallies pushed the maximum favorable move as high as 14.07% before prices bounced.
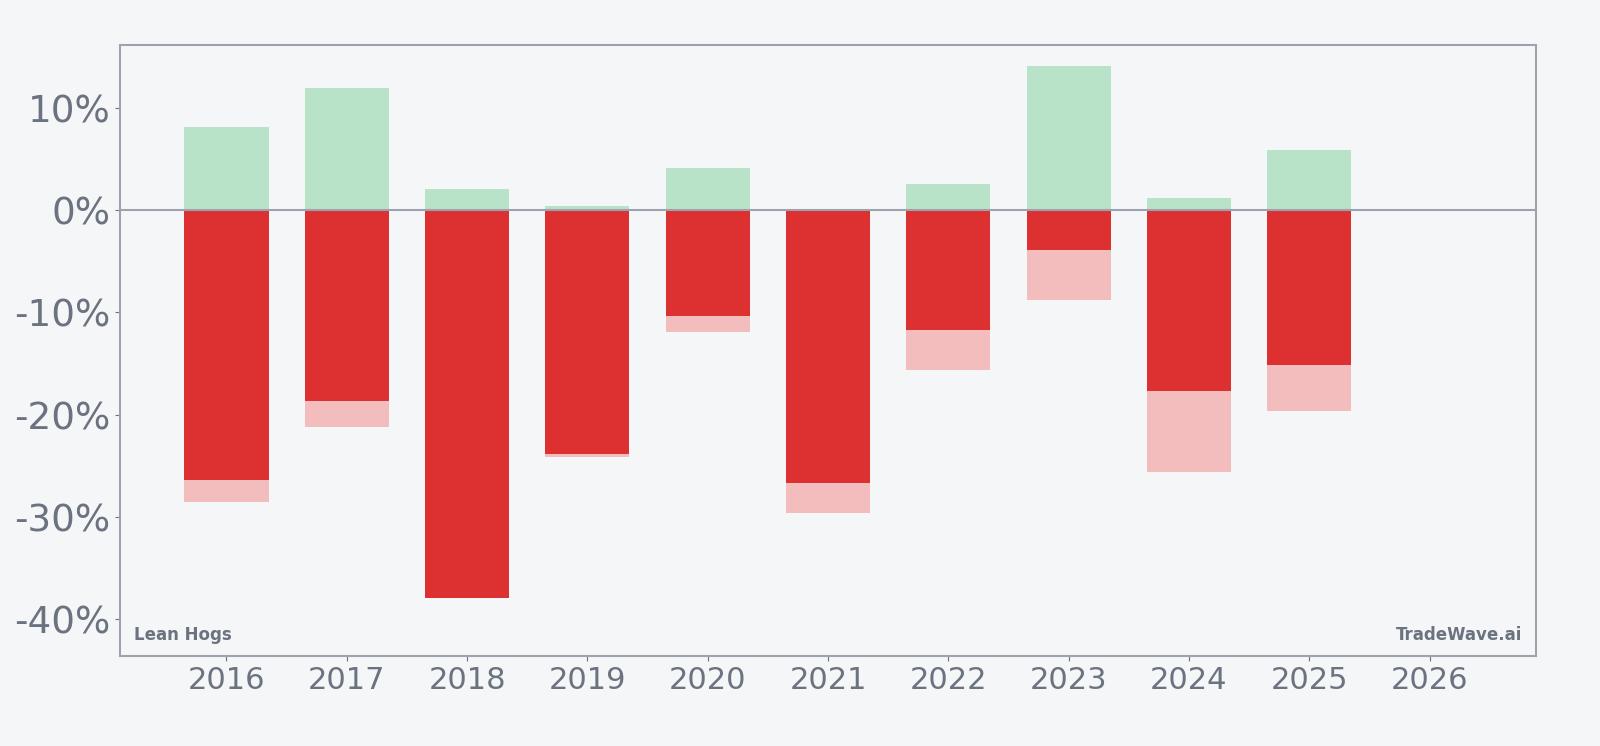
Intraperiod behavior has been volatile. Maximum favorable excursions, the best point-to-peak moves in the trade direction, have ranged from modest single digits to more than 14% in years like 2023. Maximum adverse excursions, the worst drawdowns from entry, have also been large in several cycles, with years such as 2018 and 2021 showing adverse swings in the mid-20% range before the short ultimately paid off. That mix of big MFE and big MAE means this window has historically rewarded patience but punished tight risk limits.
The average seasonal trend line suggests that weakness often builds as the window progresses rather than arriving in a single shock. In many years, Lean Hogs has chopped sideways or even pushed higher early in the period before rolling over more decisively into the back half of the 58 days. The cumulative return profile clusters those down moves into a fairly steady staircase lower, rather than a one-off crash, which is why the annualized return for the pattern sits at 18.86% despite the volatility inside individual years.
Add it up: 10 straight early-summer windows have favored shorts in Lean Hogs, with double-digit average gains and a track record of sizable intraperiod swings that can test conviction before the seasonal bias reasserts itself. History does not guarantee future results; adverse excursions can be large even in winning windows, and traders still need to manage risk around supply shocks, disease headlines, and macro surprises.
Why does Lean Hogs (LH) follow this seasonal pattern?
This early-summer Lean Hogs pattern may reflect the way hog supply and demand line up on the calendar. One likely driver is the flow of animals moving toward slaughter as producers bring spring farrowings to market, which can weigh on prices just as grilling season demand is already priced in. Analysts also point to feed-cost dynamics and packer capacity, which can tighten margins and encourage more aggressive selling into early-summer rallies, reinforcing the historical tendency for futures to fade during this window.
What is driving Lean Hogs (LH) today?
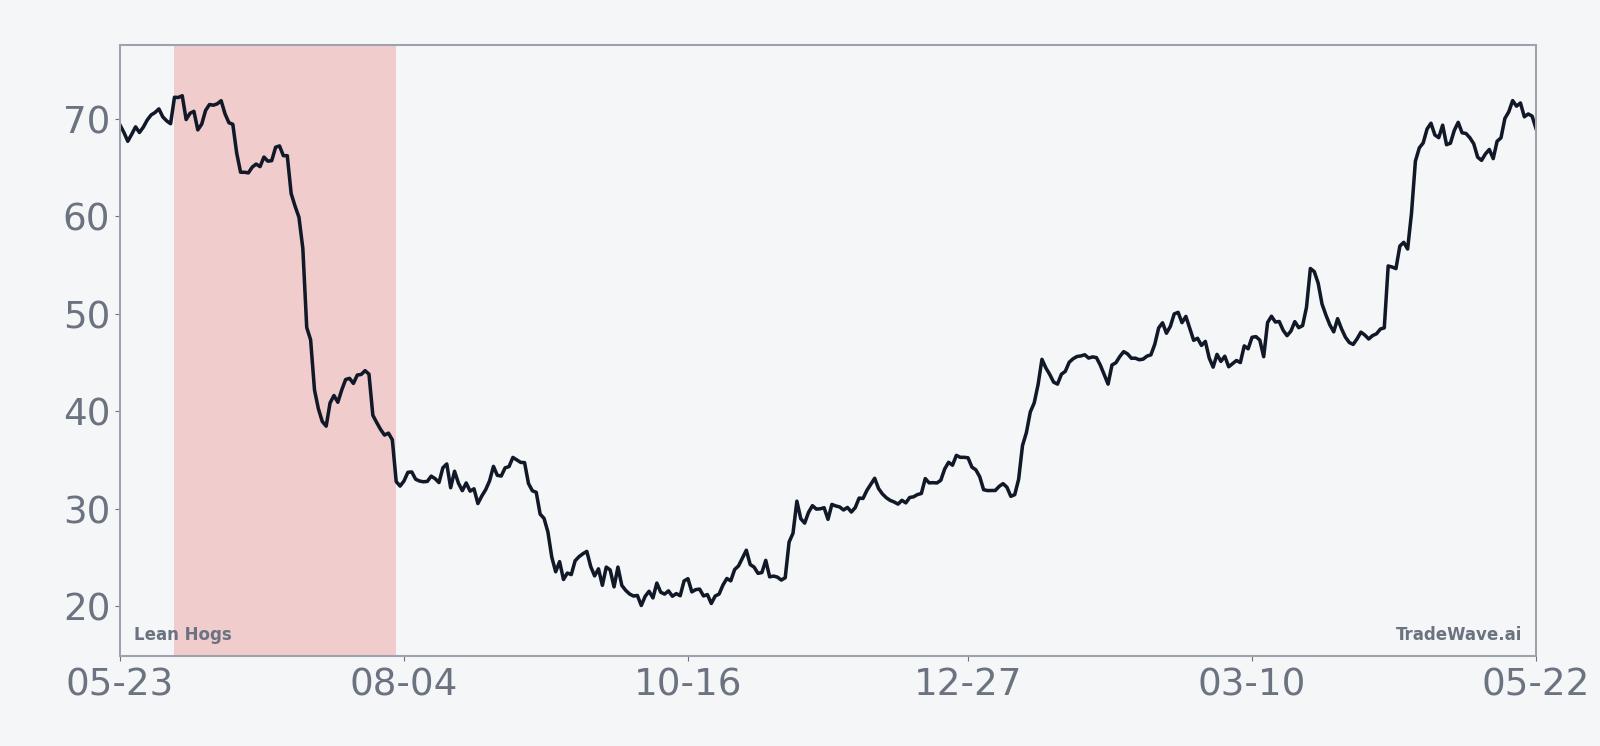
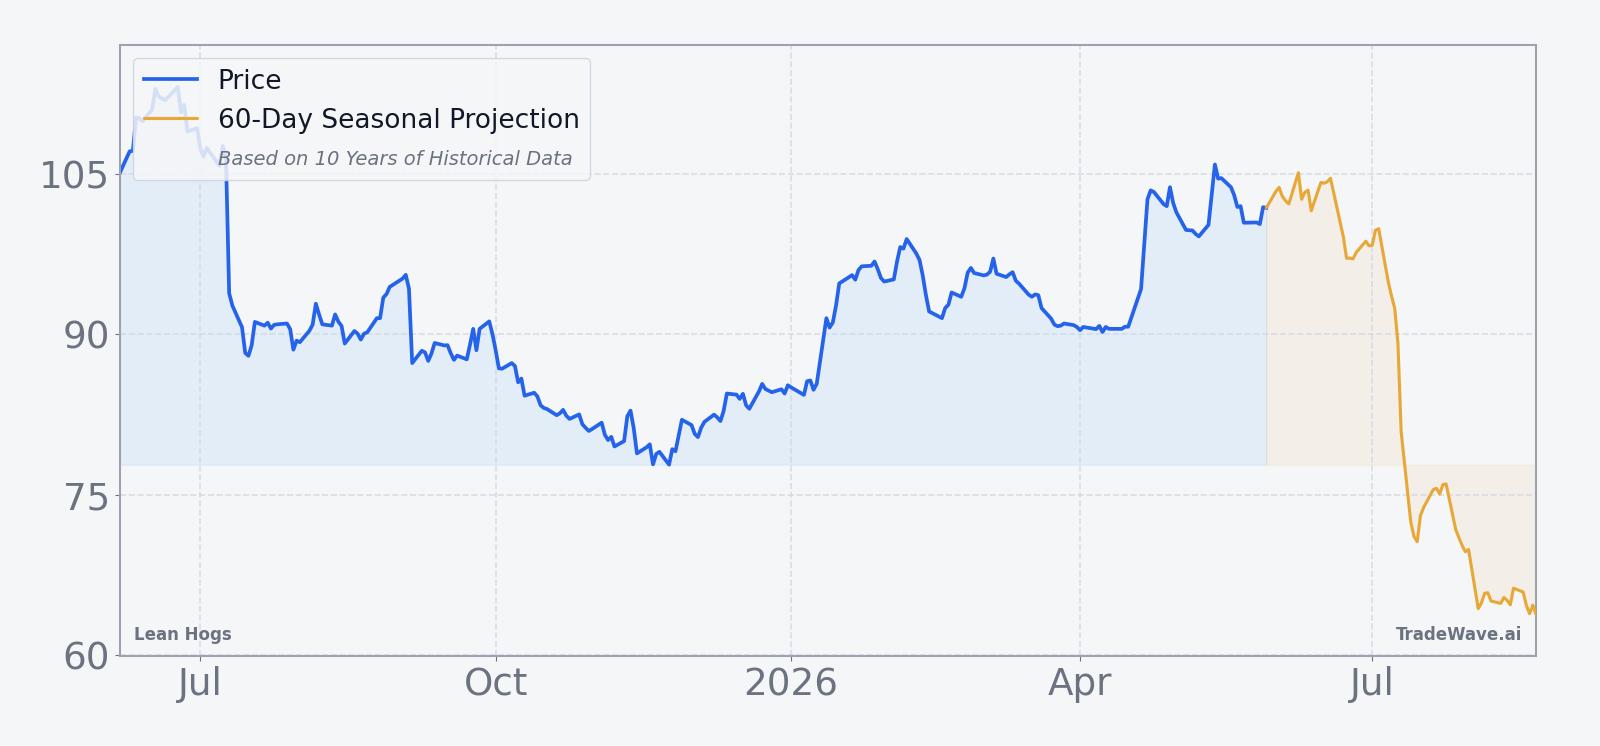
Lean Hogs futures last settled at 100.40, leaving the contract below its 52-week high of 113.375 but well above the 77.125 low, with a one-month gain of 6.16% and prices trading above the 50-day moving average of 95.952 on 20-day average volume of about 7,751 contracts. That puts the market in a firm but not euphoric posture heading into the early-June seasonal window, with recent strength giving producers and hedgers more room to maneuver before the historical early-summer softness has tended to kick in.
The chart below situates the latest move in its recent multi-month context and overlays the upcoming seasonal projection.
What supply, demand, and positioning factors matter for this window?
Lean Hogs sits at the intersection of livestock supply cycles and consumer demand for pork products, so the early-summer stretch often coincides with shifting fundamentals. On the supply side, hog numbers moving through finishing barns into slaughter can rise into June and July, increasing available pork just as retailers have already booked much of their grilling-season needs. That combination has historically created a backdrop where rallies meet heavier selling from producers and packers looking to lock in margins.
On the demand side, the front-loading of summer promotions can leave wholesale and retail buyers less aggressive later in the season. If export demand softens or currency moves make U.S. pork less competitive, that can further pressure Lean Hogs during this window. Positioning by managed money and commercial hedgers also matters: when funds come into the period long after a spring rally, the seasonal pattern of lower prices has often coincided with long liquidation and fresh producer hedging, amplifying downside moves.
What should traders watch as the early-summer Lean Hogs window opens?
As Jun 6 approaches, the key watchpoints are how Lean Hogs behaves around the 100 level, whether prices challenge the 113.375 high again, and how quickly any early strength fades once the window is underway. Traders will be monitoring slaughter and carcass-weight data, export sales, and any signs of demand fatigue in wholesale pork prices, since those factors have historically lined up with the early-summer soft patch. Positioning will also be critical: if speculative length is elevated as the window opens, any reversal could accelerate as funds unwind and producers add hedges into weakness.
For those tracking the historical pattern, the tell will be whether Lean Hogs can sustain a breakout above the recent range through late June, or whether rallies stall and roll over as they have in prior years. A repeat of the typical path would see choppy trade early in the window followed by more persistent pressure into July, while a decisive hold near the highs with shallow pullbacks would mark a clear break from the 10-for-10 record. Either way, the combination of a strong seasonal bias and a market sitting in the upper half of its 52-week band suggests that early summer could be a more volatile stretch than the calm tape of the past month implies.
Sources
About this seasonal analysis
Seasonal pattern data is sourced from TradeWave.ai, which analyzes historical price behavior across annual calendar windows going back up to 30 years. Read the full data methodology or the book The 100-Year Pattern by Afshin Moshrefi (2026 edition). Past performance of seasonal patterns does not guarantee future results. This article is for informational purposes only and does not constitute investment advice.