Analysts See 94.9M Acres for 2026 as Corn (CME) (ZC) Enters Historically Soft June-July Run
Corn (CME) futures sit just below recent highs as an early-June seasonal window with a perfect 10-year bearish record for shorts approaches against a heavy supply backdrop.
What is the seasonal pattern for Corn (CME) (ZC)?
Corn (CME) has fallen in 10 of 10 years during this early-summer 56-day window for short positions, with an average gain of 11.66% in winning years.
- 10 for 10 in this window, with shorts averaging 11.66% gains across winning years over the past decade.
- Seasonal bias is bearish for prices: the 56-day window starting Jun 6 has been profitable for short trades every year in the sample.
- Percent Profitable stands at 100%, with 10 winners and 0 losers for the short-side pattern.
- Median profit for shorts is 13.14%, pointing to a typical move that is slightly larger than the average.
- The TradeWave Ratio of 1.88 signals that price has historically traveled meaningfully in the trade direction within the window.
- Sharpe ratio of 1.4 indicates a strong risk-adjusted profile for this specific ZC seasonal trend, despite sizable intraperiod swings.
According to historical data from TradeWave.ai, this early-summer stretch in corn futures has behaved very differently from an average month on the calendar, and the next iteration is just days away.
How has Corn (CME) (ZC) traded in this early-summer seasonal window?
Corn (CME) has delivered profitable short trades in all 10 of the past years during the 56-day window that begins on Jun 6, with average gains of 11.66% for those short positions. Today front-month ZC futures settled at 455.75 cents per bushel, up 0.7% on the session and about 5.4% below the 52-week high of 481.75, leaving prices elevated but not stretched as the pattern approaches.
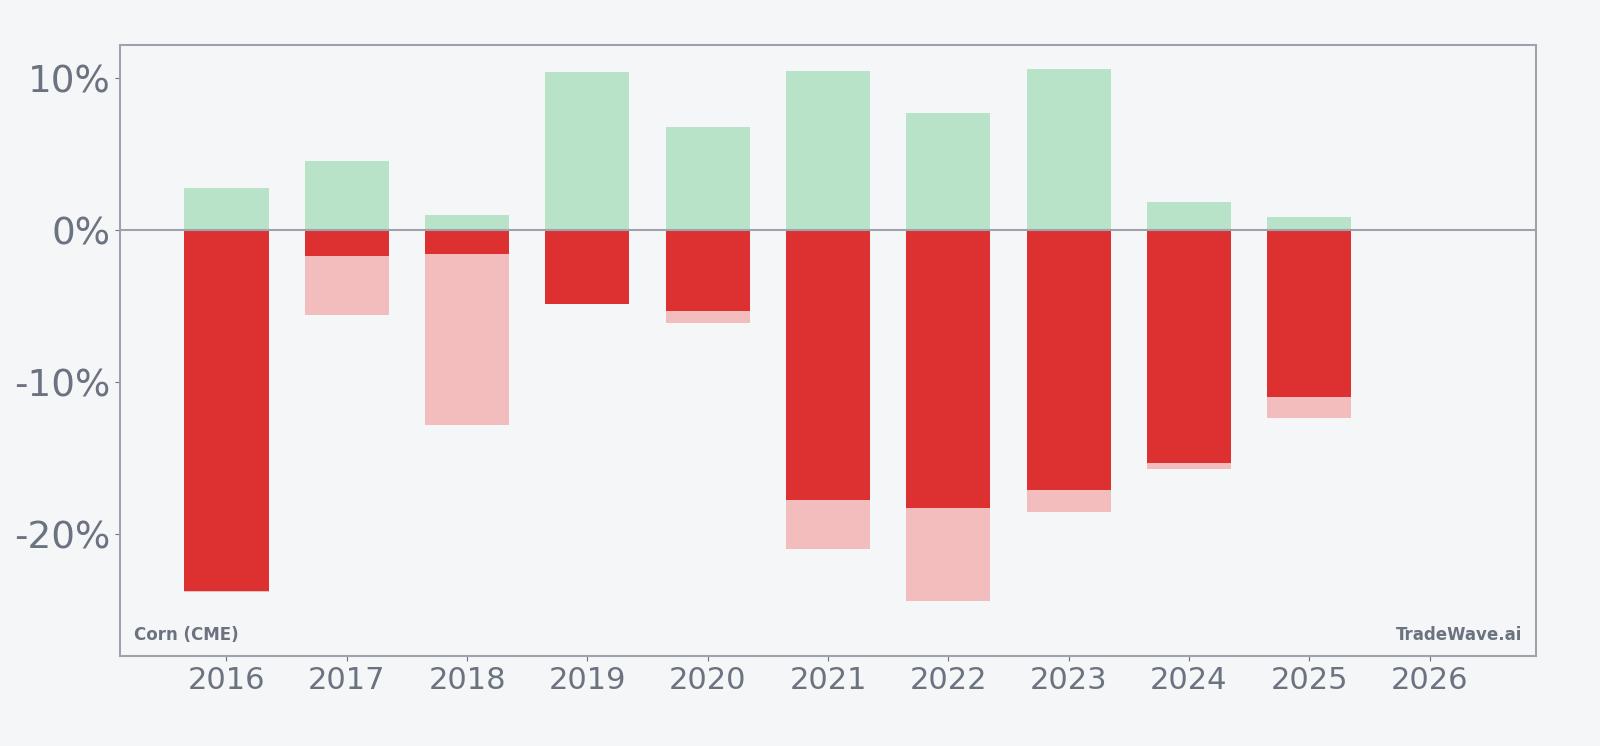
A combined view of net returns with peak favorable and adverse moves shows how far prices have typically swung within the window.
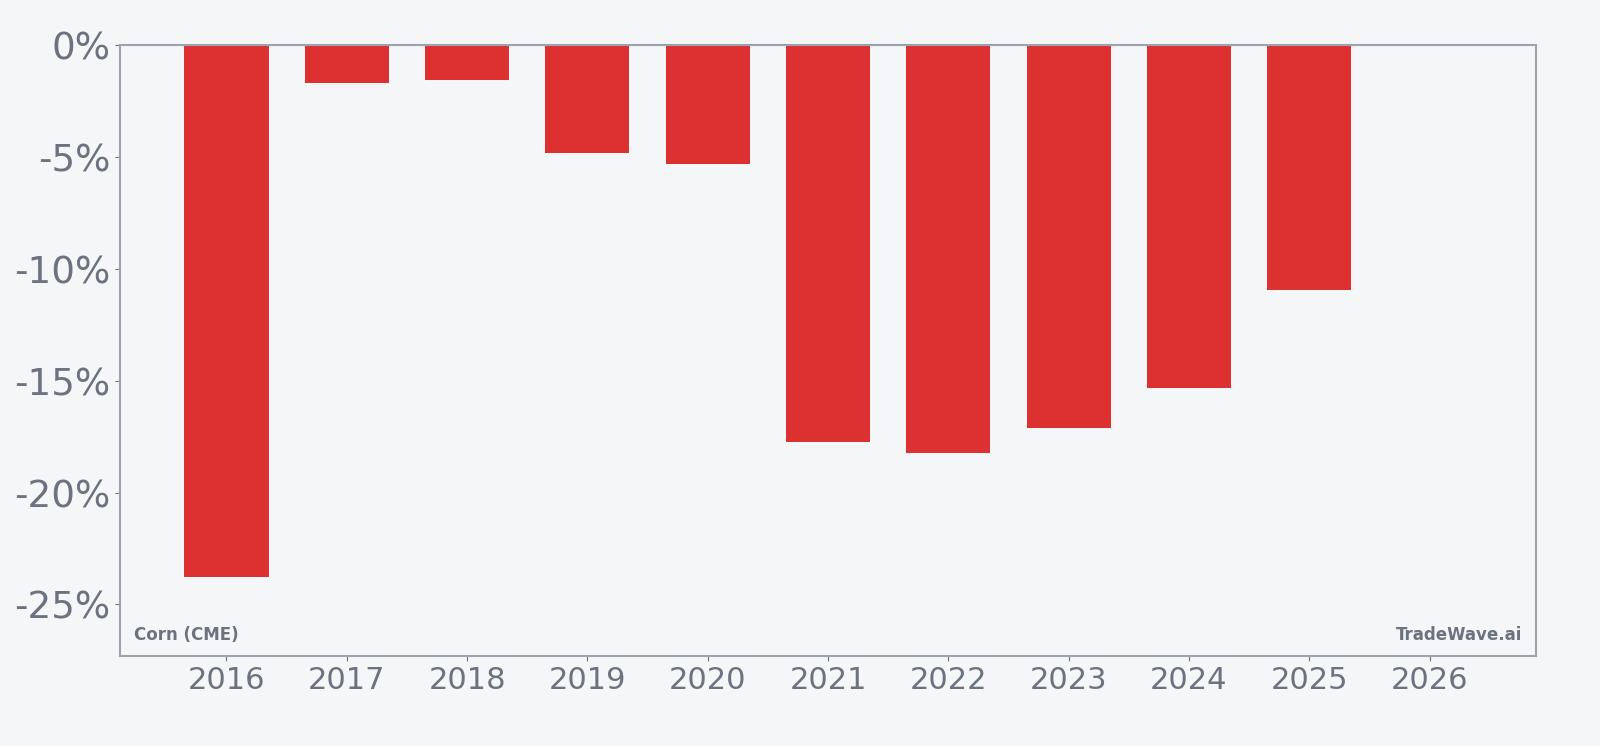
Trade direction for this pattern is explicitly short, so negative net returns in the per-year table represent profitable years for the strategy. Across the 10-year lookback, every single iteration produced a net decline in prices over the window, from a modest 1.59% drop in 2018 to a steep 23.76% slide in 2016. Average profit of 11.66% and a median of 13.14% show that the typical year has delivered a double-digit move in favor of shorts, not just a handful of outliers.
The intraperiod swings have been large. In 2016, for example, the best point-to-peak move in favor of shorts, known as the maximum favorable excursion, reached 2.81%, while the worst drawdown from entry, or maximum adverse excursion, hit 23.82% before prices ultimately fell sharply into profit. Other years such as 2021 and 2022 saw favorable excursions above 7% to 10% and adverse moves deeper than 20%, underscoring that even winning windows have featured sharp countertrend rallies along the way.
The 10-year seasonal trend chart shows that, on average, the bulk of the downside for prices has tended to accrue in the middle of the 56-day span rather than immediately after Jun 6. Early days in the window have often been choppy, with prices sometimes pushing higher before rolling over, while the back half has historically seen more persistent pressure. The cumulative return profile climbs steadily for the short strategy, reflecting how repeated mid-summer softness in corn has stacked up over the decade.
Viewed through the combined net/MFE/MAE bars, the pattern looks like a high-variance but consistently rewarding setup for shorts. Many years show favorable excursions that are only slightly larger than the final net result, suggesting that traders who stayed with the move captured most of the available downside, while the adverse excursions highlight the need to tolerate sizable squeezes within the window. Add it up: 194% cumulative gains for the short strategy across ten early-summer windows, with no losing years in this sample.
History does not guarantee future results, and the worst intraperiod drawdowns in this window have been large even in years that ultimately finished as winners for shorts.
Why does Corn (CME) (ZC) follow this seasonal pattern?
This early-summer pattern likely reflects classic commodity supply and demand seasonality. By June and July, U.S. corn planting is largely complete, weather forecasts for pollination firm up, and USDA supply estimates and acreage data give the market clearer visibility on potential surplus or tightness. Analysts have pointed to this period as one where heavy acreage, improving crop prospects, and shifting hedging flows from producers can combine to pressure prices, creating a recurring window that has historically favored short exposure.
What is driving Corn (CME) (ZC) today?
Corn (CME) futures closed at 455.75 cents on May 27, up 3.25 cents on the day, leaving the contract roughly 2.9% lower over the past month but still within sight of its 52-week high at 481.75. The market has been wrestling with a heavy supply narrative after the U.S. Department of Agriculture raised projected U.S. corn ending stocks to 2.23 billion bushels in its January World Agricultural Supply and Demand Estimates report, a sizable increase from December that signaled more comfortable inventories and pressured prices earlier in the year.[1]
In February, a Reuters analyst poll projected 2026 U.S. corn plantings at about 94.9 million acres, reinforcing expectations for large acreage and the potential for continued ample supply if weather cooperates.[1] That acreage outlook, combined with steady export demand around 1.6 million metric tons of old-crop sales reported for the week ended Apr 23, has kept the focus on whether global demand can absorb what looks like another big U.S. crop.[1] With biofuel demand tied to oil prices and weather risk still ahead, traders are balancing the bearish supply story against the possibility of summer weather scares that can quickly tighten the balance sheet.
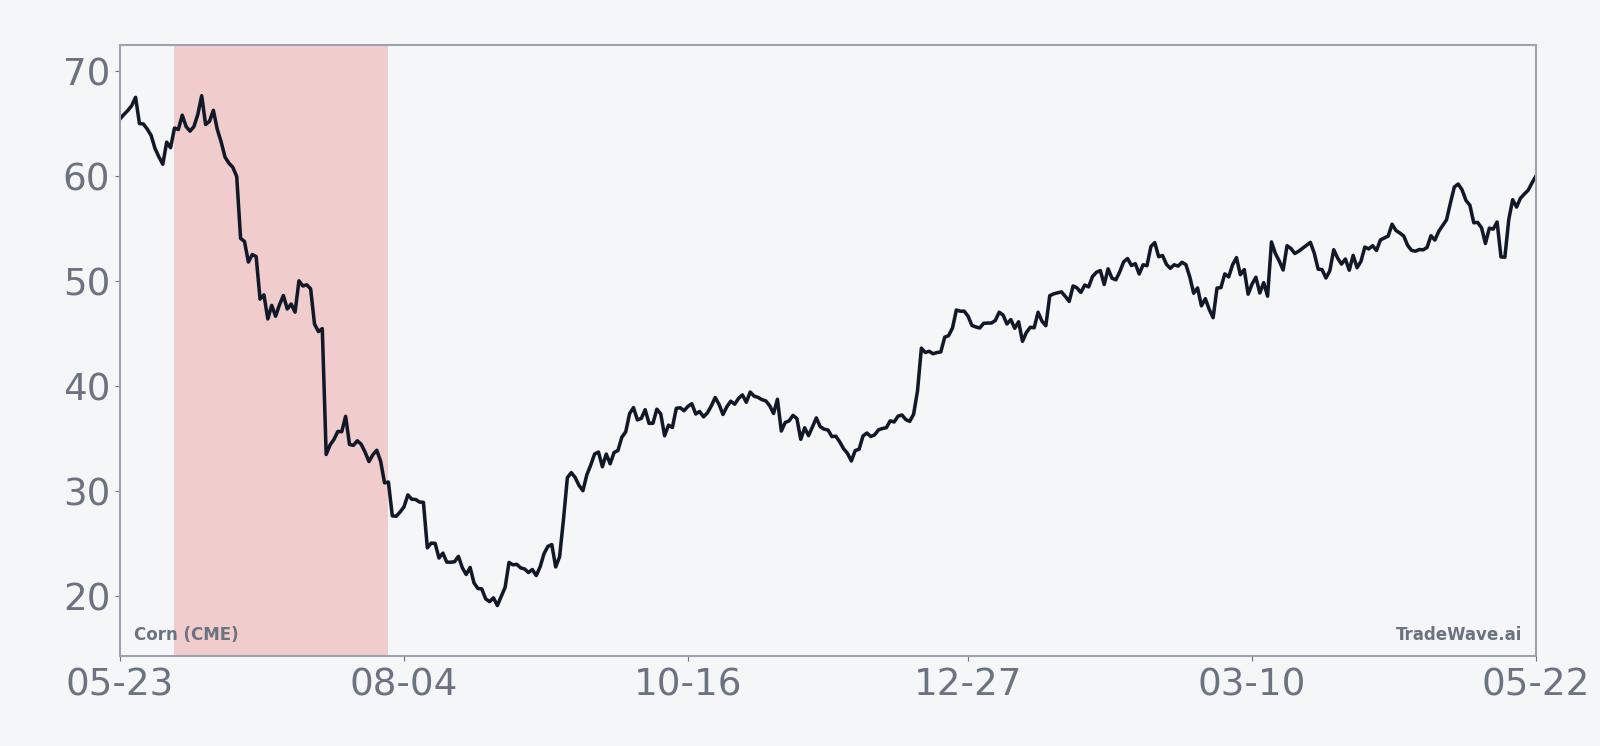
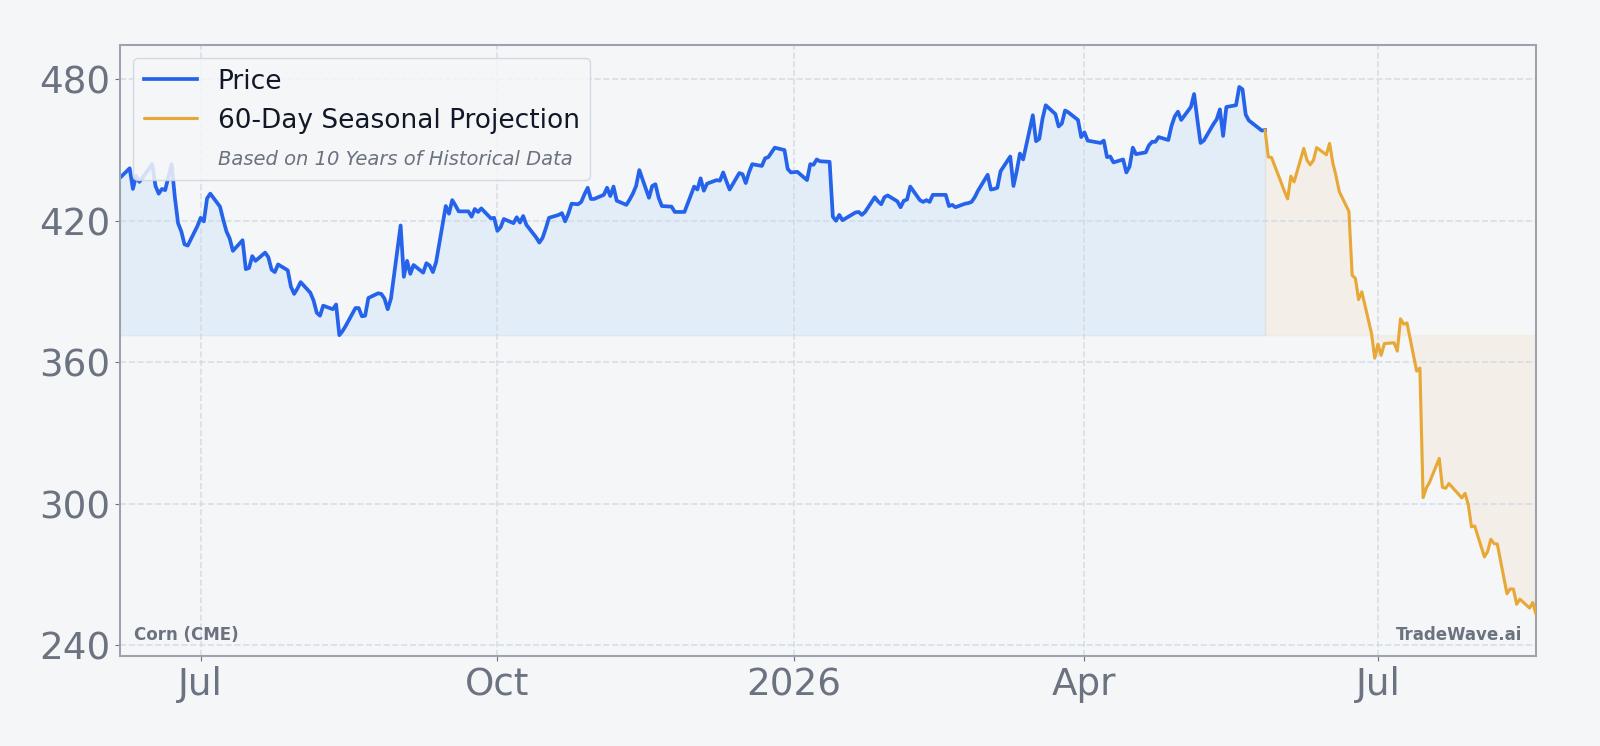
The chart below situates the latest move in its recent multi-month context and overlays the upcoming 60-day seasonal projection.
What should traders watch as this Corn (CME) seasonal window approaches?
With the early-summer window set to open on Jun 6, the key watchpoint is whether the current supply-heavy narrative persists or is challenged by weather or demand surprises. Historically, the pattern has favored shorts even in years with strong export demand, but the path has rarely been smooth, with several cycles featuring sharp intraperiod rallies before prices rolled over. Traders will be watching weekly USDA export sales, updated WASDE supply estimates, and any signs of acreage or yield risk that could blunt the usual seasonal weakness.
Price levels also matter. The 52-week high near 481.75 has acted as a reference point for recent rallies, and behavior around that band as the window opens will help show whether this year is tracking closer to the deep-decline years like 2016 and 2021 or the more modest moves seen in 2017 and 2018. A failure to sustain strength into or through that resistance area would be more in line with the historical pattern, while a decisive breakout and hold above it would mark a clear departure from the past decade’s early-summer script.
Finally, volatility inside the window will be as important as direction. The historical MFE and MAE profile shows that when corn moves in this period, it tends to move quickly in both directions before settling into its final trend. Traders will want to monitor intraday ranges, options-implied volatility, and any weather-driven gaps as signals of whether this year’s early-summer stretch is conforming to the established ZC seasonal trend or breaking it. A year that starts with strong rallies and holds those gains into late July would be the first clear exception to a 10-year run of profitable short windows.
Sources
About this seasonal analysis
Seasonal pattern data is sourced from TradeWave.ai, which analyzes historical price behavior across annual calendar windows going back up to 30 years. Read the full data methodology or the book The 100-Year Pattern by Afshin Moshrefi (2026 edition). Past performance of seasonal patterns does not guarantee future results. This article is for informational purposes only and does not constitute investment advice.