Corn (CME) (ZC) Has Dropped in 10 of 10 Early-Summer Windows, Averaging 13.12% Losses
Corn (CME) futures sit near $4.20 a bushel just days before a 58-day window that has delivered consistent early-summer price pressure over the past decade.
What is the seasonal pattern for Corn (CME) (ZC)?
Corn (CME) has fallen in 10 of 10 years during this early-summer 58-day window, with an average loss of 13.12% in winning years for short positions.
- 10 for 10 in this window, with short trades averaging 13.12% gains in winning years over the past decade.
- The upcoming 58-day window starts Jun 13 and has historically been a bearish seasonal stretch for Corn (CME) prices.
- Percent Profitable is 100%, with 10 winners and 0 losers for the short-direction pattern in this ZC seasonal trend.
- Average profit of 13.12% reflects sizeable moves lower in strong years, including a 25.06% drop in 2016 and a 21.47% slide in 2023.
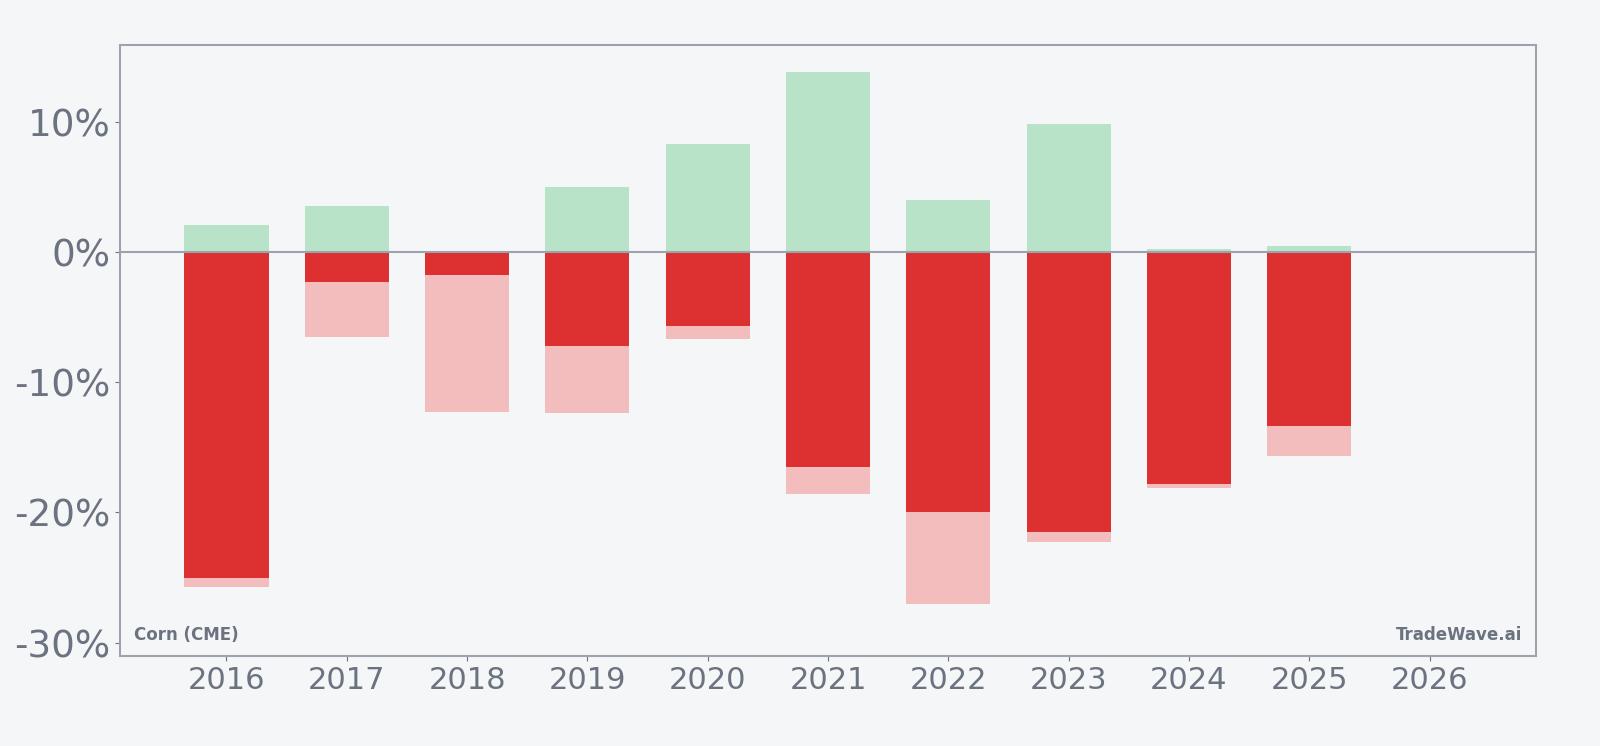
- Intraperiod swings have been wide, with worst-year drawdowns from entry reaching as much as 27.01% before prices stabilized.
- Add it up: cumulative gains for the short pattern total 234% across the ten early-summer windows in this Corn (CME) trading window.
According to historical data from TradeWave.ai, this early-summer stretch in Corn (CME) has behaved very differently from an average month on the calendar, and the next iteration is about to begin.
How has Corn (CME) (ZC) traded in this early-summer window?
Corn (CME) has delivered profitable short trades in all 10 of the past early-summer windows starting around Jun 13, with average gains of 13.12% for those short positions. The front-month contract last settled at 419.5 cents per bushel, leaving it about 12.9% below its 52-week high of 481.75 and roughly 13.7% above the 52-week low of 368.75.[1] That combination of a mid-range price and a historically one-sided seasonal pattern is why this window is on traders’ radar.
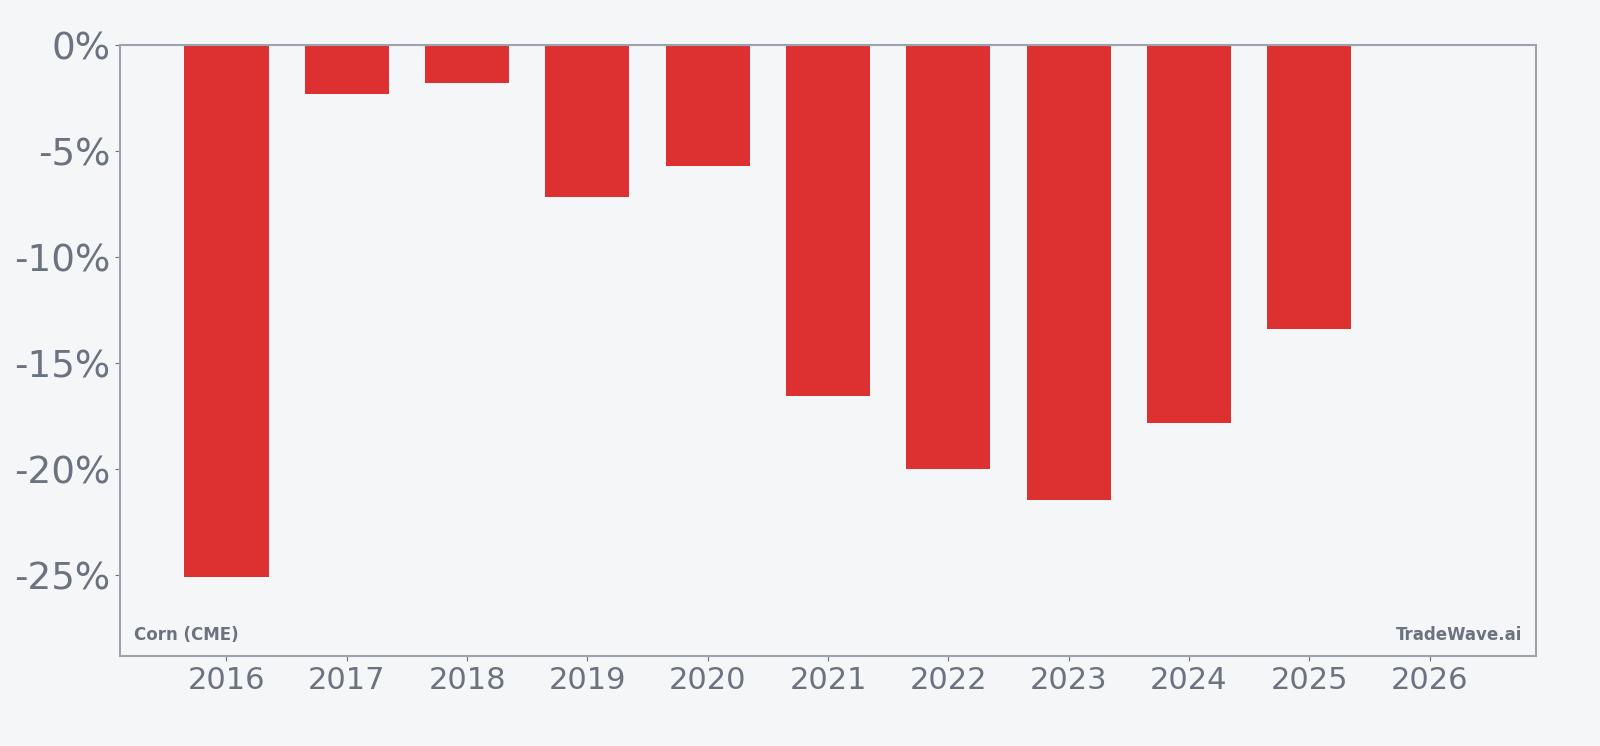
Year-by-year net returns and intraperiod swings show how consistently this window has pressured corn prices while still delivering sizable rallies and drawdowns along the way.
The trade direction for this pattern is explicitly short, and every one of the past 10 years has finished the 58-day window with corn prices lower than the entry level. Percent Profitable sits at 100%, with 10 winners and 0 losers, which is rare for any futures seasonal pattern over a decade-long lookback. Average profit of 13.12% for the short side means that in a typical year, corn has dropped by roughly that amount from entry to exit during this slice of the calendar.
The distribution of outcomes is wide. The strongest year for the pattern was 2016, when a short entered around 430 cents and exited near 322.25, a net move of about 25.06% in favor of the short, while the weakest year was 2018, when the net gain for shorts was a modest 1.8% as prices slipped from 376 to 369.25. In between sit years like 2023, when corn fell 21.47% from 612.5 to 481.0, and 2021, when a 16.53% decline from 659.25 to 550.25 rewarded shorts but came with sharp intraperiod rallies.
The MFE/MAE profile underlines how bumpy the ride can be even in a cleanly bearish seasonal window. Maximum favorable moves for shorts have reached as high as 27.01% in 2022, when prices dropped from 769.25 to a low that left shorts deeply in the money before the final 19.99% net gain was booked. On the other side, maximum adverse excursions have at times been double digits, such as the 13.84% rally against shorts in 2021 before the market rolled over, or the 9.8% squeeze in 2023 that preceded a larger decline.
Trend metrics inside the pattern show that 79 of 80 trend segments lean in favor of the short direction, suggesting that weakness is not confined to a single week but tends to persist across much of the 58-day span. The 10-year average seasonal curve slopes steadily in favor of lower prices, with many years showing pressure building after the first couple of weeks rather than an immediate collapse. The cumulative return chart reinforces that this is not a one-off anomaly: the 234% cumulative gain for the short pattern across the decade reflects repeated, compounding downside stretches in this same early-summer window.
History does not guarantee future results; adverse excursions can still be large even in winning windows, and short patterns in particular can face sharp squeezes before the seasonal tendency reasserts itself.
Why does Corn (CME) (ZC) follow this seasonal pattern?
This early-summer pattern likely reflects commodity supply and demand seasonality as Northern Hemisphere crops move through key growing stages and weather risk is repriced. Analysts often point to shifting yield expectations, acreage updates and evolving USDA balance sheets as drivers of volatility that can pressure prices when supply looks comfortable. The window may also capture hedging flows from producers and merchandisers who lock in prices ahead of harvest, adding incremental selling pressure to the Corn (CME) seasonal outlook.
What is driving Corn (CME) (ZC) today?
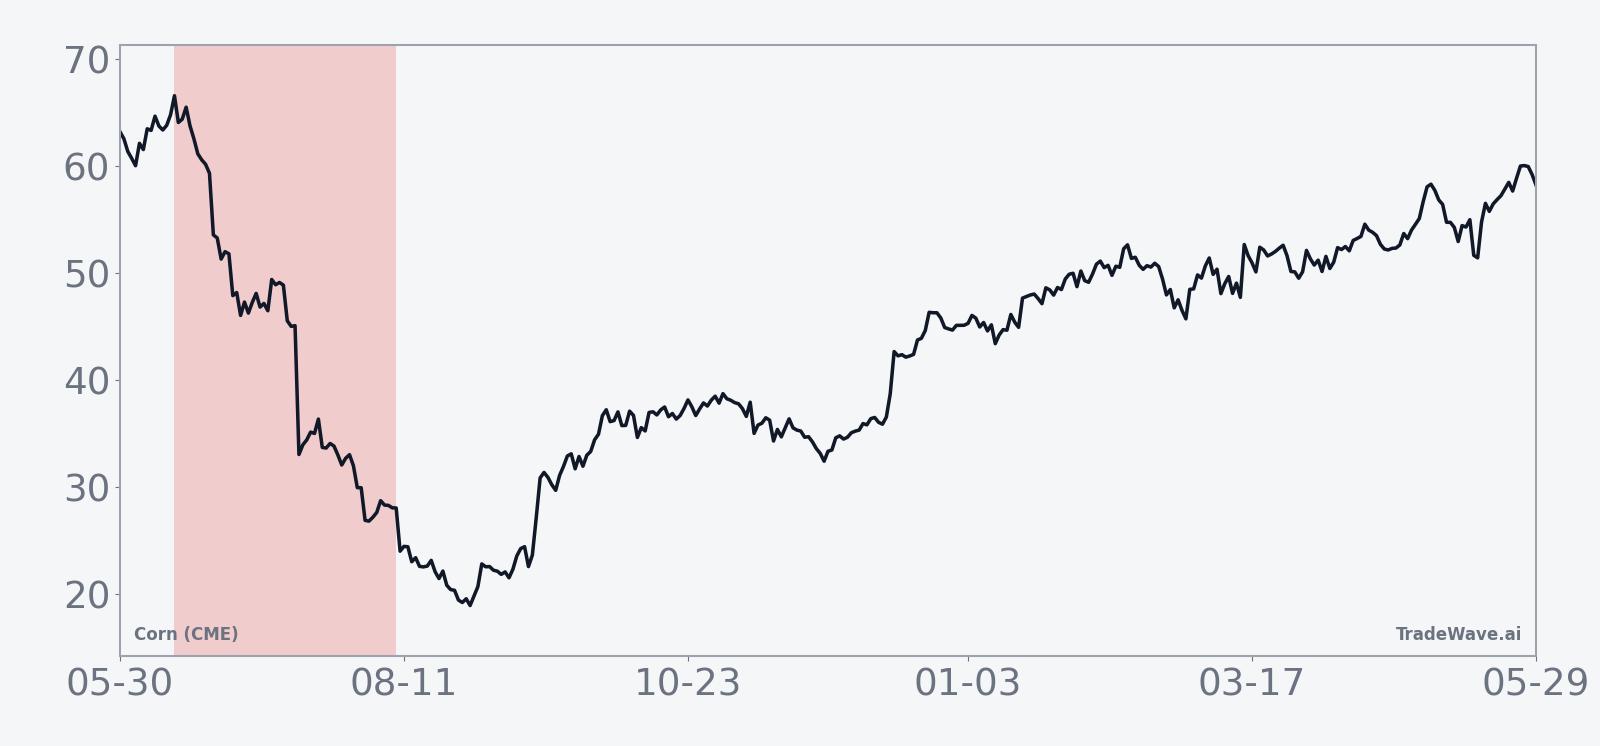
Corn (CME) futures are trading at 419.5 cents, up 0.36% on the day, after sliding 8.38% over the past month and drifting below their 50-day moving average of 453.595 as the market digests a comfortable supply backdrop.[1] The contract sits between its 52-week extremes, roughly 12.9% under the high and 13.7% above the low, which leaves room for weather or policy shocks to push prices either way as the U.S. growing season advances.[1]
In January 2026, USDA’s WASDE report projected U.S. corn ending stocks at 2.23 billion bushels, about 200 million bushels higher than the prior month, reinforcing the idea of ample supply and weighing on futures.[2] That stockpile estimate still hangs over the market, with the latest positioning shaped by the sense that the balance sheet is more comfortable than in the tight years of 2021 and 2022. At the same time, weekly USDA export sales reported in late April showed old-crop net export sales of 1,597,800 metric tons, broadly in line with expectations and signaling steady demand rather than a demand shock that might quickly absorb those stocks.[3]
Macro cross-currents also matter for this contract because of corn’s role as a biofuel feedstock. Oil price strength tied to geopolitical supply disruptions has supported corn and soy futures at times, as higher energy prices improve the economics of ethanol and biodiesel production.[3] For now, though, the combination of comfortable U.S. ending stocks and only steady export demand has kept rallies in check, even as energy markets remain volatile.
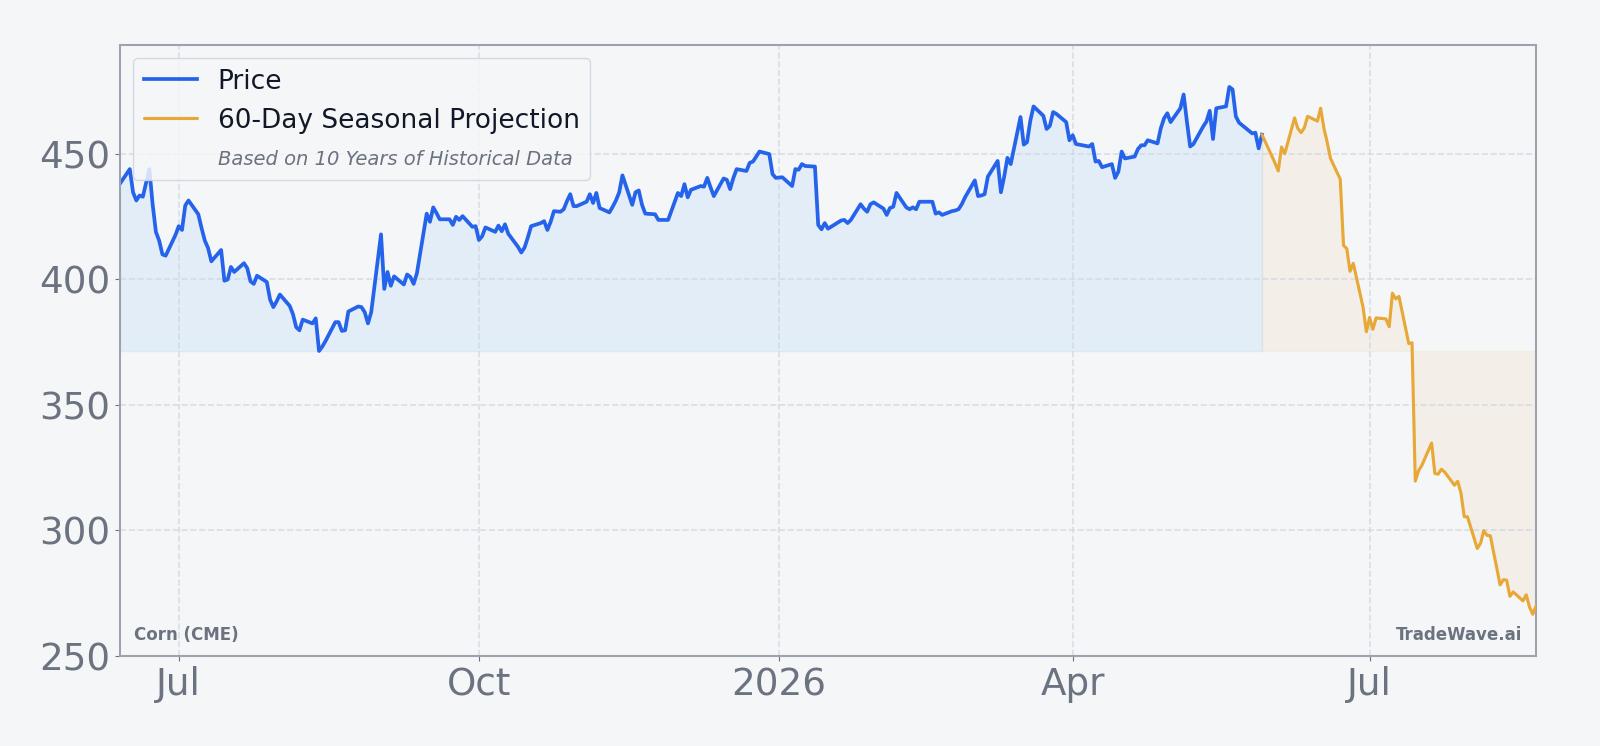
The chart below situates the latest move in its recent multi-month context and overlays the upcoming seasonal projection.
How do supply, demand and logistics shape this Corn (CME) seasonal window?
The seasonal pattern lines up with a period when U.S. and global corn markets are focused on crop conditions, planting progress and early yield indications rather than immediate harvest flows. With USDA projecting U.S. ending stocks at 2.23 billion bushels, the market is starting this window from a position of relative comfort on supply, which historically has made it easier for prices to drift lower when weather cooperates.[2]
Export demand has been solid but not explosive. The late-April weekly report showing 1,597,800 metric tons of old-crop net export sales confirmed that buyers are present but not scrambling for supply at any price.[3] That kind of steady, expectations-matching demand tends to cap upside spikes and can reinforce the historical seasonality where rallies during this window have often been sold into rather than extended.
Logistics and shipping conditions can still inject volatility. River levels, freight costs and port congestion all influence basis levels and export competitiveness, especially when South American crops are moving into the pipeline at the same time. In years when logistics have been smooth and global supply ample, the early-summer window has often seen futures soften as buyers feel less urgency to secure coverage far ahead of harvest.
What should traders watch in this Corn (CME) seasonal window?
With Corn (CME) heading into a 58-day window that has historically favored shorts in every year of the past decade, the key question is whether today’s supply and demand mix will allow that pattern to repeat. Traders will be watching weekly USDA crop condition reports, any revisions to the 2.23 billion bushel ending-stocks projection, and export sales data for signs that the balance sheet is tightening or loosening relative to expectations.[2][3]
Price levels matter too. The 52-week high near 481.75 and the 50-day moving average around 453.595 are likely to serve as reference points for any early rallies inside the window, while the 52-week low at 368.75 marks the lower edge of the recent range.[1] Behavior around those levels will help confirm or challenge the historical pattern: sustained trade below the moving average with rallies sold would rhyme with prior years, while a decisive break above resistance on strong demand or weather stress would be a clear departure from the usual ZC seasonal trend.
On the macro side, energy prices and biofuel policy remain swing factors. A renewed spike in crude could tighten the link between corn and ethanol margins, potentially muting some of the downside that has characterized this window in the past.[3] Conversely, if oil stabilizes or softens while USDA nudges ending stocks higher, the historical early-summer weakness could again find room to play out.
Add it up: this 58-day Corn (CME) trading window has a rare 10-for-10 record for shorts, but the path has often involved sharp intraperiod rallies and deep drawdowns. Traders who track this historical seasonality will be watching whether price action, inventory updates and export flows line up with that script or signal that this year’s early-summer stretch is breaking the pattern.
Sources
About this seasonal analysis
Seasonal pattern data is sourced from TradeWave.ai, which analyzes historical price behavior across annual calendar windows going back up to 30 years. Read the full data methodology or the book The 100-Year Pattern by Afshin Moshrefi (2026 edition). Past performance of seasonal patterns does not guarantee future results. This article is for informational purposes only and does not constitute investment advice.