Corn (CME) (ZC) Has Dropped in 10 Straight Late-June Windows as New Downside Stretch Opens
Corn (CME) futures sit well below their 52-week high just as a nine-day June seasonal window with a perfect bearish record is about to open.
What is the seasonal pattern for Corn (CME) (ZC)?
Corn (CME) has fallen in 10 of 10 years during this late-June nine-day window, with an average gain for short positions of 3.56% in winning years.
- 10 for 10 in this window, with short trades averaging 3.56% gains across winning years over the past decade.
- The upcoming pattern runs from Jun 16 for nine trading days and has historically favored downside in Corn (CME) futures.
- Percent Profitable is 100%, with 10 winners and 0 losers for the short-direction setup in this ZC seasonal trend.
- Average net return across all years is 4%, reflecting consistently profitable short exposure in this Corn (CME) trading window.
- Intraperiod swings have been meaningful, with several years showing sharp adverse moves before prices ultimately rolled over.
- Add it up: a 41% cumulative return for the short pattern across ten iterations of this June seasonal window.
According to historical data from TradeWave.ai, this mid-June stretch has behaved very differently from an average month on the corn calendar, and the next iteration begins tomorrow.
How has Corn (CME) (ZC) traded in this mid-June window?
Corn (CME) has delivered profitable short trades in all 10 of the past years during this nine-day mid-June window, with an average move of about 3.56% in favor of the bears. The new window starts on Jun 16 with front-month futures last at 409.75 cents per bushel, leaving the contract about 15.0% below its 52-week high of 481.75 and roughly 11.1% above its 52-week low of 368.75. That combination of a clean seasonal record and a price sitting in the lower half of the yearly range gives this year’s setup extra weight for grain traders watching the ZC seasonal trend.
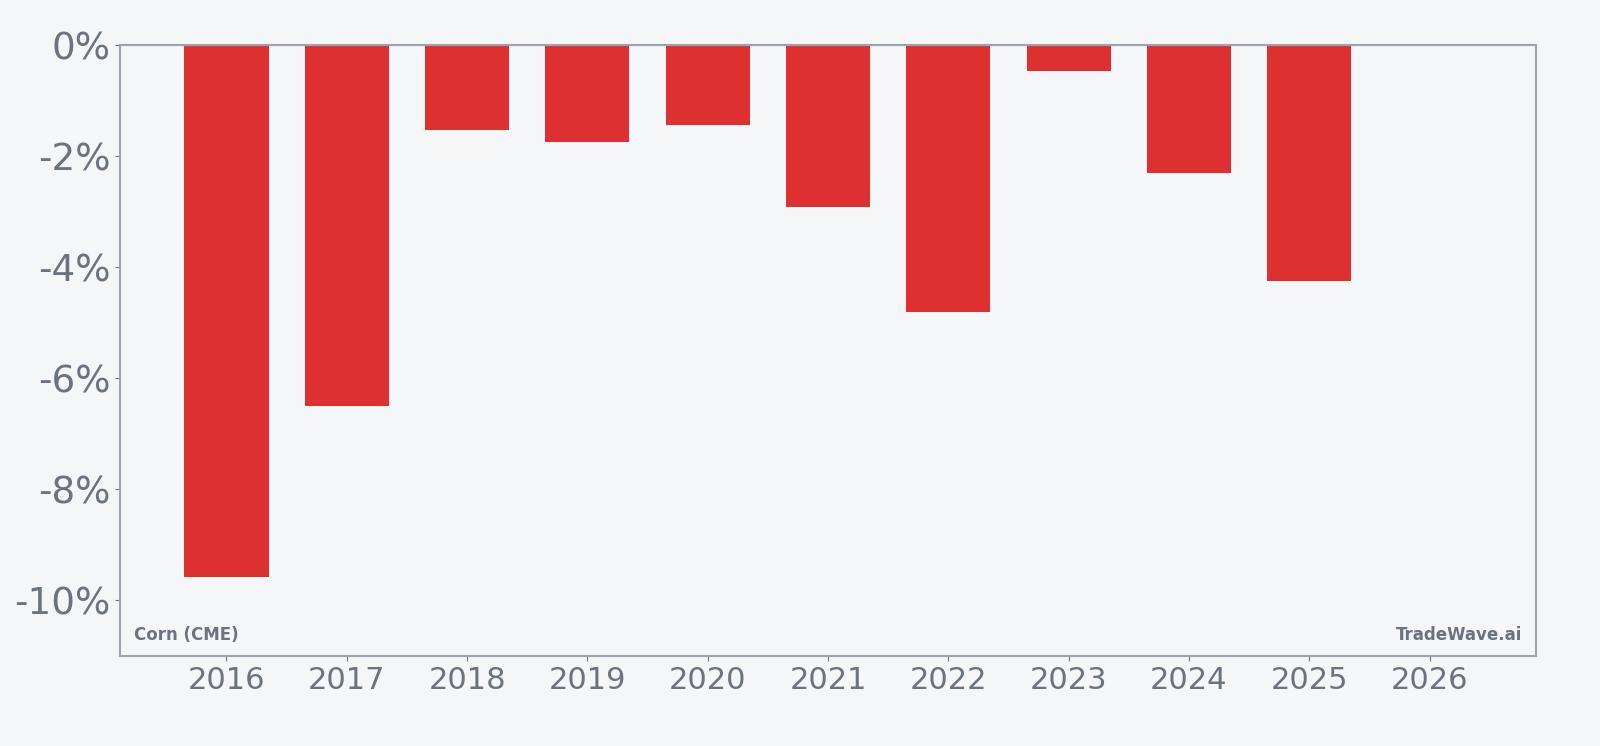
Across the 10-year sample, every iteration of this Corn (CME) trading window has ended with lower prices, consistent with the short trade direction. The strongest year for shorts was 2016, when ZC dropped 9.58% from entry to exit, while the softest outcome was 2018 with a 1.54% decline, still a winner for the pattern. The 41% cumulative return across all ten windows underscores how persistent this historical seasonality has been for bearish exposure.
Intraperiod swings have not been one-way. In 2016, for example, the contract saw a maximum favorable move of 3.06% at one point in the window but also endured a maximum adverse move of 12.17% before finishing sharply lower, illustrating how rallies can squeeze shorts before the pattern reasserts itself. Other years, such as 2017 and 2021, show more modest favorable excursions but still meaningful adverse moves, which fits a profile where corn often chops early in the window before rolling over more decisively.
The historical seasonal average shows the bulk of the short-side gains accruing in the middle of the window rather than on day one. That suggests traders have often seen a brief period of consolidation or even a small uptick before heavier selling pressure emerges, with the pattern tending to flatten out again toward the final days.
Year-by-year net returns and intraperiod swings round out the picture of how consistently this window has favored shorts.
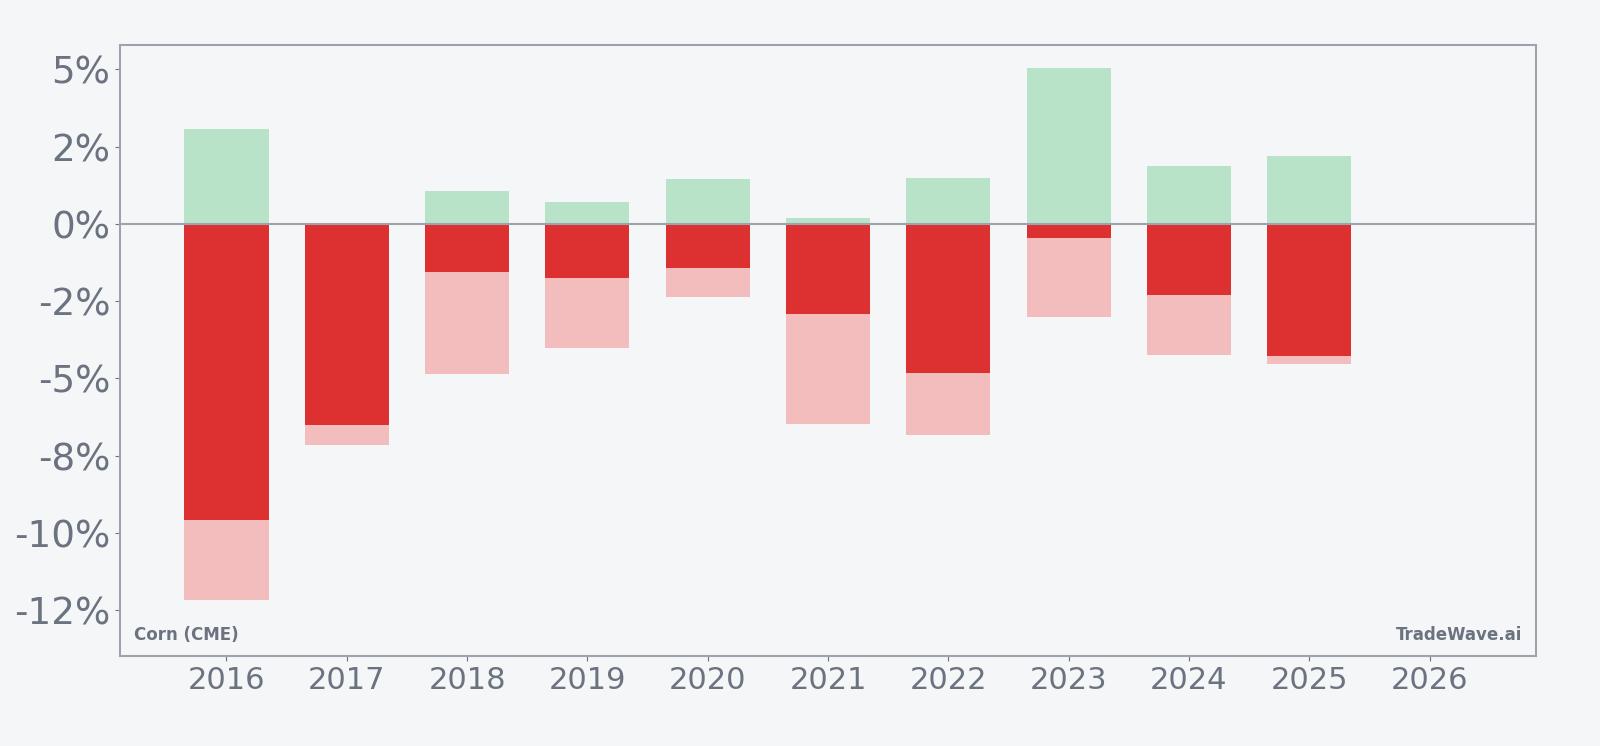
The combined net, best-case and worst-case bars show a pattern of steady short-side wins but with several years where the worst intraperiod drawdown was roughly as large as the final profit. That mix of reliable direction and meaningful volatility is what drives the relatively high TradeWave Ratio and a Sharpe ratio above 1 for this setup.
History does not guarantee future results; adverse excursions can be large even in winning windows, so risk management remains critical.
Why does Corn (CME) (ZC) follow this seasonal pattern?
This mid-June window sits squarely in the U.S. growing season, when weather forecasts, crop condition ratings and early acreage updates can shift supply expectations quickly. One likely driver is that improving weather or confirmation of adequate plantings often reduces fear premiums that built up earlier in the spring, pressuring prices as risk is repriced. Analysts also point to hedging flows from producers and merchandisers around this time, which can add incremental selling pressure and reinforce the historical seasonality.
What is driving Corn (CME) (ZC) today?
Corn (CME) futures settled at 409.75 cents on Friday, down 0.7% on the day and off about 8.58% over the past month, as the contract trades well below its 50-day moving average of 450.275 and on lighter-than-normal volume versus the 20-day average of 256,580 contracts. The market has been digesting a heavier supply backdrop after the USDA raised U.S. corn ending stocks to 2.23 billion bushels in its January World Agricultural Supply and Demand Estimates report, a sizeable increase that added pressure to grain prices.[1]
Weather has also leaned against the bulls. An improved U.S. Corn Belt forecast and early planting progress by late April eased concerns about seeding delays, reducing the urgency for weather-driven risk premiums and contributing to consolidation in corn futures.[1] At the same time, record U.S. corn exports for the 2024-25 marketing year, reported in July 2025, underscored that global demand remains robust even as domestic stocks rebuild, a combination that has kept rallies in check rather than igniting a sustained breakout.[1]
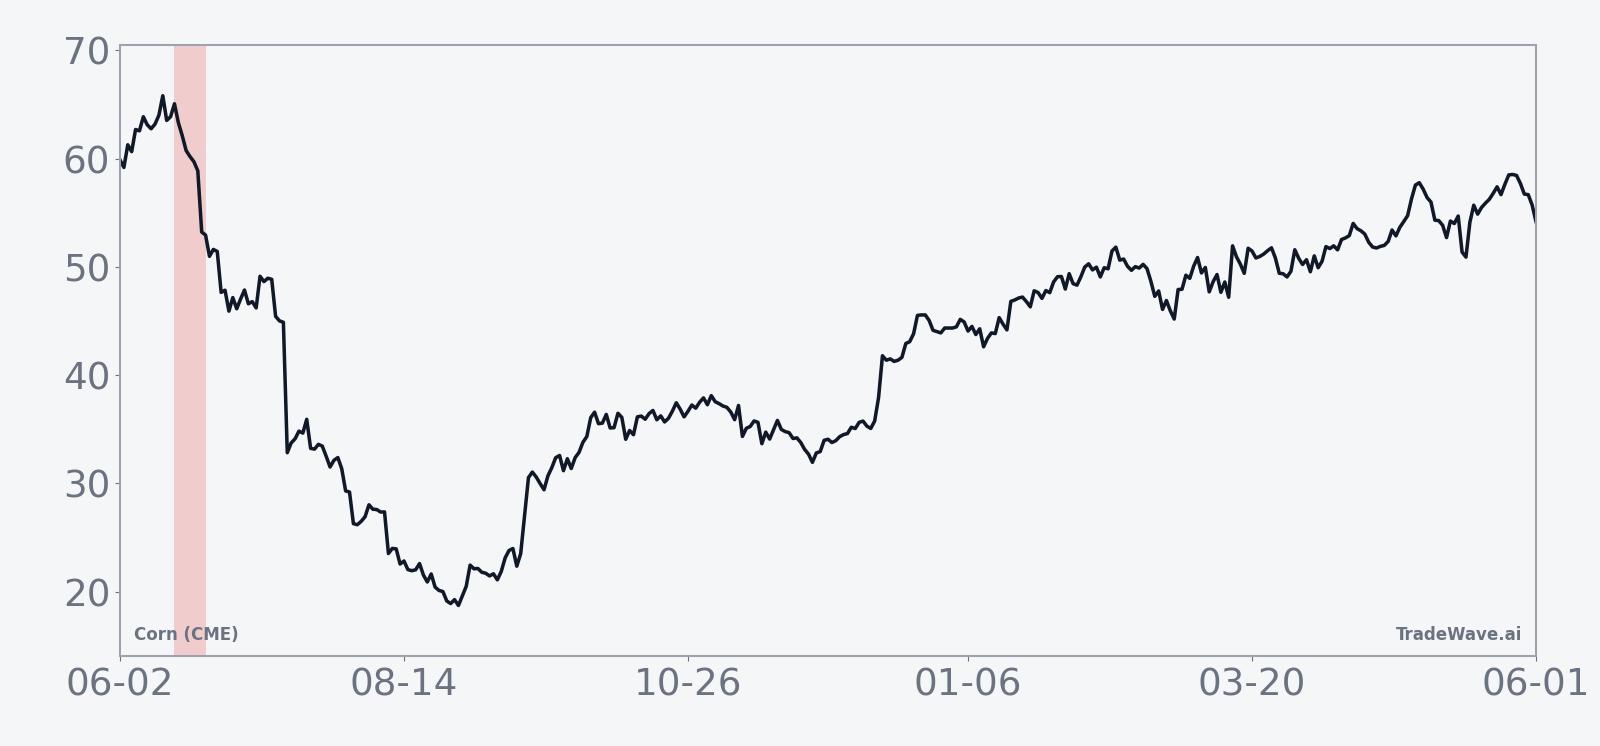
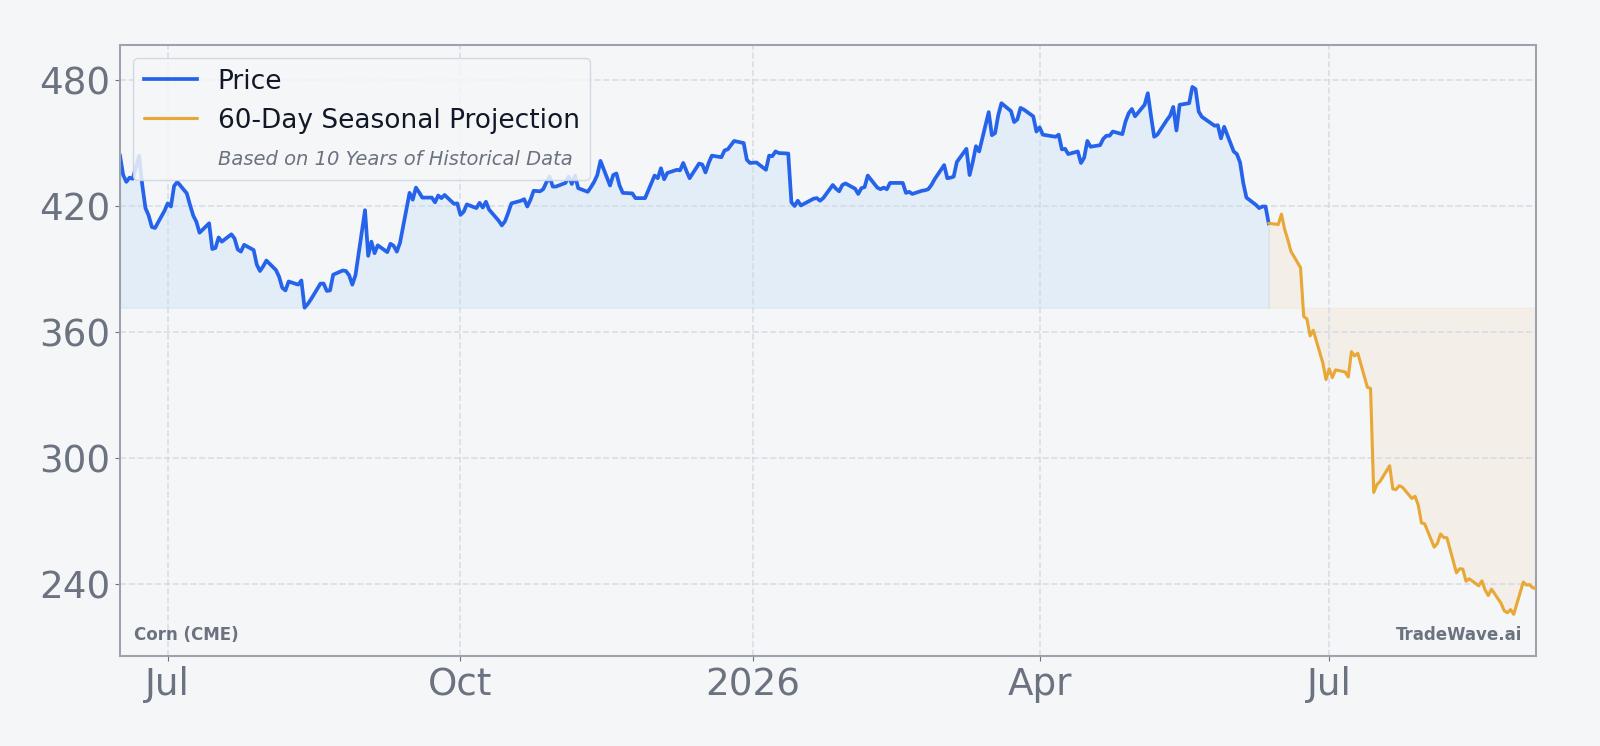
The chart below situates the latest move in its recent multi-month context, alongside a 60-day seasonal projection path.
How do supply, demand and positioning frame this seasonal window?
On the supply side, the higher U.S. ending stocks figure from the USDA points to a more comfortable balance sheet than traders faced a year ago, which can make the market more sensitive to any sign of demand disappointment or yield optimism during this mid-June stretch.[1] At the same time, strong export demand tied in part to biofuel feedstock needs has helped absorb some of that supply, but not enough to prevent prices from sliding back toward the lower half of the recent range.[1]
Positioning data referenced in recent Reuters coverage indicated that commodity funds were net sellers of corn into late April, a shift that often coincides with seasonal weakness as managed money trims exposure ahead of key weather and acreage milestones.[1] If those flows continue into the upcoming window, they could align with the historical pattern of short-side gains, although any surprise weather scare or export shock could quickly force funds to cover.
What should traders watch in this mid-June Corn (CME) window?
For this year’s iteration of the mid-June seasonal pattern, the first thing to watch is how corn behaves around the 400-cent area, which has acted as a rough pivot inside the current 52-week range. A clean break below that zone early in the window would be consistent with the historical tendency for prices to weaken after a brief pause, while a firm bounce back toward the 50-day moving average would mark a clear departure from the usual script.
Macro and fundamental catalysts will matter just as much as the calendar. Any shift in U.S. weather forecasts, fresh USDA updates on crop conditions or revisions to export projections could either reinforce the bearish seasonal bias or overwhelm it. Traders will also be watching whether fund positioning remains net short or begins to flip, since a wave of short covering inside a window that has historically favored shorts would be a notable tell that this cycle is different.
Add it up: if corn grinds lower on modest volume with rallies stalling quickly, the market will be tracking closely with the 10-for-10 historical pattern. If instead prices hold firm or push back toward the upper half of the yearly range on strong demand or weather scares, that would be an early signal that the long-running June seasonal edge for shorts may be fading, at least for this year.
Sources
About this seasonal analysis
Seasonal pattern data is sourced from TradeWave.ai, which analyzes historical price behavior across annual calendar windows going back up to 30 years. Read the full data methodology or the book The 100-Year Pattern by Afshin Moshrefi (2026 edition). Past performance of seasonal patterns does not guarantee future results. This article is for informational purposes only and does not constitute investment advice.