At 98.8¢, Lean Hogs (LH) Hover Near Highs Just as a 100% Bearish June Slide Window Opens
Lean Hogs futures are drifting just below recent highs as a late-June seasonal window that has delivered consistent downside for a decade approaches.
What is the seasonal pattern for Lean Hogs (LH)?
Lean Hogs has fallen in 10 of 10 years during this late-June 26-day window, with an average gain of 14.42% for short positions in winning years.
- 10 for 10 in this window for shorts, with an average profit of 14.42% across winning years.
- Seasonal window runs from Jun 19 for 26 trading days, historically a bearish stretch for Lean Hogs prices.
- Percent Profitable is 100%, with 10 winners and 0 losers for the short trade direction.
- Cumulative return across the decade-long sample is 276% for the short strategy in this specific window.
- TradeWave Ratio of 1.95 signals that price typically travels meaningfully in the trade direction within the window.
- Sharpe ratio of 1.74 points to a historically strong risk-adjusted profile for this recurring Lean Hogs trading window.
According to historical data from TradeWave.ai, this late-June stretch in Lean Hogs has behaved very differently from an average month on the calendar, and the next iteration is about to open again.
How has Lean Hogs (LH) traded in the upcoming late-June window?
Lean Hogs has fallen in every single late-June 26-day window for the past decade, with shorts averaging 14.42% gains as prices slid into mid-July. The front-month contract last settled at 98.8 cents per pound, leaving it below the 52-week high of 113.375 but still well above the 77.125 low that marked the bottom of the past year’s range.
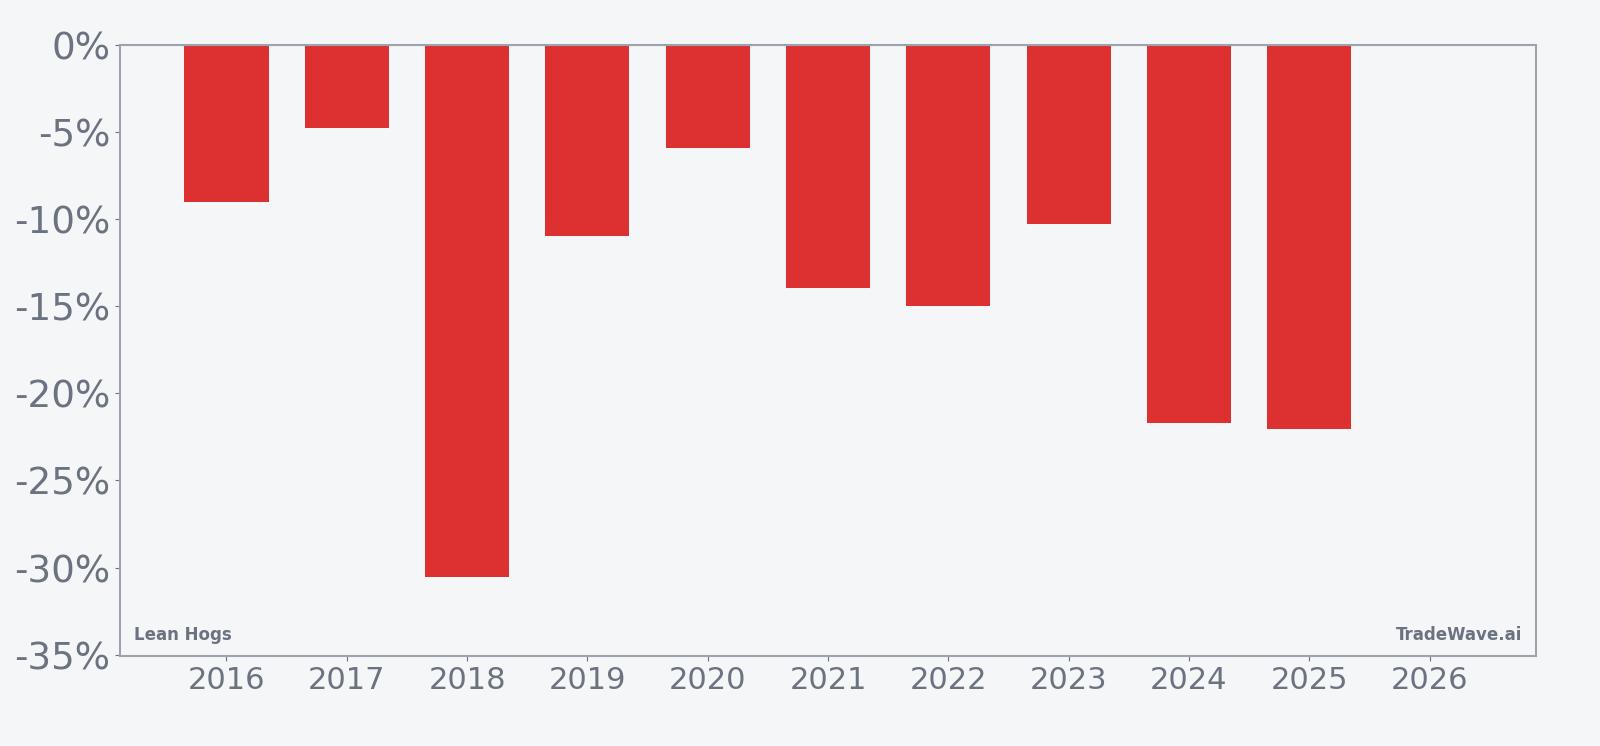
Year-by-year net returns and intraperiod swings show how consistently this window has rewarded shorts while still delivering sizable rallies and drawdowns along the way.
The trade direction for this pattern is explicitly short, and the track record is unusually clean: 10 winners, 0 losers, and a 100% hit rate across the past decade. Average profit of 14.42% for winning years lines up with a 276% cumulative return for the strategy, while the median outcome of 12.45% shows that the big years are not just one-off outliers.
Looking at individual seasons, 2018 and 2024 stand out as the heaviest declines, with net returns of about -30.52% and -21.71% respectively as Lean Hogs broke sharply lower from early summer levels. At the milder end of the spectrum, 2017 and 2020 still delivered short-side gains of -4.77% and -5.92%, which would be respectable outcomes in most commodity trading playbooks.
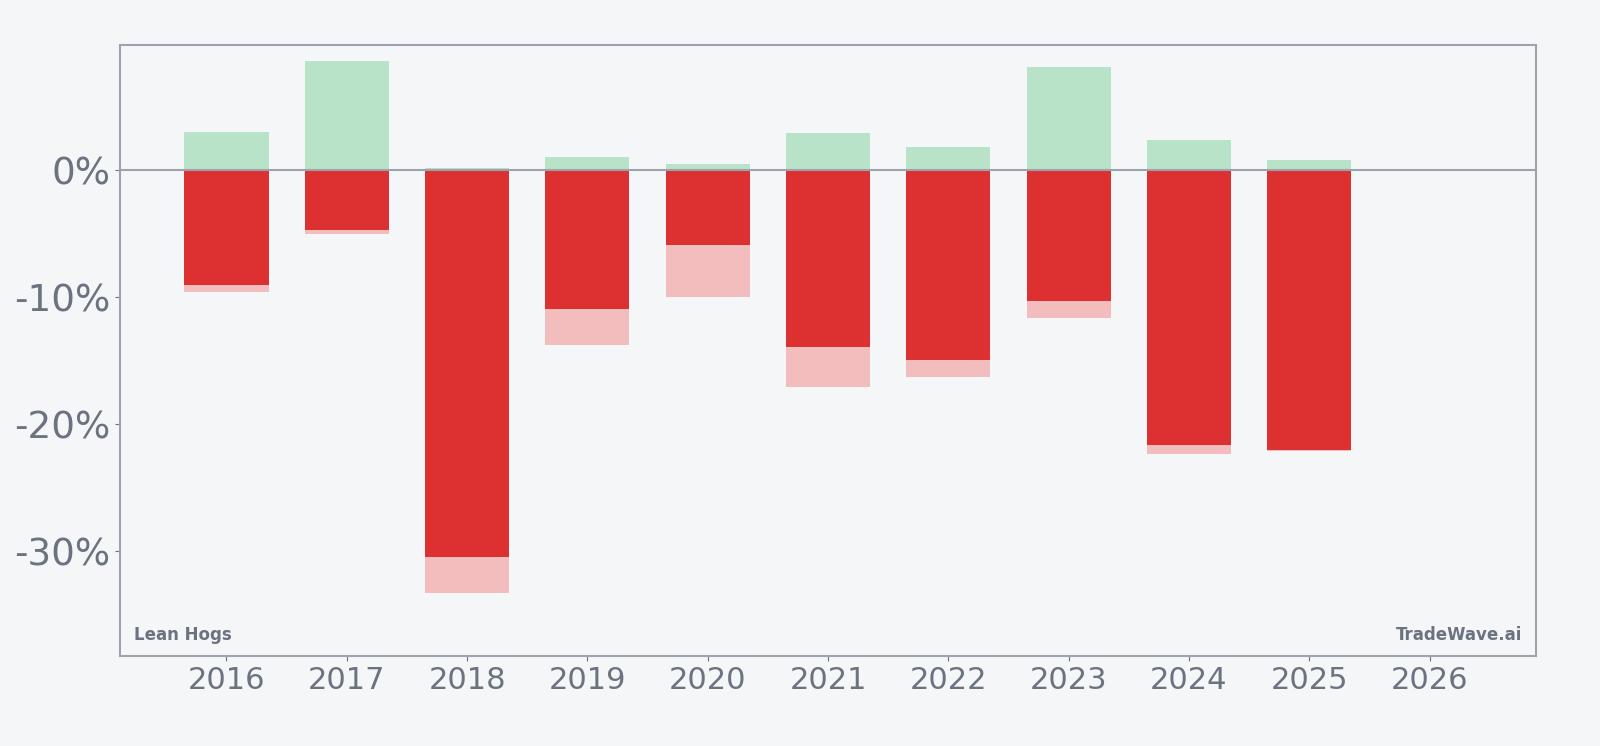
The maximum favorable move, or best intraperiod run in the trade direction, has often been large even when the final net result was more modest. In 2017 and 2023, for example, Lean Hogs saw peak favorable excursions of 8.55% and 8.1% during the window, giving shorts meaningful room to manage exits even as the final closes were less dramatic. That is what the TradeWave Ratio of 1.95 is capturing: how far price typically travels in the trade direction within the window, independent of where it finishes.
The maximum adverse move, or worst drawdown from entry, has also been significant in several years, underscoring that this is not a one-way street. In 2018, the worst intraperiod move against the short was -33.32%, and in 2024 it was -22.36%, meaning that even in winning years, traders had to sit through sharp countertrend rallies before the seasonal pattern reasserted itself. The bars chart that stacks net results with these best and worst excursions makes clear that this window has historically combined strong directional bias with real volatility.
The 10-year average seasonal trend chart shows that, on average, the bulk of the downside has tended to accrue after the first week of the window, with prices often chopping early before sliding more decisively into the back half. That timing nuance matters for risk management: the pattern has not been a straight line lower from day one, but rather a sequence where patience has historically been rewarded for traders aligned with the short bias.
Put simply, this is one of the cleaner short-side seasonal patterns in the Lean Hogs complex: every year in the sample has seen prices lower by the end of the 26-day stretch, and several years have delivered deep double-digit declines.
History does not guarantee future results, and the worst intraperiod drawdowns in this window have been large enough that even winning years would have been painful for poorly risk-managed positions.
Why does Lean Hogs (LH) follow this seasonal pattern?
This late-June Lean Hogs seasonal pattern likely reflects commodity supply and demand seasonality more than technical quirks. Analysts often point to the transition from spring demand into the heart of grilling season, when slaughter numbers, carcass weights, and export flows can shift quickly as packers adjust to summer buying patterns. The recurring window of weakness may capture a period when forward demand is already priced in, but supply continues to build, pressuring futures as the market digests updated hog inventory and production data.
What is driving Lean Hogs (LH) today?
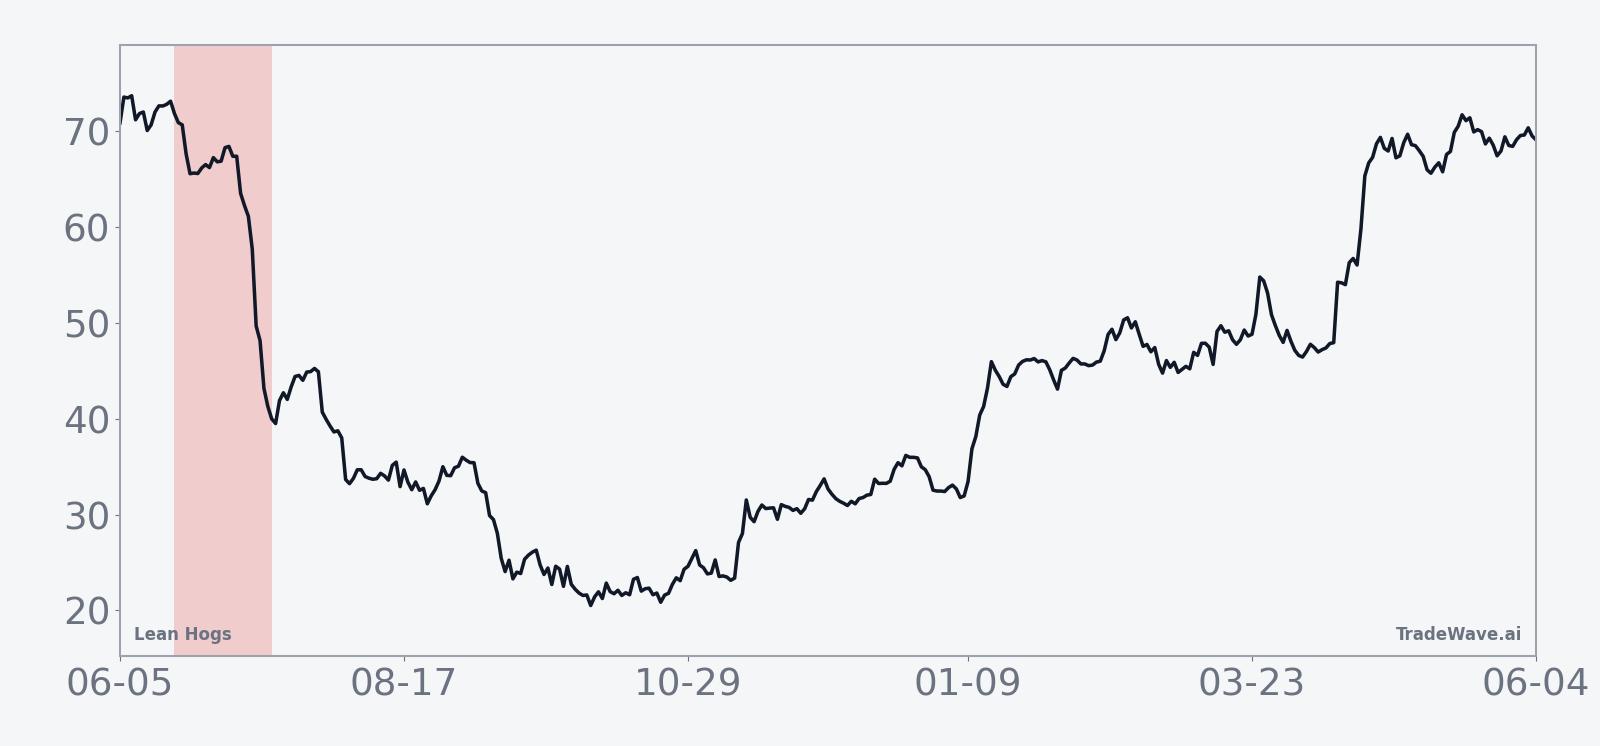
With the front-month Lean Hogs contract last marked at 98.8 cents per pound, the market sits between its 52-week extremes after a modest -0.9% pullback over the past month. The 50-day moving average around 97.26 cents and 20-day average volume near 17,618 contracts suggest a market that is active but not overheated, as traders balance softer recent price action against still-elevated levels compared with last year’s 77.125-cent low.
The chart below situates the latest move in its recent multi-month context alongside a 60-day seasonal projection.
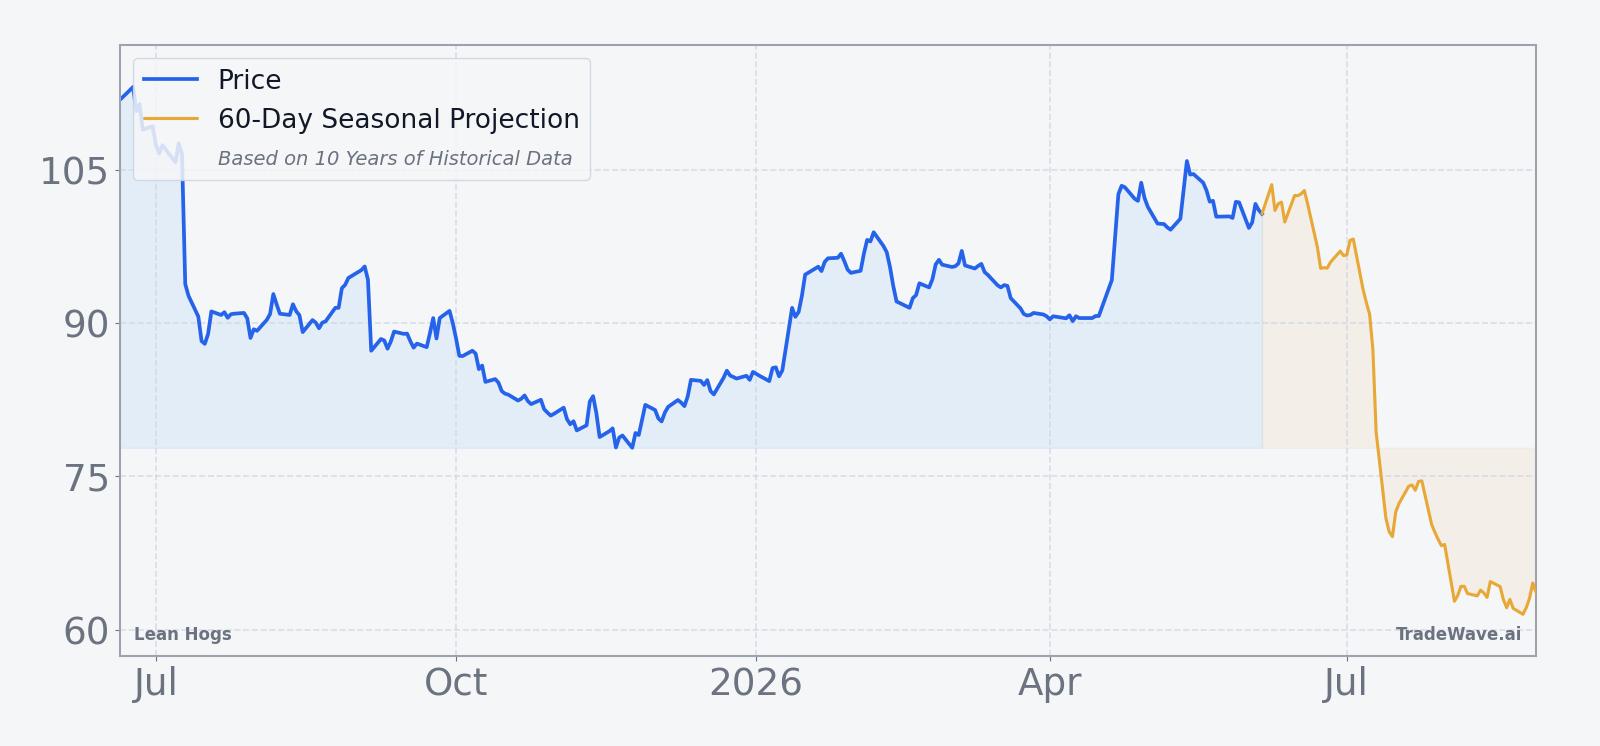
Macro drivers for hogs are always intertwined with the broader protein complex, feed costs, and the dollar, but the standout feature on this calendar is the looming seasonal window itself. With the pattern set to begin on Jun 19 and run for 26 trading days, traders in Chicago and beyond are already weighing how much of the historical late-June softness is reflected in current prices and how much room remains if the pattern repeats.
What should traders watch as this Lean Hogs window opens?
As the Jun 19 start date approaches, the first thing to watch is how Lean Hogs behaves around the 100-cent area, which has acted as a rough pivot in recent months. A failure to hold above the 50-day moving average near 97.26 cents would fit the historical pattern of early-window choppiness that eventually resolves lower, while a decisive break higher would test the durability of the decade-long seasonal trend.
On the fundamental side, upcoming hog inventory updates, slaughter pace data, and export sales reports will be critical for gauging whether supply is building faster than demand into mid-summer. If packer margins compress and carcass weights stay heavy, that would align with prior years when the late-June window coincided with pressure on futures as the market repriced forward supply.
Volatility inside the window will also matter. Historically, maximum adverse excursions have been large even in winning years, so traders will be watching whether early countertrend rallies repeat or whether the market breaks more cleanly this time. A smoother path lower with smaller intraperiod spikes would mark a departure from the jagged profile seen in 2018, 2021, 2024, and 2025, when shorts had to weather double-digit rallies before the seasonal weakness reasserted itself.
Finally, watch how volume behaves as the window opens. A pickup in activity around the Jun 19 date, especially if it coincides with a turn lower from near the recent highs, would suggest that more participants are leaning into the historical seasonality. If instead volume fades and price grinds sideways, it would be an early sign that this year’s Lean Hogs seasonal pattern may diverge from the clean 10-for-10 record that has defined the past decade.
Sources
About this seasonal analysis
Seasonal pattern data is sourced from TradeWave.ai, which analyzes historical price behavior across annual calendar windows going back up to 30 years. Read the full data methodology or the book The 100-Year Pattern by Afshin Moshrefi (2026 edition). Past performance of seasonal patterns does not guarantee future results. This article is for informational purposes only and does not constitute investment advice.