14-of-15 Summer Losses: Lean Hogs (HE) Near Highs as 60-Day Weak Window Opens
Lean Hogs futures are trading near recent highs just as a historically bearish 60-day summer window approaches, raising the stakes for producers and speculators watching seasonal pressure on prices.
What is the seasonal pattern for Lean Hogs (HE)?
Lean Hogs has fallen in 14 of 15 years during this June 18 to mid-August window, with an average 19.52% gain in winning short years.
- 14-for-15 record for short positions in this 60-day window, with 93% profitable years and only 1 losing year.
- Seasonal window runs from Jun 18 for 60 trading days, a stretch that has historically favored downside in Lean Hogs futures.
- Percent Profitable is 93%, with 14 winners and 1 loser for the short-side pattern across the 15-year lookback.
- Average profit in winning years is 19.52%, while Avg Profit - All years, including the lone loss, is still a strong 18%.
- TradeWave Ratio of 2.61 signals that price has typically traveled meaningfully in the short direction within the window.
- Sharpe ratio of 1.77 points to unusually strong risk-adjusted returns for this specific Lean Hogs trading window.
According to historical data from TradeWave.ai, this early-summer stretch in Lean Hogs has behaved very differently from an average month on the calendar, and the next iteration is about to open again.
How has Lean Hogs (HE) traded in this June–August seasonal window?
Lean Hogs has delivered profitable short-side trades in 14 of the past 15 years during the 60 trading days starting Jun 18, with winning years averaging 19.52% gains for shorts. The upcoming window again runs from Jun 18 into mid-August, a period when hog prices have often rolled over even after strong spring rallies. For hedgers and speculators, that track record makes this one of the most closely watched seasonal patterns on the livestock calendar.
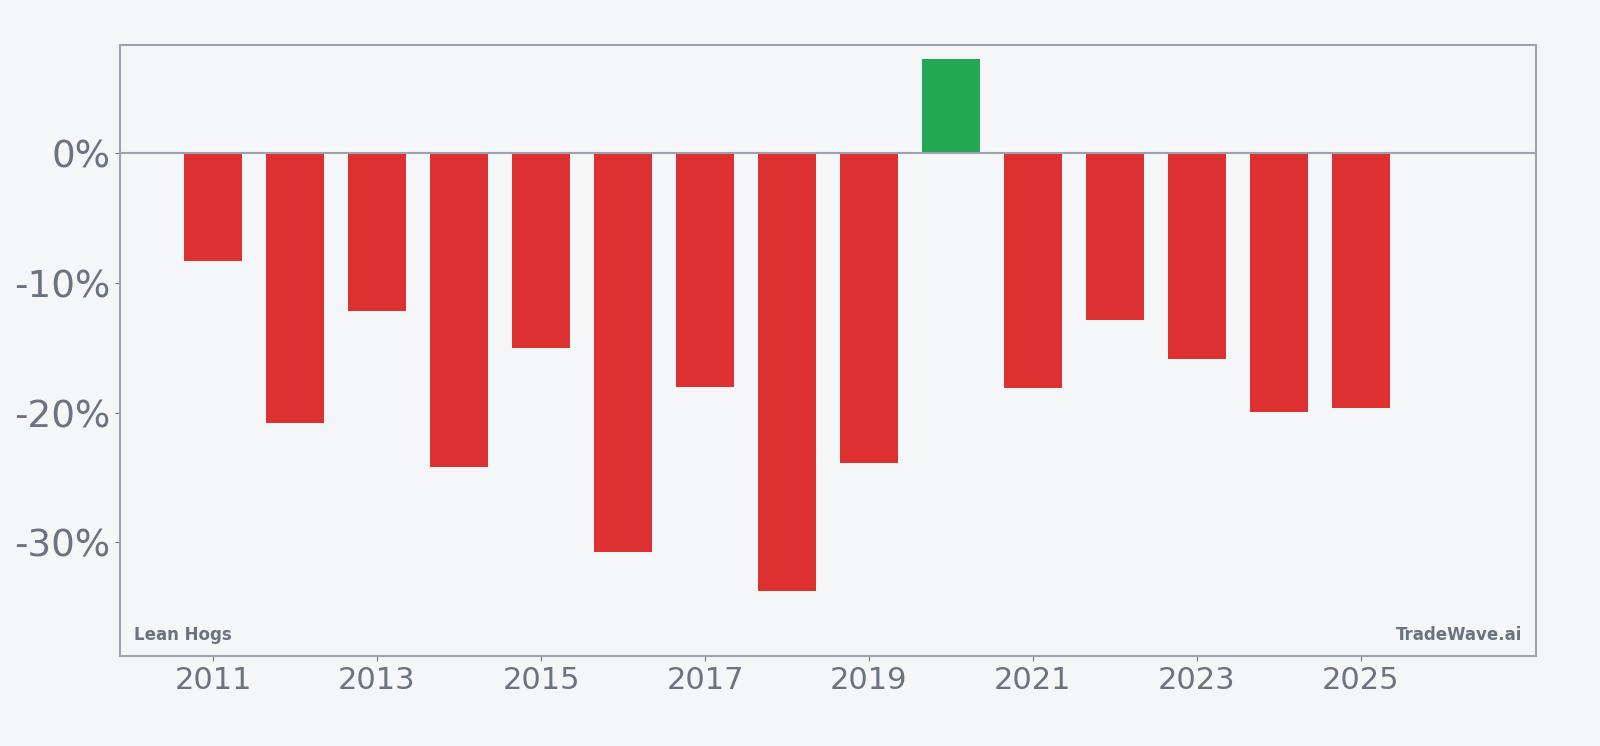
Across the 15-year sample, the pattern is clearly aligned with the short direction. Percent Profitable sits at 93%, with 14 winning short years and just 1 losing year, and the all-years average outcome is an 18% gain for shorts despite that lone outlier. The strongest years for the pattern include 2018, when a short entered around 83.72 and exited near 55.48 for a 33.73% net return, and 2016, which saw a 30.75% decline from an 86.42 entry to a 59.85 exit. The weakest year for shorts was 2020, when prices rose from 49.9 to 53.52 and produced a 7.25% loss for the pattern.
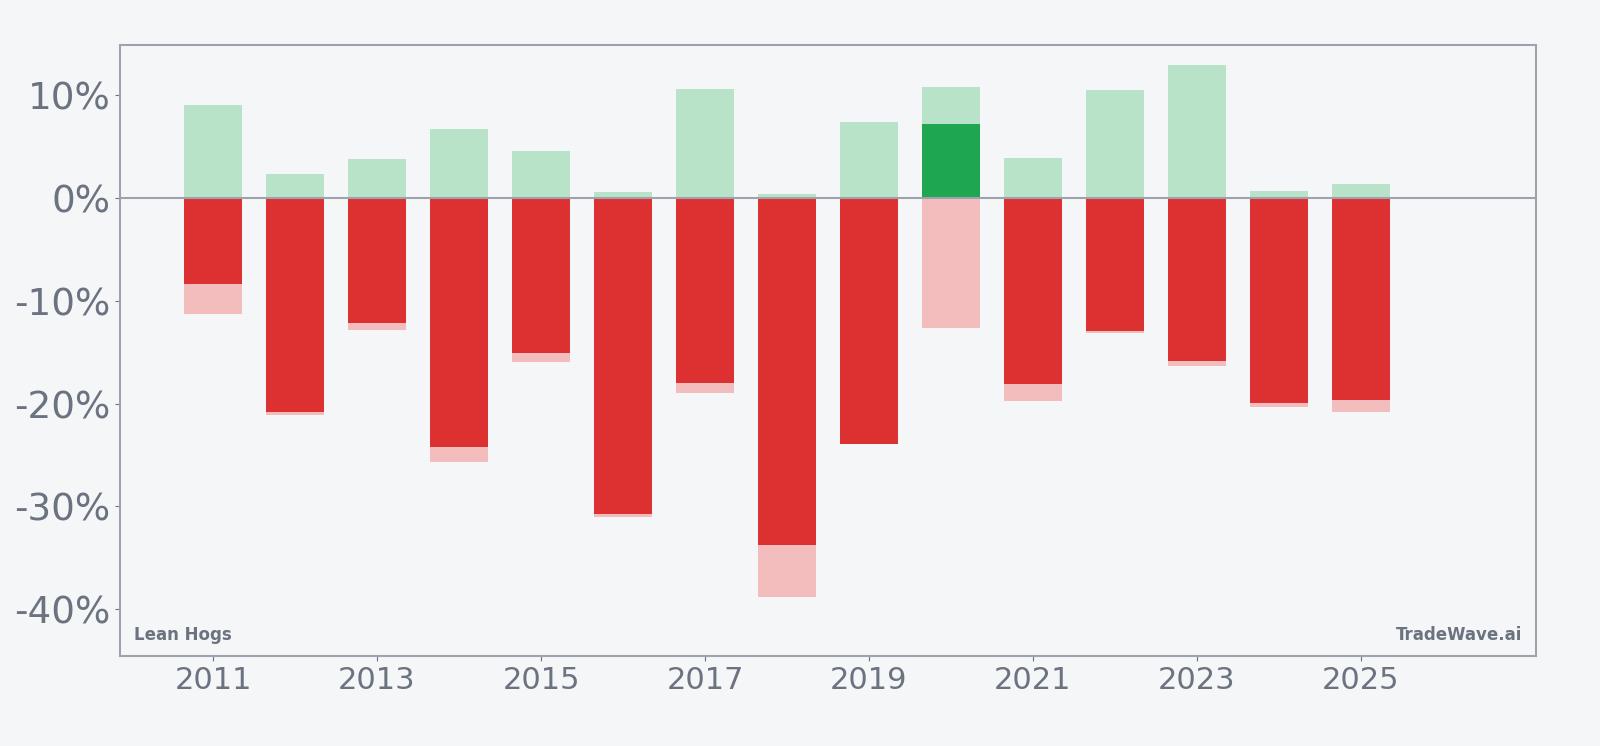
Intraperiod swings have been large. In 2018, the maximum adverse move against the short position reached about 38.78% at one point before the contract ultimately finished sharply lower, while the maximum favorable move was modest at 0.43%. In contrast, 2017 saw a 10.64% best run in favor of shorts and a 19.01% worst drawdown from entry, underscoring that even successful years have featured meaningful countertrend rallies. MFE and MAE, the best and worst excursions from the entry price within the window, show that this is not a slow grind but a volatile stretch where both squeezes and breakdowns can develop quickly.
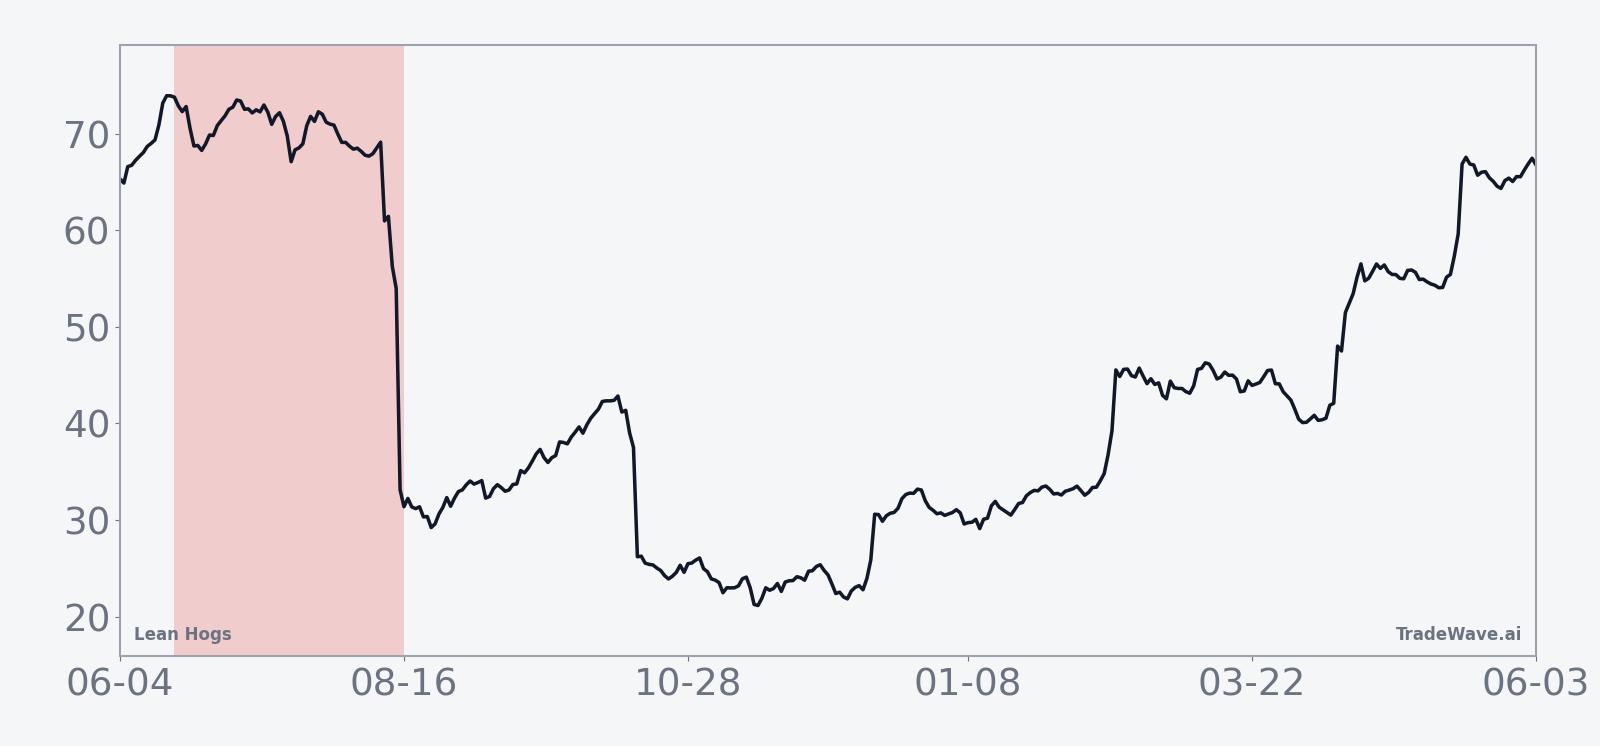
The time profile of returns also matters. The 15-year seasonal trend line for this window slopes steadily lower, with much of the average decline accruing in the middle third of the period rather than in the opening days. That suggests shorts have historically seen more follow-through once the window is underway, rather than an immediate collapse right after Jun 18. The cumulative return chart, which stacks each year’s outcome, shows a persistent downward staircase rather than a choppy sideways band, consistent with the 1,002% cumulative return figure for the pattern.
Year-by-year net returns and intraperiod swings round out the picture of how this window has behaved.
Put together, the pattern is striking: this early-summer window has overwhelmingly favored short positions in Lean Hogs, with only one year in fifteen bucking the trend.
Why does Lean Hogs (HE) follow this seasonal pattern?
One likely driver is the supply and demand rhythm of the U.S. hog market, where heavier summer slaughter runs and carcass weights often collide with softer demand after the early grilling season. Analysts have also pointed to producer hedging and packer margin management in mid-year as forces that can pressure futures even when spot fundamentals look firm. This seasonal pattern may reflect that combination of rising supply, shifting consumer demand, and risk management flows that tend to peak between late June and August.
History does not guarantee future results; adverse excursions can be large even in winning windows, and traders should size positions with that volatility in mind.
What is driving Lean Hogs (HE) today?
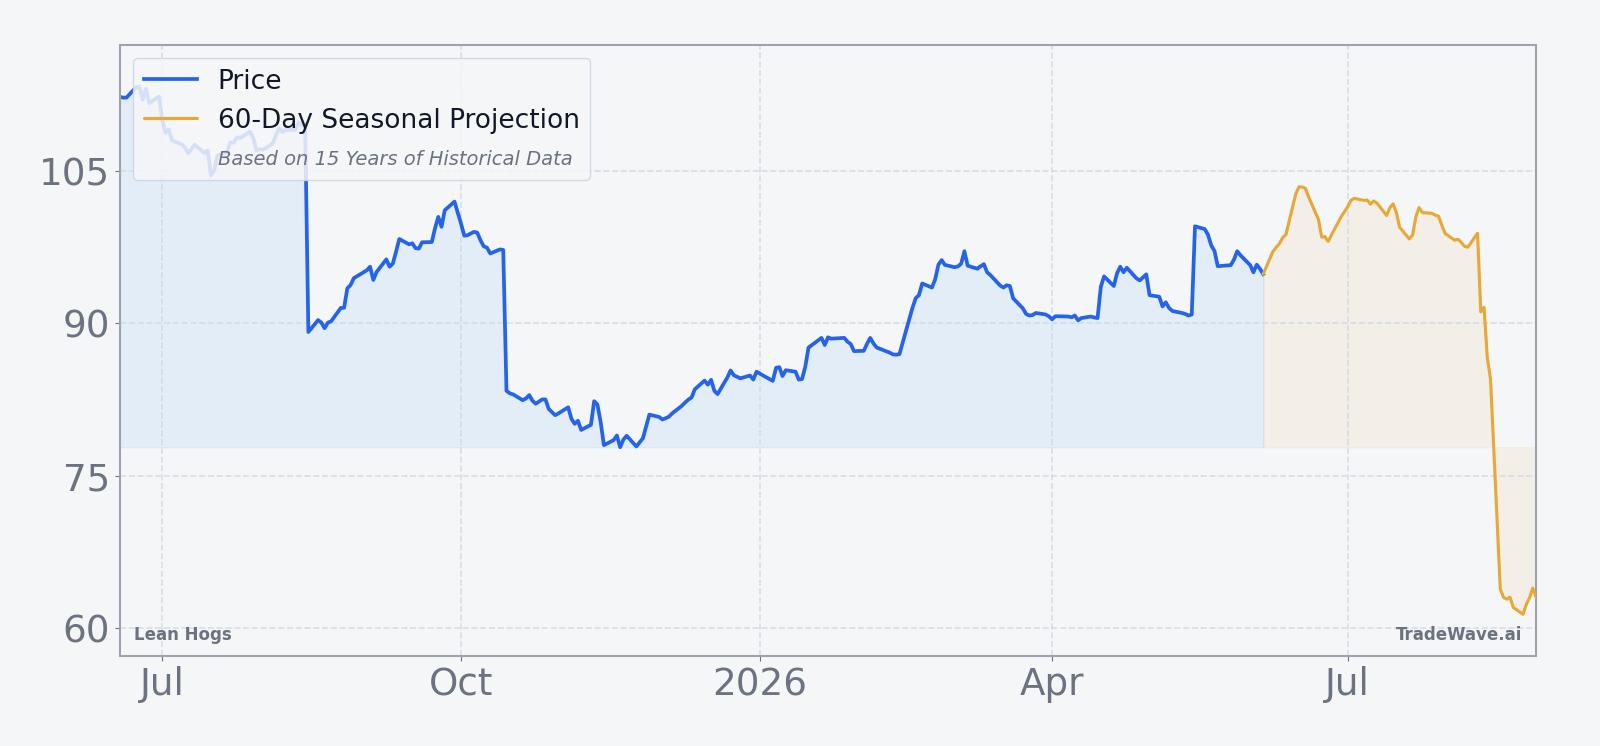
Lean Hogs futures last settled at 94.3, leaving the contract below its 52-week high of 113.7 but well above the 77.35 low, with a 3.06% gain over the past month and prices hovering just over the 50-day moving average of 93.355. That backdrop suggests a market that has recovered from winter weakness and is trading in the upper half of its one-year range as the key June 18 seasonal window approaches. With no major fresh macro or sector-specific headlines in the hog complex, positioning around expected summer supply, slaughter schedules, and export demand is likely to dominate flows as traders weigh whether this year will again follow the historical seasonal trend.
The chart below situates the latest move in its recent multi-month context and overlays the upcoming 60-day seasonal projection.
What should traders watch as this Lean Hogs seasonal window opens?
First, watch how Lean Hogs behaves around the 94 to 100 band as the window begins; in prior years, sustained trade below the 50-day moving average has often preceded deeper summer declines. Second, monitor weekly slaughter and carcass weight data for signs that supply is building faster than demand, which would align with the historical pattern of mid-summer price pressure. Third, keep an eye on export bookings and any shifts in feed costs or currency moves that could alter packer margins and hedging appetite. Finally, if prices instead hold firm or push back toward the 113.7 high during the window, that would be an early sign that 2026 could be one of the rare years that diverges from the long-running HE seasonal trend.
Sources
About this seasonal analysis
Seasonal pattern data is sourced from TradeWave.ai, which analyzes historical price behavior across annual calendar windows going back up to 30 years. Read the full data methodology or the book The 100-Year Pattern by Afshin Moshrefi (2026 edition). Past performance of seasonal patterns does not guarantee future results. This article is for informational purposes only and does not constitute investment advice.