Lean Hogs (LH) Enters 26-Day Window After 10 Straight Seasonal Declines
Lean Hogs is entering a 26-day early-summer stretch that has delivered consistent downside over the past decade, putting a sharp seasonal pattern in focus for livestock traders.
What is the seasonal pattern for Lean Hogs (LH)?
Lean Hogs has fallen in 10 of 10 years during this late-June 26-day window, with an average gain of 14.42% for short positions in winning years.
- 10 for 10 in this window, with short trades averaging 14.42% gains over the past decade.
- The 26-day Lean Hogs trading window begins on Jun 19 and has historically favored downside moves.
- Percent Profitable is 100%, with 10 winners and 0 losers for the short-side seasonal pattern.
- Cumulative return for the strategy across the 10-year lookback is 276%, with a Sharpe ratio of 1.74.
- The TradeWave Ratio of 1.95 signals that price has typically traveled meaningfully in the trade direction within the window.
- Intraperiod swings have been large, with some years showing deep adverse moves before the decline reasserted itself.
According to historical data from TradeWave.ai, this early-summer stretch in Lean Hogs has behaved very differently from an average month on the calendar, and the next iteration of that pattern is now underway.
How has Lean Hogs (LH) traded in this early-summer seasonal window?
Lean Hogs has declined in every single late-June 26-day window for the past 10 years, with short positions averaging 14.42% gains and a 276% cumulative return across the decade. The new window starts today, with front-month futures recently trading below a 52-week high of 113.375 and above a 52-week low of 77.125, leaving plenty of room on either side of the recent range. That combination of a clean, decade-long seasonal trend and a mid-range price zone is why this particular Lean Hogs trading window is on so many livestock desks this week.
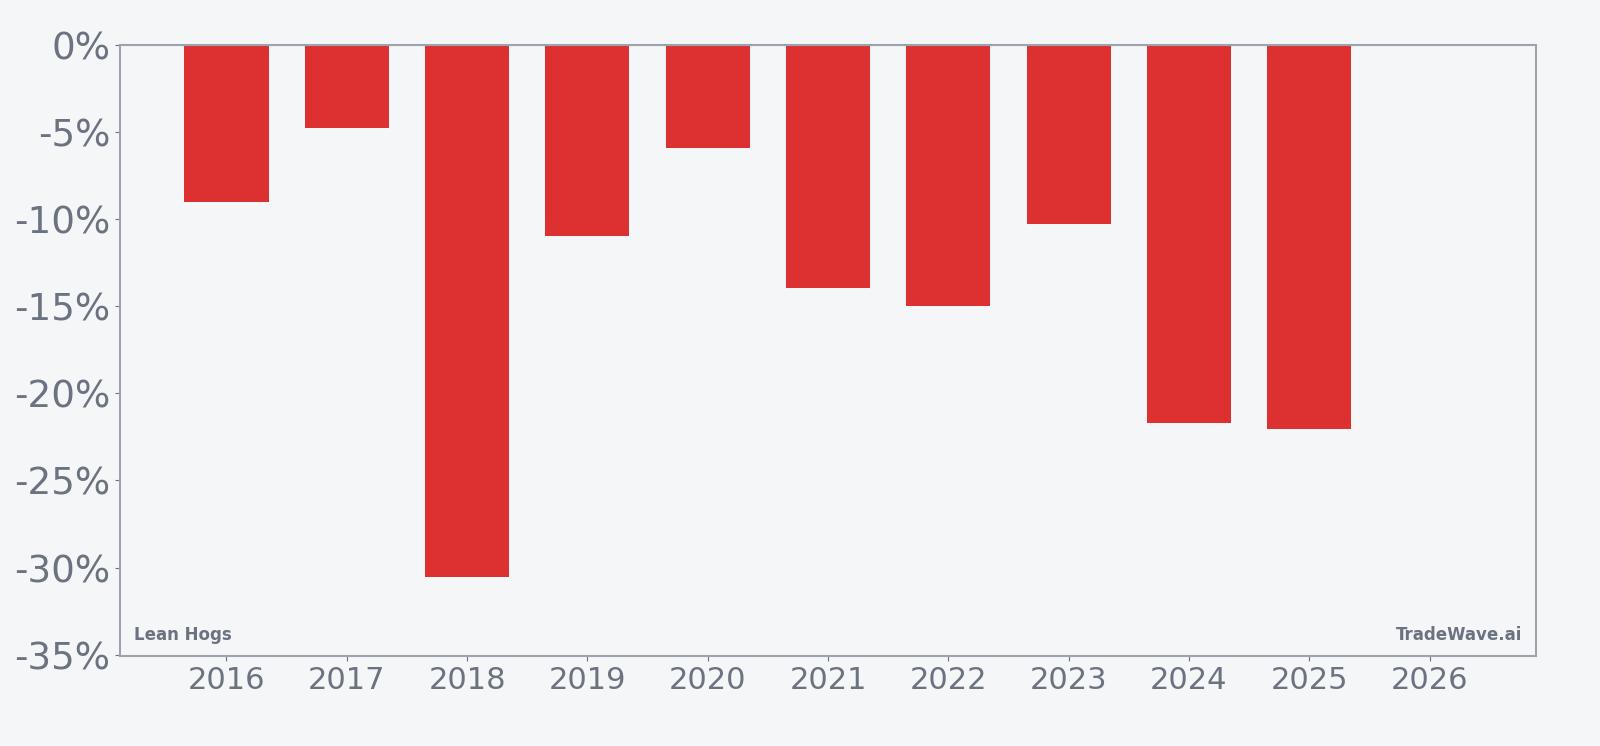
Across the 10-year lookback, every iteration of this Lean Hogs seasonal pattern has produced a negative net return for the underlying contract, which is a winning outcome for the short trade direction. The weakest year for hogs in this window was 2018, when prices fell 30.52% from an entry near 77.725 to an exit around 54.0, while the “mildest” decline still saw a 4.77% drop in 2017. Even the more moderate years such as 2016 and 2019 delivered net declines of 9.05% and 10.96% respectively, reinforcing how consistently this early-summer stretch has leaned lower.
The volatility profile inside the window has been just as striking as the final outcomes. Maximum favorable moves for the short side have often been large, with years like 2018 and 2024 showing peak drawdowns from entry of roughly 33.32% and 22.36% before the window closed. At the same time, maximum adverse moves against shorts have generally been contained to single digits in most years, with brief rallies of 2% to 8% that faded as the seasonal pressure reasserted itself. That mix of sizable downside excursions and relatively modest squeezes is what underpins the 1.95 TradeWave Ratio and the 1.74 Sharpe ratio for this pattern.
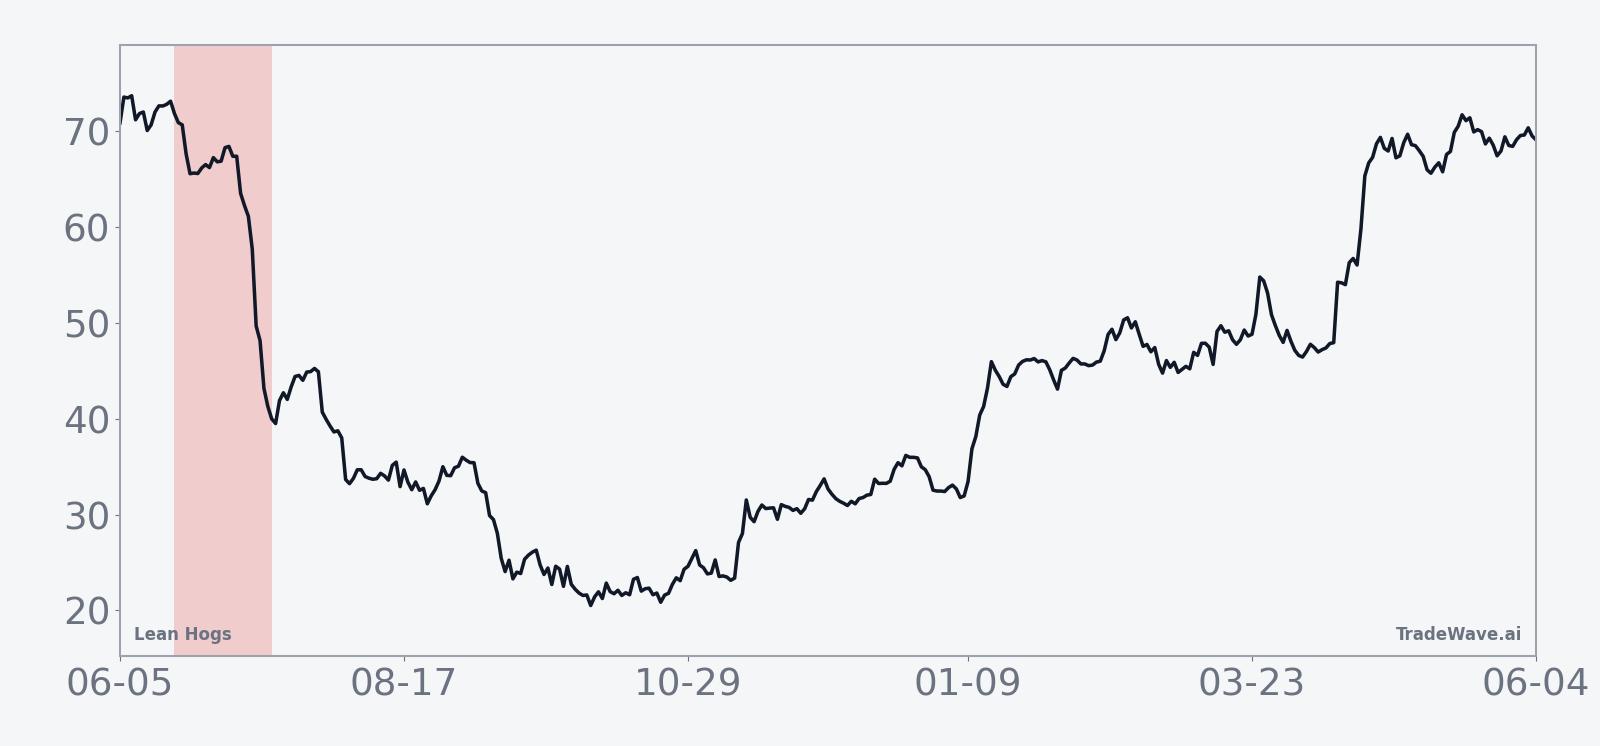
The 10-year seasonal trend chart shows that most of the typical decline clusters in the middle of the window rather than at the very start. On average, Lean Hogs has tended to chop sideways for a few sessions, then accelerate lower into the back half of the period before stabilizing near the exit date. That shape matters for traders who are sensitive to timing, because it suggests that patience inside the window has historically been rewarded more than trying to front-run the move on day one.
Year-by-year bars with intraperiod swings show how consistently the window has favored shorts while still delivering meaningful rallies along the way.
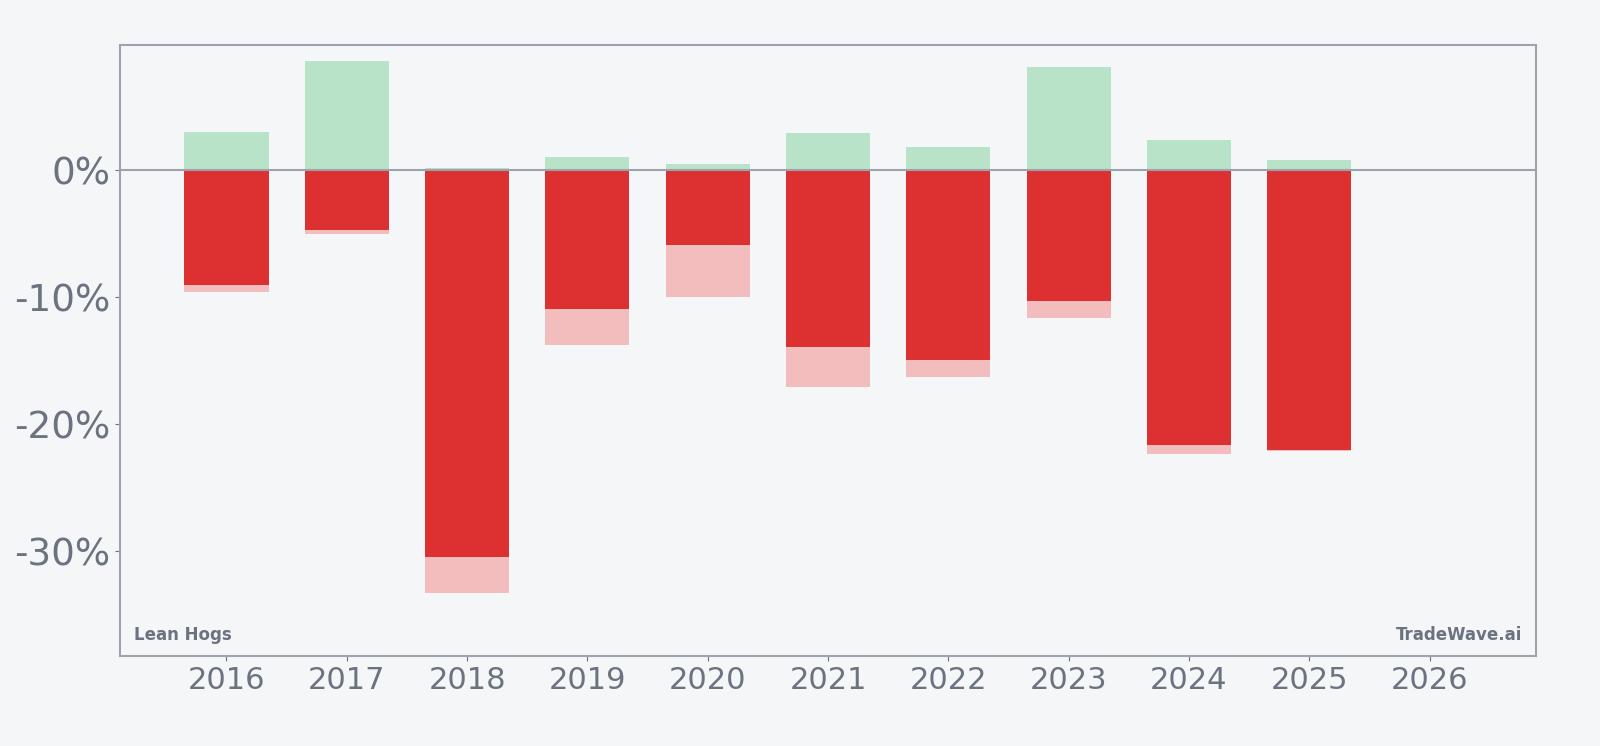
The combined net, maximum favorable, and maximum adverse excursion bars make clear that this is not a quiet window even when the final direction is one-sided. Several years, including 2017 and 2023, saw intraperiod rallies of more than 8% against the short before the decline resumed, while 2018 and 2025 delivered deep, almost straight-line drops with limited countertrend bounces. For traders, the message is simple: the historical edge has been on the downside, but the path has often involved sharp, tradeable swings in both directions.
History does not guarantee future results; adverse excursions can be large even in winning windows, and Lean Hogs has a track record of sharp intraday and intraperiod reversals.
Why does Lean Hogs (LH) follow this seasonal pattern?
One likely driver is the way hog supply and demand tighten and loosen around early-summer slaughter schedules and grilling-season demand. Analysts often point to the lag between when producers lock in feed and herd decisions and when those animals actually reach market, which can create predictable pressure points in futures pricing. This pattern may also reflect how packers and large end-users hedge carcass exposure ahead of midsummer demand, leaning on the market in a way that has historically lined up with this late-June window.
What is driving Lean Hogs (LH) today?
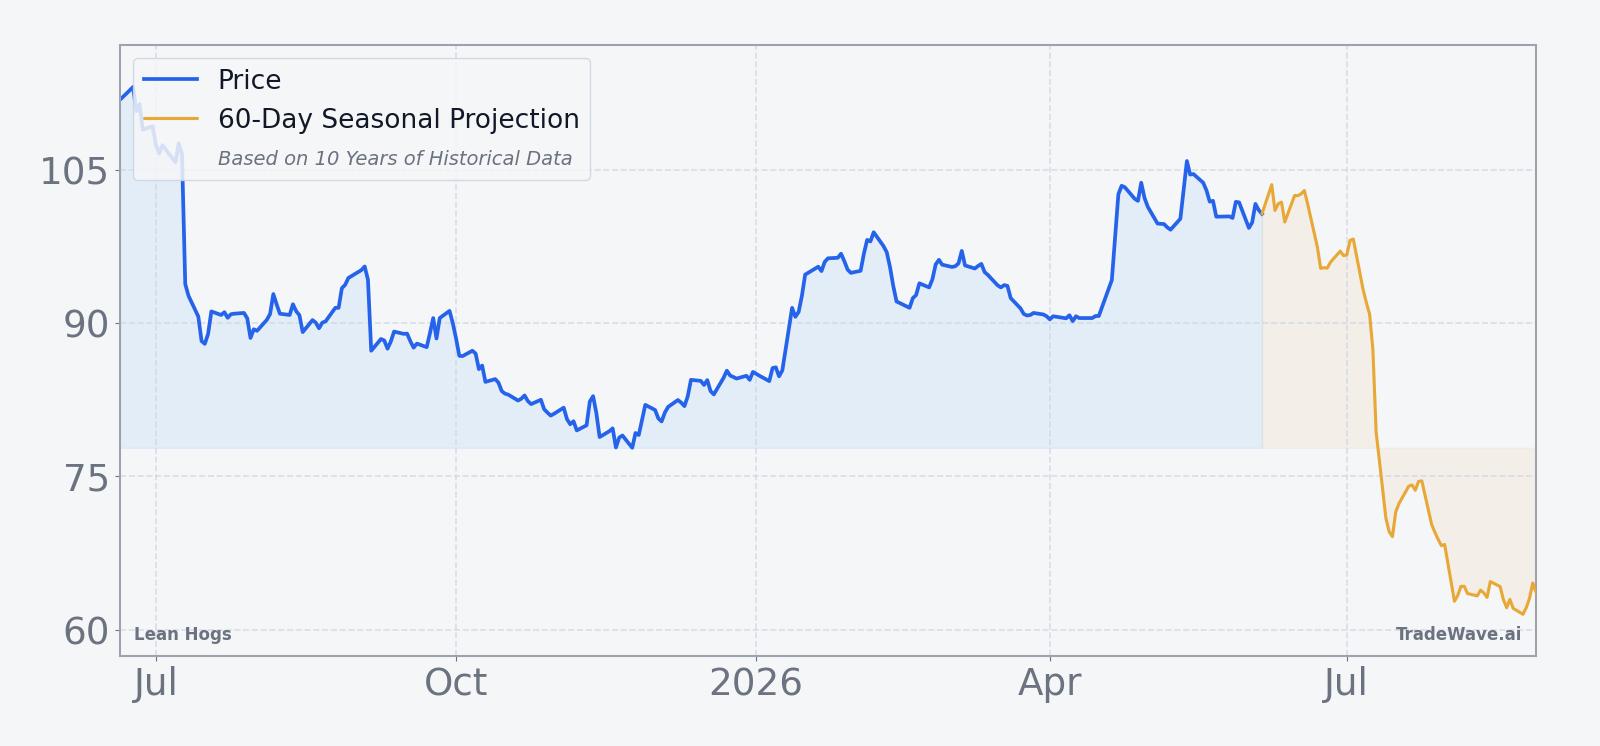
Front-month Lean Hogs futures settled most recently at 96.5, leaving the contract below its 50-day moving average of 98.1045 and well off the 52-week high of 113.375 while still comfortably above the 77.125 low. That puts prices in a broad mid-range band as the new seasonal window opens, with traders weighing softer one-month performance of about -5.53% against the possibility of further downside if the historical pattern reasserts itself. With no single fresh macro or demand shock dominating the tape, positioning and seasonal flows are likely to matter more than usual as the market tests how much of the decade-long early-summer weakness is already priced in.
The chart below situates the latest move in its recent multi-month context and overlays the next 60 days of seasonal tendencies.
What should traders watch in this Lean Hogs seasonal window?
For the next 26 trading days, the key question is whether Lean Hogs respects or breaks a 10-for-10 record of early-summer declines. Price action relative to the 50-day moving average near 98.10 will be important: sustained trade below that level would fit the historical seasonal trend, while a decisive push back above it would be an early sign that this year may diverge from the pattern. Intraperiod rallies of 5% to 8% have been common even in winning short years, so how the market behaves on those bounces will help confirm whether sellers still control the tape.
Macro and supply-demand catalysts will also shape how this window plays out. Any surprise shifts in slaughter pace, carcass weights, or export demand could either reinforce the seasonal downside or blunt it by tightening the balance sheet. Traders will be watching weekly USDA data, packer margins, and feed-cost signals from corn and soybean meal for clues about whether producers are likely to pull back or push more animals to market. If those reports line up with the historical pattern, volatility could pick up quickly as systematic and discretionary players lean into the seasonal trend.
Finally, intraday volatility and liquidity conditions deserve close attention. The historical MFE and MAE profile shows that even in years where the window ultimately rewarded shorts, Lean Hogs often staged sharp countertrend spikes before rolling over. If this year’s window again features early squeezes that fail near resistance and then give way to heavier selling, it would be a textbook replay of the past decade’s behavior. A clean break of that script, with shallow pullbacks and persistent strength instead, would be the clearest sign that this particular Lean Hogs seasonal pattern is starting to lose its grip.
Sources
About this seasonal analysis
Seasonal pattern data is sourced from TradeWave.ai, which analyzes historical price behavior across annual calendar windows going back up to 30 years. Read the full data methodology or the book The 100-Year Pattern by Afshin Moshrefi (2026 edition). Past performance of seasonal patterns does not guarantee future results. This article is for informational purposes only and does not constitute investment advice.