10-for-10 Midterm Slide: Lean Hogs (HE) Has Dropped Every 60-Day Summer Window
Lean Hogs futures are heading toward a midterm-year summer stretch that has been consistently bearish, putting a spotlight on downside risk just as prices trade between recent highs and lows.
What is the seasonal pattern for Lean Hogs (HE)?
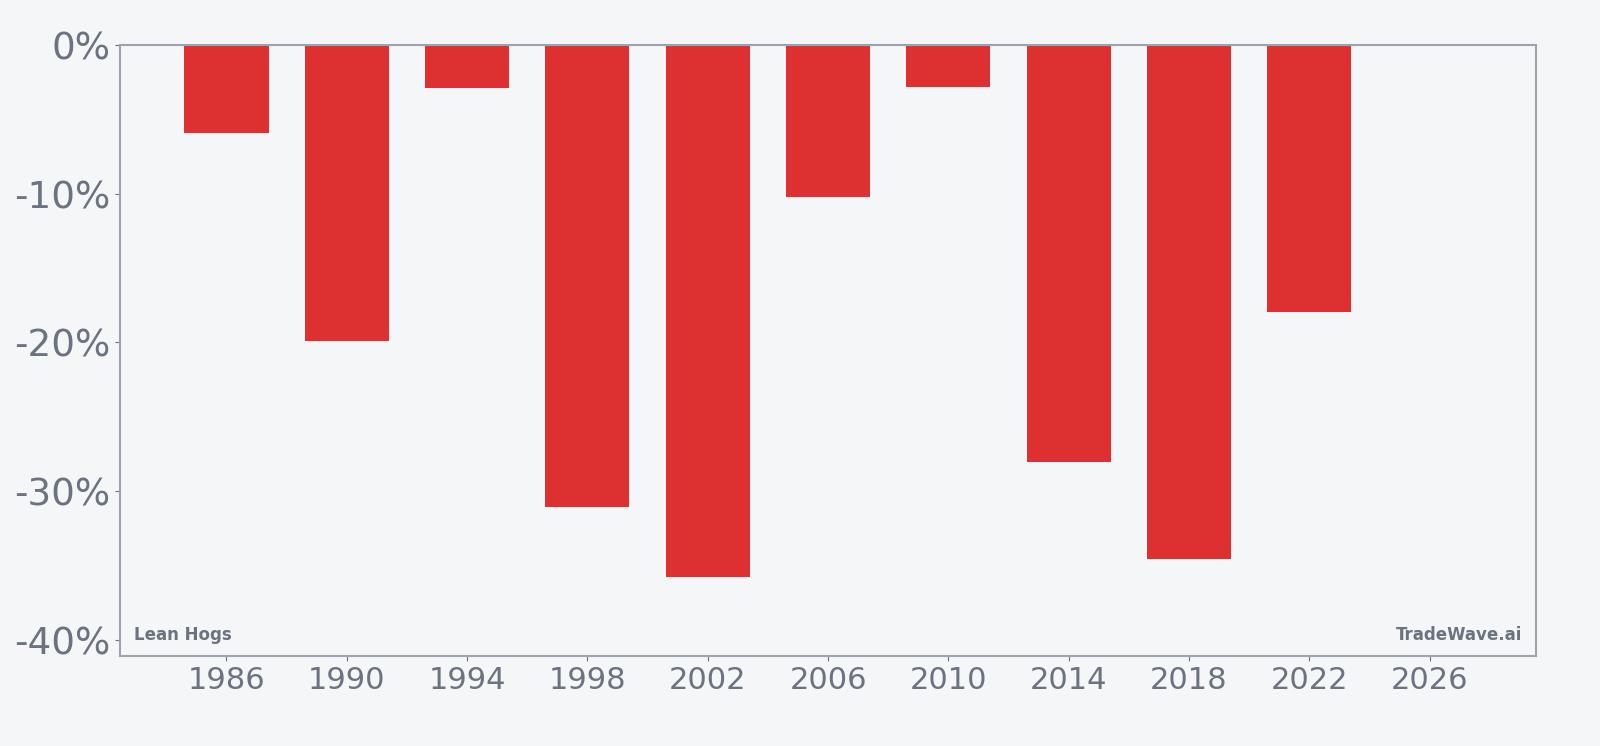
Lean Hogs has fallen in 10 of 10 midterm-year summer windows during this 60-day pattern, with an average gain of 18.91% in winning years for short positions.
- 10 for 10 in this window, with short trades averaging 18.91% gains in winning years across the last 10 midterm election cycles.
- The 60-day Lean Hogs trading window begins on Jun 26 and has historically favored downside moves for prices.
- Percent Profitable is 100%, with 10 winners and 0 losers for the short-side seasonal strategy in this sample.
- Average profit per winning year is 18.91%, supported by a Sharpe ratio of 1.41 for end-of-window outcomes.
- The TradeWave Ratio of 1.62 signals that price typically travels meaningfully in the trade direction during the window, with sizable intraperiod swings.
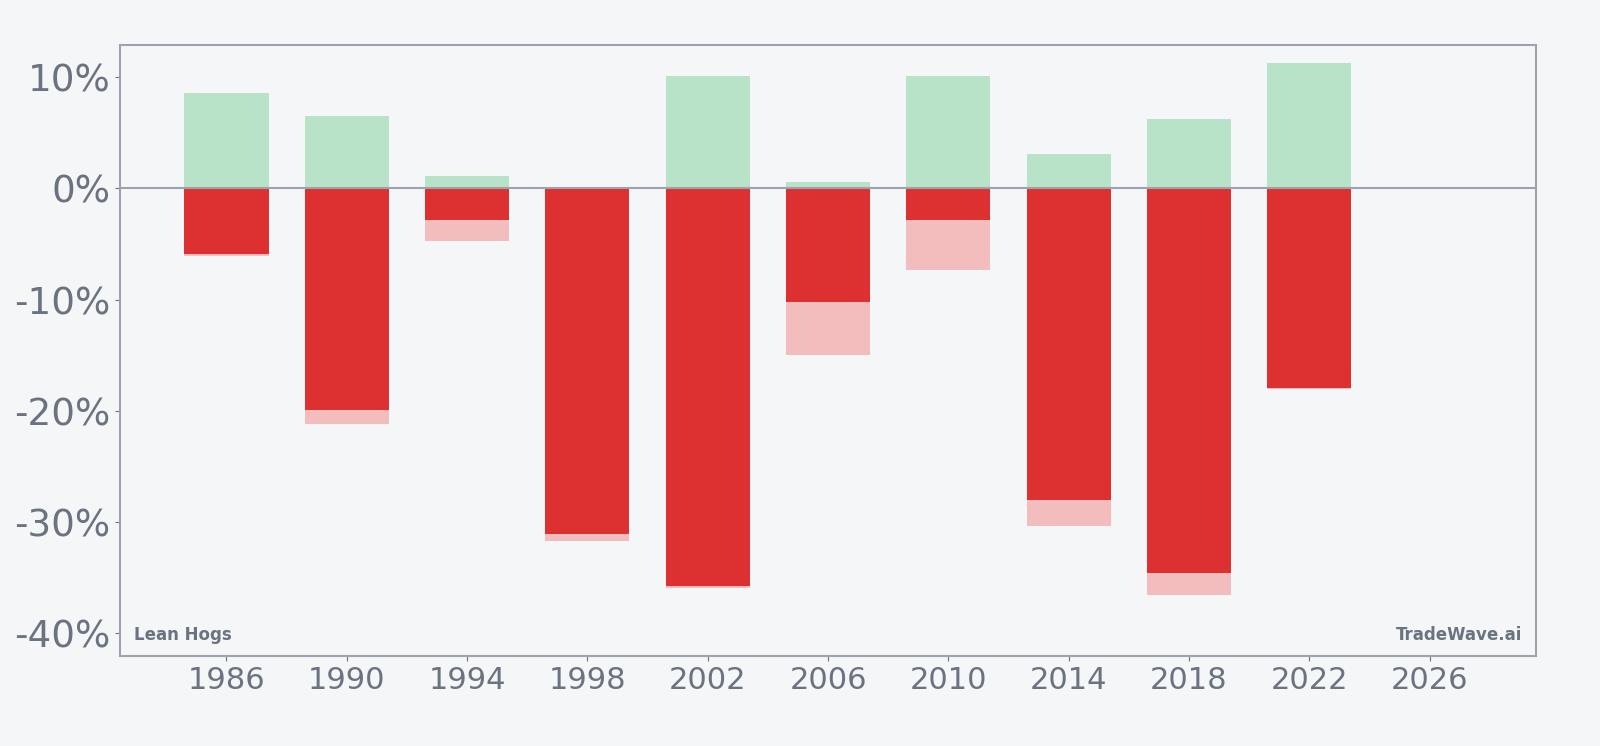
- Historical maximum favorable and adverse excursions show that even winning short windows can see sharp countertrend rallies before prices roll over again.
According to historical data from TradeWave.ai, this upcoming midterm-year stretch in Lean Hogs behaves very differently from an average summer on the futures calendar. The next section walks through how that pattern has played out across prior cycles and what it implies for the 2026 setup.
How has Lean Hogs (HE) traded in past midterm-year summer windows?
Lean Hogs has declined in all 10 of the last midterm election years during the 60-day window that starts on Jun 26, with short positions averaging 18.91% gains when held through the period. That makes this late-June to late-August stretch one of the most consistently bearish seasonal windows on the hog futures calendar.
Grouping the data by the presidential election cycle matters here because midterm years often bring policy uncertainty around farm bills, trade rules and biofuel mandates, which can distort normal supply and demand flows in livestock markets. This pattern phase isolates those mid-cycle summers, letting traders see how Lean Hogs has behaved when Washington is focused on regulation and budget fights rather than campaigning.
Year-by-year net returns and intraperiod swings show how consistently this window has rewarded short exposure while still delivering sharp countertrend moves.
The trade direction for this pattern is explicitly short, and the track record is unusually clean. Percent Profitable sits at 100%, with 10 winners and 0 losers across the last 10 midterm election years, and average profit for those winning short trades is 18.91%. The median outcome is similar at 18.93%, which suggests the window has not been skewed by just one or two outlier collapses.
Looking at individual years shows how that plays out. In 2014, a short entered around 129.85 and exited near 93.45, a net move of about 28.03% in favor of the trade as hog prices broke sharply lower. In 2002, the contract slid from roughly 50.77 to 32.62, delivering a 35.75% gain for shorts over the 60-day span. Even the softer years, such as 1994 and 2010, still finished with net declines of 2.89% and 2.83% respectively.
The maximum favorable excursion and maximum adverse excursion profile underlines how volatile this Lean Hogs trading window can be. In 2022, for example, the short position saw a best intraperiod move of 11.22% in its favor but also endured a worst drawdown of 18.08% from entry before finishing with a 17.96% profit. In 1990, the trade’s maximum adverse move reached 21.22% even though the final net return for the short was a strong 19.9% gain.
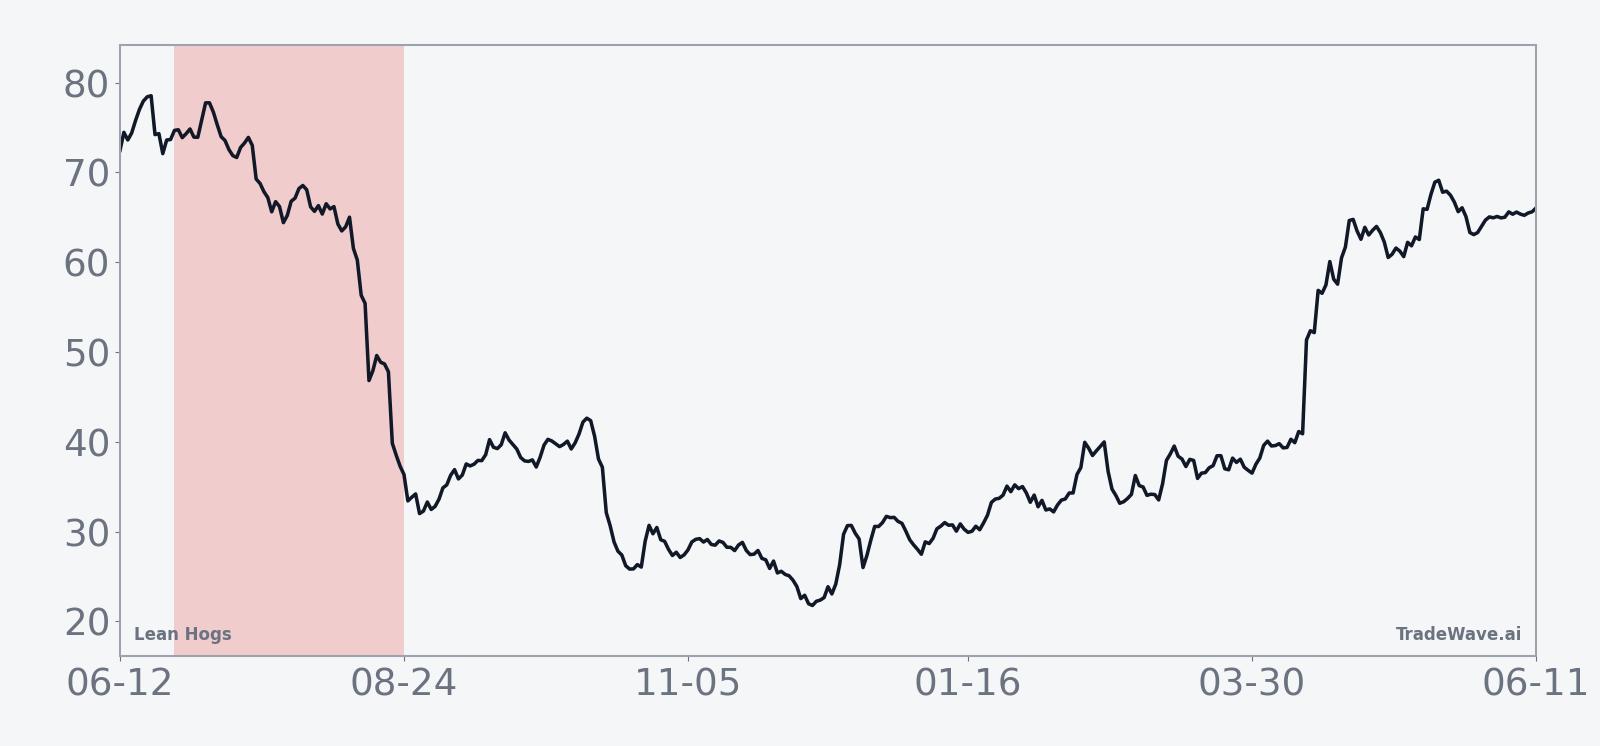
Across the sample, the TradeWave Ratio of 1.62 indicates that price typically travels a meaningful distance in the trade direction during the window, independent of where it closes. The Sharpe ratio of 1.41, based on end-of-window outcomes, points to a favorable risk-adjusted profile for the short-side seasonal strategy, even with those deep intraperiod swings. The historical seasonal trend chart shows that much of the downside tends to accrue in the middle third of the window, with some years starting with a brief rally before rolling over.
The cumulative return curve for this pattern is also telling. Stacking the 10 midterm-year windows produces a smooth downward slope for Lean Hogs prices across the 60 days, rather than a choppy sideways line. Add it up and the cumulative return for the short strategy across these cycles is 435%, which reflects how often and how decisively this specific slice of the calendar has leaned lower for hog futures.
History does not guarantee future results, and the maximum adverse excursions in several years show that even winning seasonal windows can involve large drawdowns before the trade moves back in the expected direction.
Why does Lean Hogs (HE) follow this seasonal pattern?
This midterm-year summer pattern in Lean Hogs likely reflects a mix of commodity supply and demand seasonality and policy timing. One likely driver is the way hog weights, slaughter schedules and grilling-season demand crest into early summer, often followed by softer wholesale and retail pricing as supply stays high while demand cools. Analysts also point to midterm-year policy debates around trade and agriculture that can weigh on producer sentiment and hedging behavior, reinforcing downside pressure in this specific part of the calendar.
What is driving Lean Hogs (HE) today?
Lean Hogs settled on Jun 11 at 95.8, leaving the contract below its 52-week high of 113.7 and above the 52-week low of 77.35, with a one-month gain of 5.39% and prices trading modestly above the 50-day moving average of 93.6345. That puts the market in the middle of its recent range as traders look ahead to the late-June seasonal window, with average 20-day volume around 10,025 contracts suggesting liquidity is sufficient for hedgers and speculators to reposition.
The chart below situates the latest move in its recent multi-month context and overlays the upcoming 60-day seasonal projection.
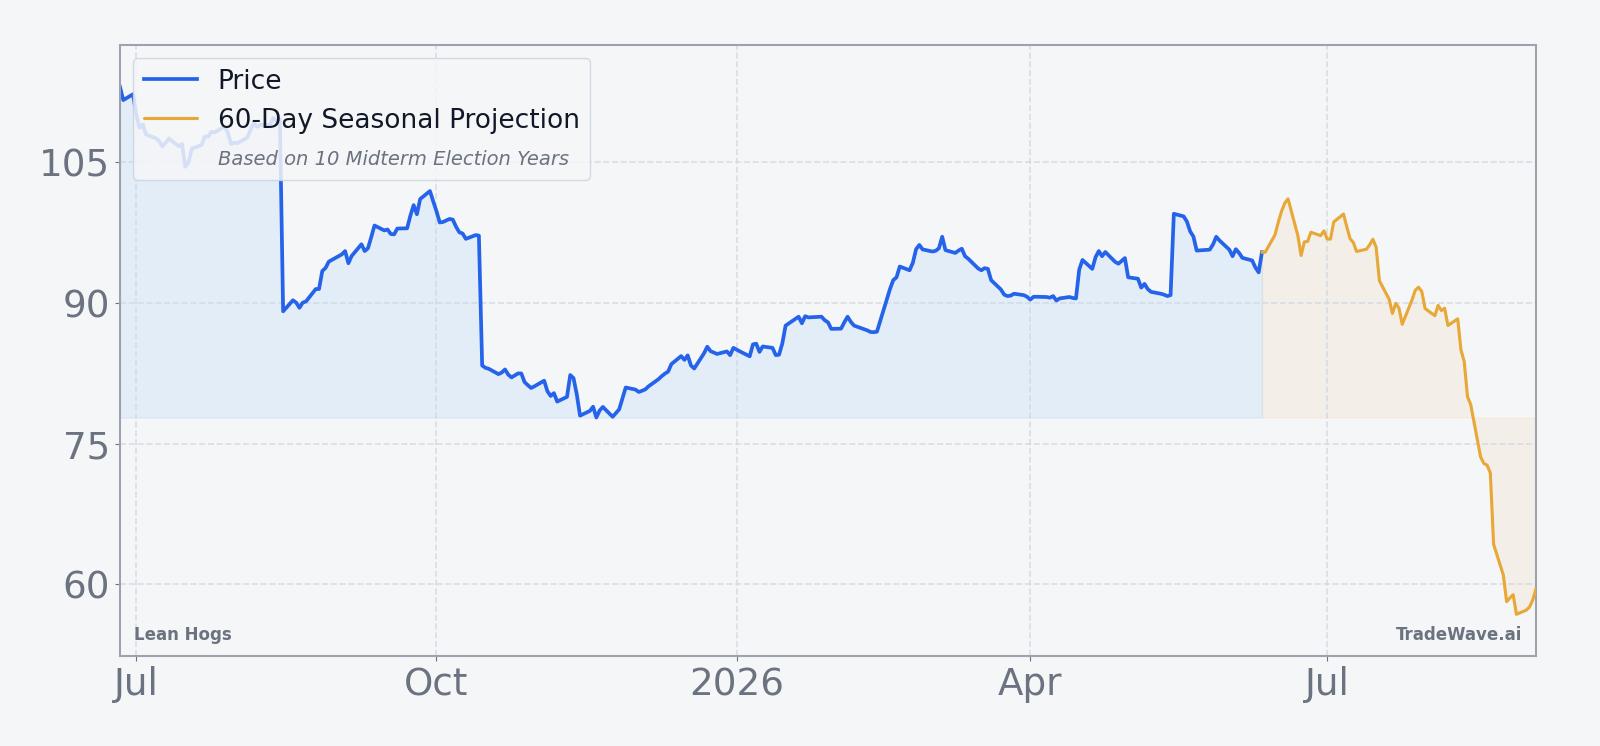
From a macro and policy perspective, 2026 is the midterm election year in the current U.S. presidential cycle, a phase that often brings renewed debate over farm subsidies, trade access and environmental rules that affect feed costs and packing capacity. For hog producers and packers, that backdrop can translate into more aggressive hedging in futures as they manage margin risk into the second half of the year. The historical seasonality suggests that when those forces line up with heavy summer supply, Lean Hogs has tended to drift or break lower into late August rather than sustain early-summer rallies.
Looking ahead, the key question for traders is whether the current mid-range price zone becomes a launching pad for another seasonal downswing or a sign that the pattern is fading. If prices hold near or above the recent highs as the Jun 26 window opens, it would mark a clear departure from the typical midterm-year script. If instead the contract starts to roll over while volume stays near or above its 20-day average, it would fit the historical Lean Hogs seasonal trend that has favored short exposure in this part of the cycle.
What should traders watch as the 2026 Lean Hogs window approaches?
First, watch how Lean Hogs behaves as Jun 26 approaches relative to the 52-week band between 77.35 and 113.7. A failure to challenge the upper end of that range into the start of the window would be consistent with prior midterm years where rallies faded before the main seasonal downswing. A push toward or through the highs, by contrast, would test how robust the historical pattern really is.
Second, monitor daily ranges and volume against the 20-day average of about 10,025 contracts. The historical MFE and MAE profile shows that big moves in this window often develop quickly, with sharp intraday swings in both directions before the prevailing trend reasserts itself. Elevated volume on down days would align with the short-side seasonal bias, while light volume on pullbacks could hint at a more balanced market.
Third, keep an eye on policy headlines tied to agriculture, trade and biofuels as the midterm election year moves into its second half. Any sign of tighter export access, higher feed costs or regulatory pressure on packers could reinforce the historical pattern of weaker Lean Hogs prices in this summer stretch. Conversely, unexpectedly supportive policy news could blunt the typical seasonal downside and produce a more sideways outcome than the past 10 cycles.
Finally, use the behavior inside the window as a real-time test of the pattern. If Lean Hogs starts to trend lower in the middle third of the 60-day span, with rallies stalling below prior peaks, it would echo the historical seasonal path that has delivered 10 straight winning years for shorts. If instead the contract grinds higher or holds firm despite normal harvest and demand dynamics, traders will have evidence that this particular midterm-year window is breaking from the script, at least for 2026.
Sources
About this seasonal analysis
Seasonal pattern data is sourced from TradeWave.ai, which analyzes historical price behavior across annual calendar windows going back up to 30 years. Read the full data methodology or the book The 100-Year Pattern by Afshin Moshrefi (2026 edition). Past performance of seasonal patterns does not guarantee future results. This article is for informational purposes only and does not constitute investment advice.