Lean Hogs (HE) Faces 60-Day Midterm Window With 100% Short-Side Profit Record
Lean Hogs futures are drifting into late June just below recent highs as a 60-day midterm-year seasonal window with a perfect bearish record approaches.
What is the seasonal pattern for Lean Hogs (HE)?
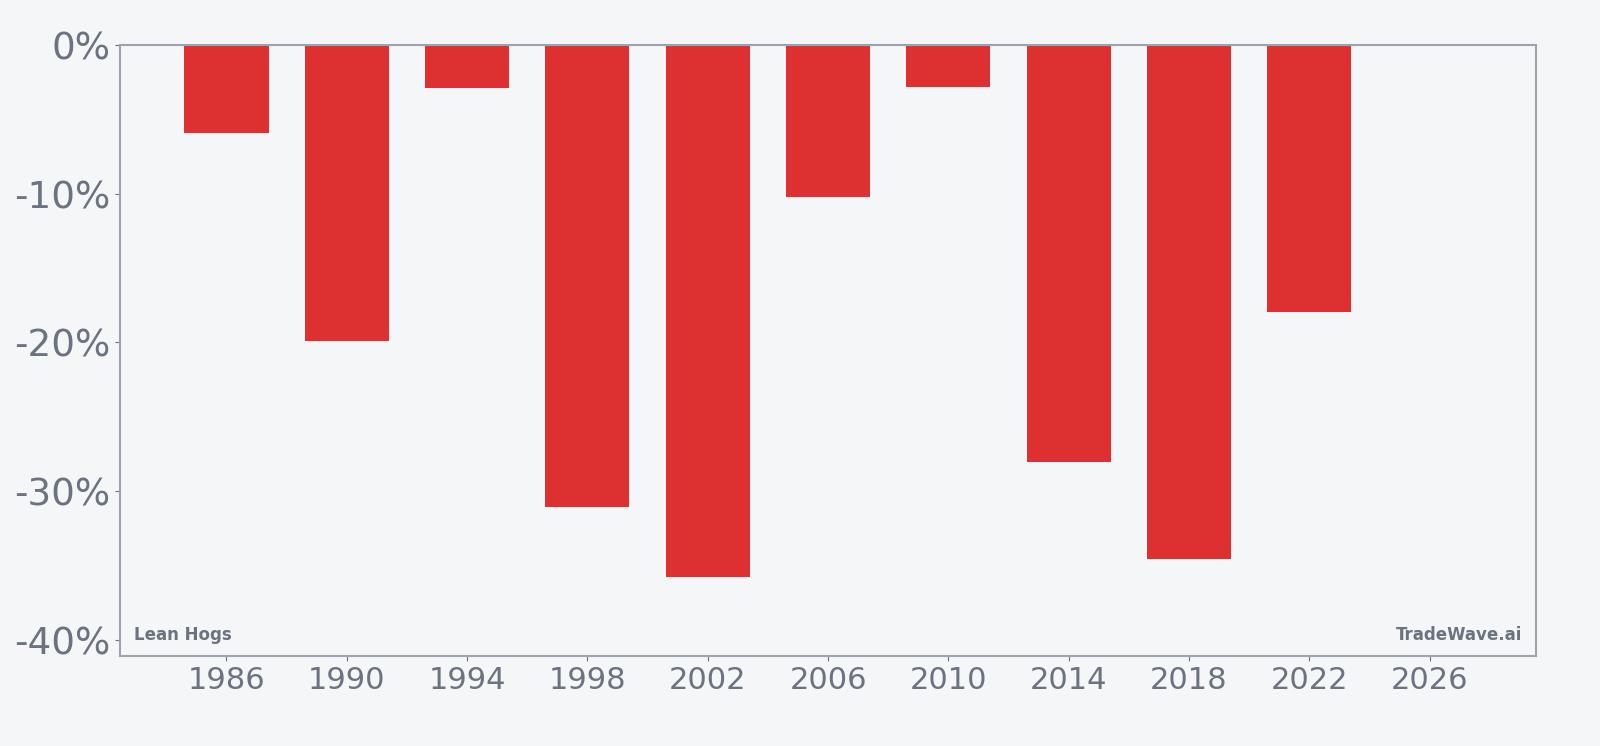
Lean Hogs has fallen in 10 of 10 midterm-year summer windows during this 60-day stretch, with an average gain of 18.91% in winning short trades.
- 10 for 10 in this window, with short trades averaging 18.91% gains in winning years.
- Seasonal window runs from Jun 26 for 60 trading days across the last 10 midterm election years.
- Percent Profitable is 100%, with 10 winners and 0 losers for the short-side pattern.
- Average winner profit of 18.91% comes with a Sharpe ratio of 1.41 for end-of-window outcomes.
- TradeWave Ratio of 1.62 signals that price typically travels meaningfully in the trade direction within the window.
- Individual years have seen sharp adverse swings inside the window even when the final result favored shorts.
According to historical data from TradeWave.ai, this upcoming midterm-year stretch in Lean Hogs has behaved very differently from an average summer on the calendar, and the next iteration is only days away.
How has Lean Hogs (HE) traded in past midterm-year summer windows?
Lean Hogs has delivered profitable short trades in every one of the last 10 midterm election years during the 60 trading days starting Jun 26, with average gains of 18.91% for those shorts. With the new window set to open this Friday, futures are coming off a modest one-month pullback of 2.31% after a strong run that left the contract not far removed from its 52-week high of 113.275.[1]
The presidential election cycle matters here because this pattern only looks at midterm election years, a phase that often brings policy uncertainty around farm support, trade rules and environmental regulation. Pattern phase equals the midterm election year, and the calendar phase is also the midterm election year, with this 60-day window sitting in the middle of that year and leading directly into the stronger pre-election backdrop that typically follows.
Across those 10 midterm-year samples, the trade direction is explicitly short. Every year in the sample produced a negative net return for Lean Hogs prices over the window, which translated into a positive outcome for shorts. The median profit for the short trades was 18.93%, very close to the 18.91% average, which suggests the pattern is not being skewed by a single outlier year.
Looking at individual cycles, the weakest year for Lean Hogs prices in this window was 2002, when the contract fell 35.75% from an entry around 50.77 to an exit near 32.62. The softest outcome for shorts was 1994, when prices slipped only 2.89% from 46.75 to 45.4, still a winning year for the pattern. Even the smaller moves would have rewarded traders who were positioned for seasonal downside.
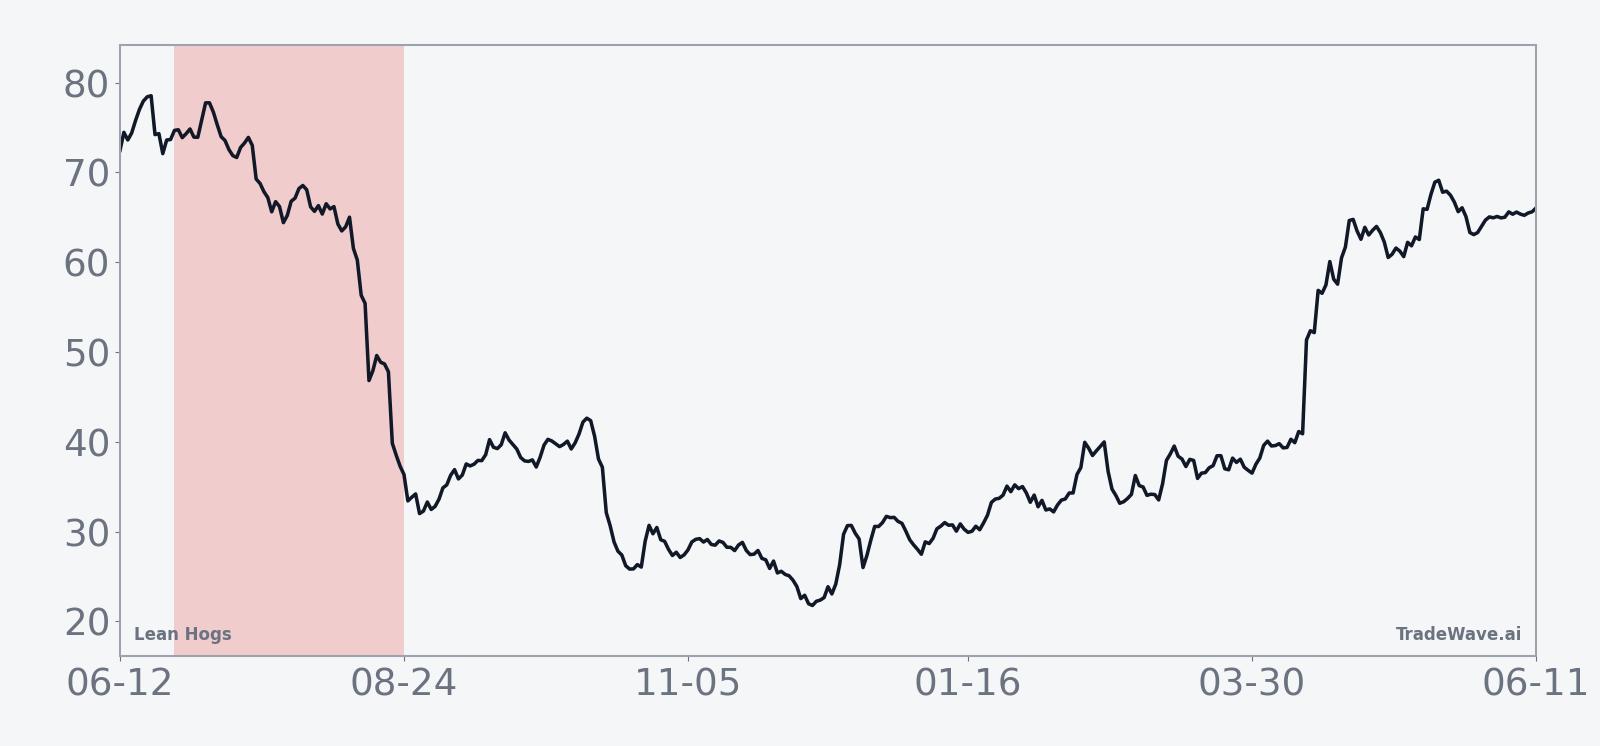
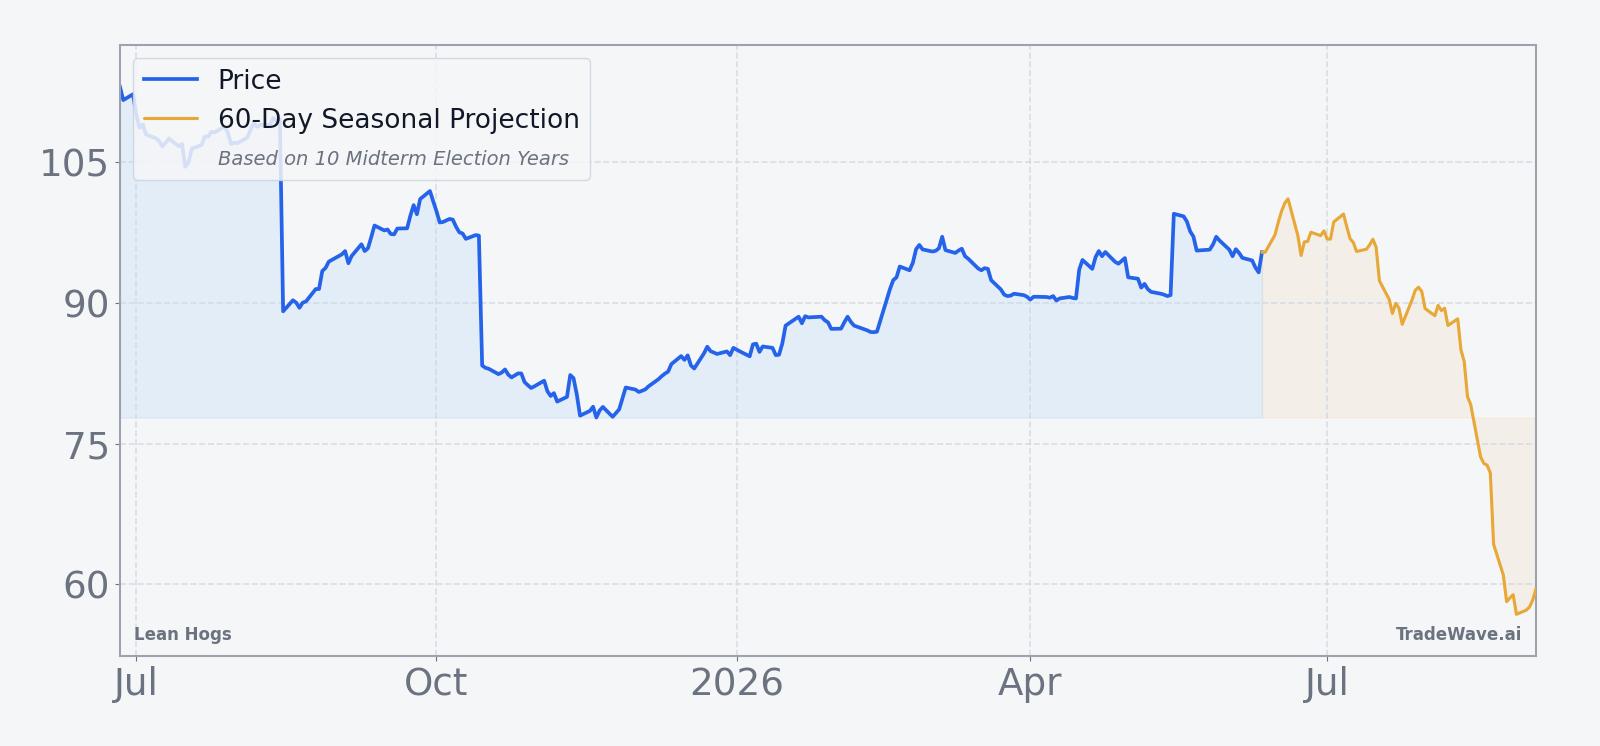
The historical seasonal trend chart shows that most of the downside for Lean Hogs in this window has tended to build gradually rather than in a single collapse. Prices often drift lower through the middle of the window, with some years showing a sharper acceleration into the final third as summer demand fades and supply expectations firm up.
A second view that combines net results with peak rallies and worst drawdowns helps frame how far Lean Hogs has typically moved inside the window.
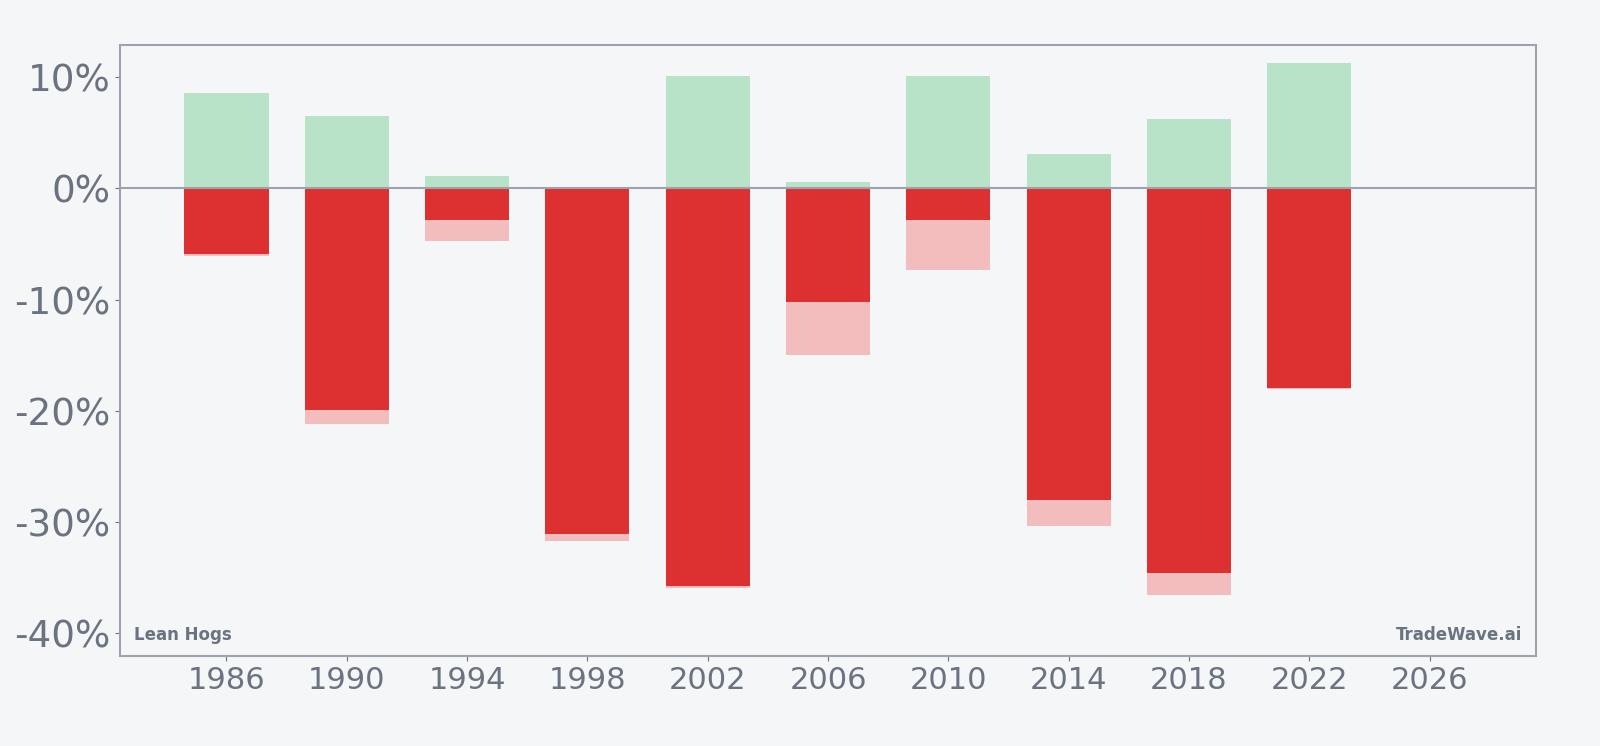
The per-year bars with maximum favorable and adverse excursions show that even in strong down windows, Lean Hogs has often staged sizable countertrend rallies before rolling over. For example, in 2022 the contract ultimately fell 17.96% but saw a peak run-up of 11.22% from the entry level, while the worst intraperiod drawdown reached 18.08% below entry before the window closed. That mix of large best-case and worst-case excursions is what the TradeWave Ratio of 1.62 is capturing, and it underlines that this has been a high-energy stretch for hog futures rather than a quiet grind.
History does not guarantee future results; adverse excursions can be large even in winning windows, and traders can be squeezed if timing or risk limits are off.
Why does Lean Hogs (HE) follow this seasonal pattern?
For Lean Hogs, one likely driver of this midterm-year summer pattern is commodity supply and demand seasonality around U.S. hog production and slaughter schedules. Analysts often point to heavier marketings into late summer, when animals finished earlier in the year hit processing plants just as grilling demand starts to cool. The midterm election year overlay may add another layer, as policy debates on trade, biofuels and environmental rules can weigh on livestock sentiment during this part of the political cycle.
What is driving Lean Hogs (HE) today?
Spot Lean Hogs pricing data for Jun 22 is thin, but the contract has slipped about 2.31% over the past month after a strong spring that pushed futures up toward a 52-week high of 113.275, while the 52-week low sits at 77.35 and the 50-day moving average is 94.00 on roughly 11,604 contracts of average 20-day volume.[1] That leaves the market in a consolidating posture heading into the seasonal window, with traders weighing softer near-term demand against still-tight supplies and the usual summer volatility in livestock markets.
The chart below situates the latest move in its recent multi-month context and overlays the upcoming 60-day seasonal projection.
What should traders watch as this Lean Hogs window opens?
As the Jun 26 start date approaches, the first thing to watch is whether Lean Hogs respects or rejects the historical pattern of midterm-year summer weakness. A quick break below the 50-day moving average with expanding volume would be consistent with prior cycles, while a sustained push back toward the 52-week high would mark a clear divergence from the usual HE seasonal trend.[1]
Second, intraperiod swings matter as much as the final direction. Past windows have seen double-digit rallies inside an overall downtrend, so traders will want to track whether early strength fades into lower highs or instead morphs into a full-blown squeeze that overwhelms the short-side pattern. Large daily ranges and repeated tests of recent support and resistance would fit the historical profile of a volatile Lean Hogs trading window.
Finally, the policy calendar into late summer and early fall will shape how this midterm-year pattern interacts with the broader agricultural complex. Any headlines on export access, animal health, or feed costs could either reinforce the usual seasonal drift lower or help break it, and the way Lean Hogs behaves around those catalysts will tell traders whether this cycle is tracking the last 10 midterm years or starting to write a different script.
Sources
About this seasonal analysis
Seasonal pattern data is sourced from TradeWave.ai, which analyzes historical price behavior across annual calendar windows going back up to 30 years. Read the full data methodology or the book The 100-Year Pattern by Afshin Moshrefi (2026 edition). Past performance of seasonal patterns does not guarantee future results. This article is for informational purposes only and does not constitute investment advice.