Lean Hogs (HE) Sits Mid-Range as 100% Short-Side Midterm Summer Decline Window Opens
Lean Hogs futures sit in the middle of their 52-week range just as a 60-day midterm-year seasonal window opens that has historically favored the short side.
Price as of Jun 25, 2026: $96.65 (last close).
What is the seasonal pattern for Lean Hogs (HE)?
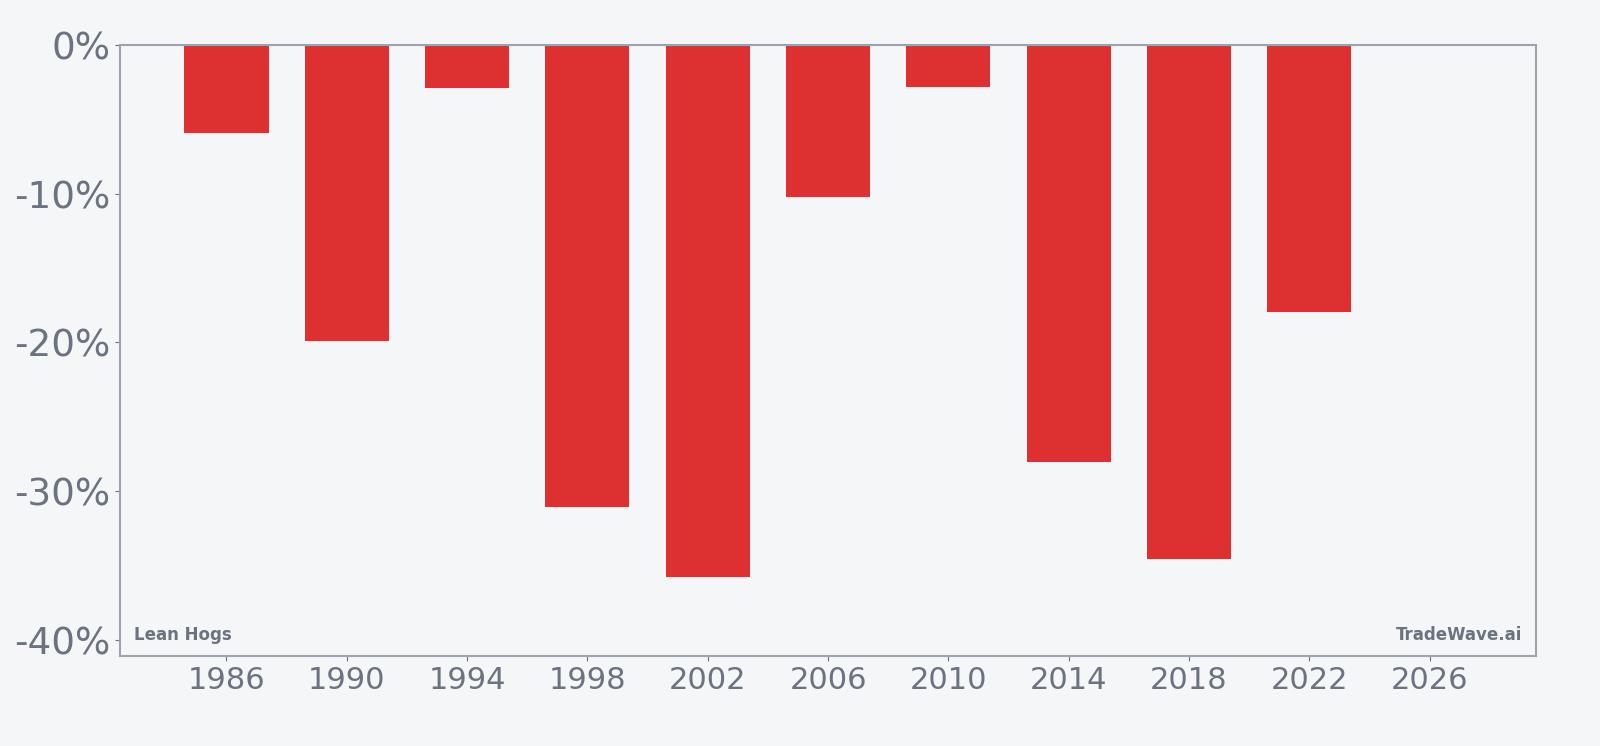
Lean Hogs has fallen in 10 of 10 midterm-year summer windows during this 60-day stretch, with an average gain of 18.91% in winning years for traders positioned short.
- 10 for 10 in this window, with short trades averaging 18.91% gains in winning years.
- Seasonal direction is bearish for prices (bullish for shorts) across a 60-day window starting Jun 26 in midterm election years.
- Percent Profitable is 100%, with 10 winners and 0 losers over the last 10 midterm-year cycles.
- Average profit of 18.91% reflects sizeable downside moves in Lean Hogs during this specific election-cycle slice.
- Intraperiod swings have been large, with some years showing double-digit favorable moves alongside deep adverse excursions before the trend reasserted.
- Add it up: a 435% cumulative return for the short side across these ten midterm-year windows.
According to historical data from TradeWave.ai, this midterm-year stretch in Lean Hogs behaves very differently from an average summer, with a clear directional bias that traders often overlook.
How has Lean Hogs (HE) traded in this midterm-year summer window?
Lean Hogs has dropped in every single midterm-year summer window for the last ten cycles, with shorts averaging 18.91% gains over the 60-day stretch. The new window opens with the August Lean Hogs contract last quoted at 96.65, roughly 12.2% below its 52-week high of 110.10 and about 25.0% above its 52-week low of 77.35. That combination of a clean 10-for-10 record and a mid-range starting point gives this year’s setup plenty of room for either a repeat slide or a sharp break from the script.
Grouping the data by the presidential election cycle matters here because this is a midterm election year, a phase that often brings shifting farm policy debates, budget wrangling and volatility in risk assets. The pattern window captures the mid part of that year, when Washington’s focus tends to move from early-year agenda setting toward fiscal negotiations and regulatory noise that can ripple through livestock markets.
Historically, this 60-day window has been a clean short pattern. Percent Profitable is 100%, with 10 winners and 0 losers for traders positioned short, and the average profit of 18.91% shows that the typical move has not been a mild drift but a meaningful slide in Lean Hogs prices. The median outcome of 18.93% is almost identical to the average, which tells you the distribution of returns is not being skewed by just one or two outlier years.
The per-year breakdown shows how broad-based the pattern has been. In 2002, shorts captured a 35.75% gain as Lean Hogs fell from 50.77 to 32.62 over the window, while 2018 delivered a 34.57% gain with prices dropping from 79.12 to 51.77. Even the “softest” years for the pattern, such as 1994 and 2010, still produced net returns of 2.89% and 2.83% respectively for the short side, underscoring how rarely the market has fought this seasonal tendency.
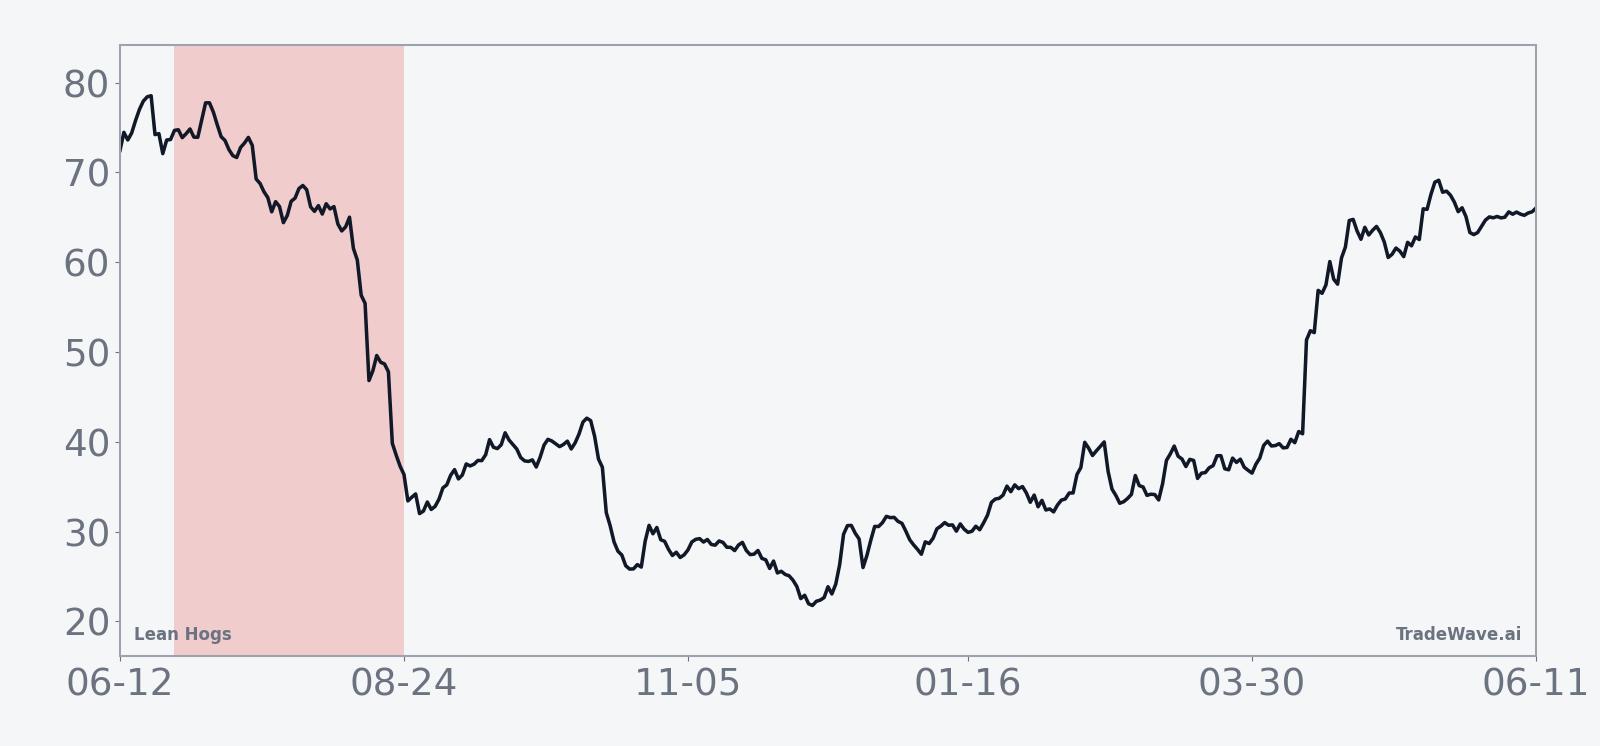
The historical seasonal trend chart points to a fairly steady downward path rather than a single crash point. In many cycles, prices start to soften early in the window, then accelerate lower into the back half, which has rewarded shorts that were patient with intraperiod noise. The cumulative return line across cycles climbs steadily for the short side, reflecting a 435% total gain across the ten midterm-year windows.
Year-by-year bars that include both peak favorable and worst adverse moves show how much heat shorts have had to take before the pattern paid off.
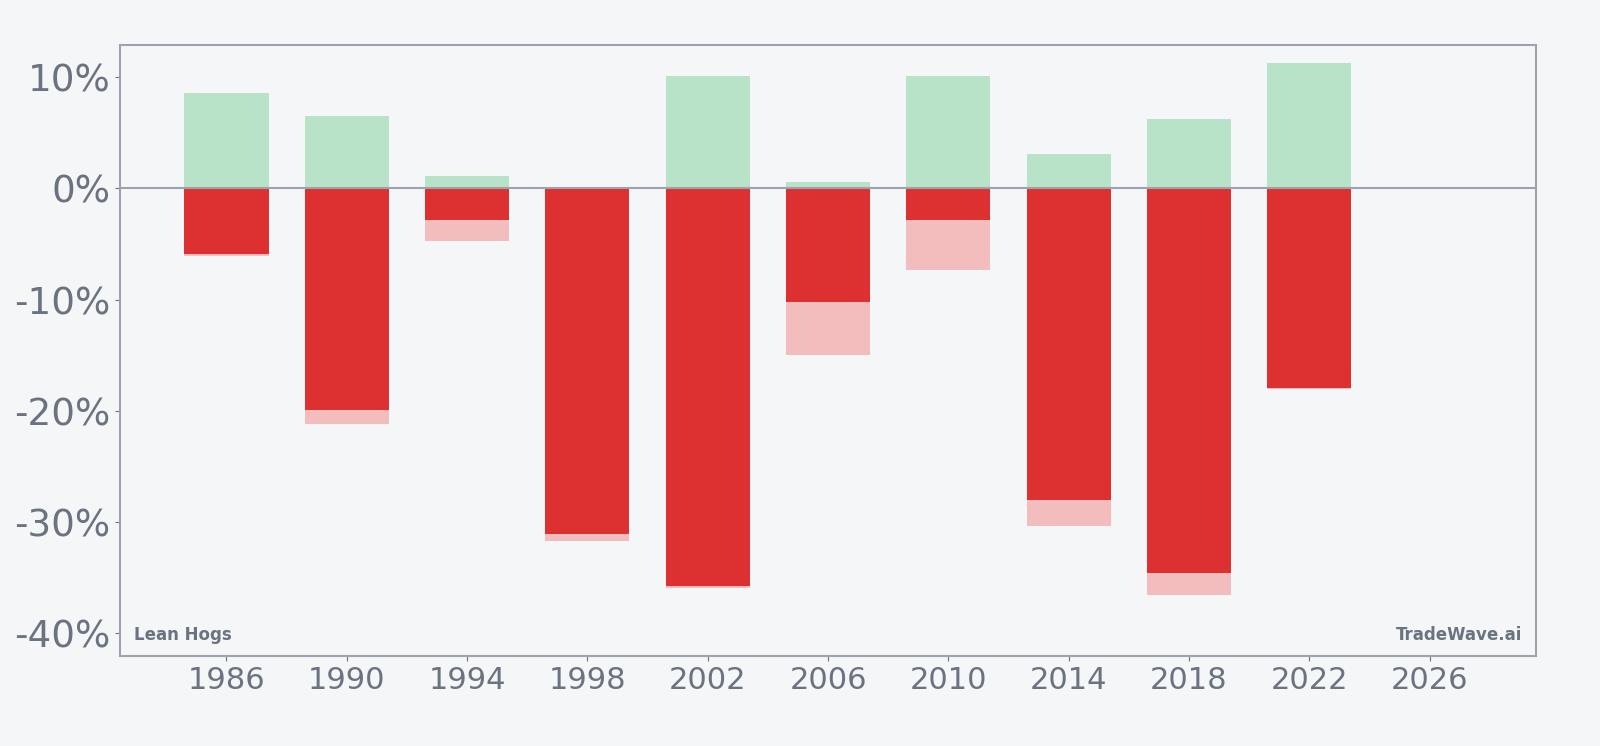
The combined net/MFE/MAE bars show that while the final outcomes have all favored shorts, the ride has not always been smooth. In 1990, for example, the maximum adverse move reached about 21.22% against the short before the contract ultimately finished the window down 19.9%, while 2022 saw a worst drawdown of 18.08% even as the final short-side gain landed at 17.96%. That profile fits a TradeWave Ratio of 1.62, which signals that price typically travels a long way in the trade direction within the window, but often with deep countertrend rallies along the way.
History does not guarantee future results; adverse excursions can be large even in winning windows, and traders can be forced out before the seasonal pattern plays out.
Why does Lean Hogs (HE) follow this seasonal pattern?
This midterm-year summer pattern in Lean Hogs likely reflects commodity supply and demand seasonality more than politics alone. One likely driver is the combination of peak hog supplies moving through the pipeline in late summer and shifting feed and export dynamics, which can pressure prices even when demand is steady. Analysts also point to midyear hedging and risk management by producers and packers, which may cluster in this window and reinforce the historical tendency for prices to weaken.
What is driving Lean Hogs (HE) today?
Lean Hogs futures are coming into this seasonal window from a relatively calm spot on the chart. The August contract settled at 96.65 in the prior session, leaving it about 12.2% below the 52-week high of 110.10 and roughly 25.0% above the 52-week low of 77.35, with 20-day average volume running near 11,232 contracts. The 50-day simple moving average sits at 94.34, so prices are only modestly above their short-term trend line, suggesting neither a stretched rally nor a deep oversold condition as the historical pattern kicks in.
The chart below shows how that mid-range setup lines up against the past year’s trading range and the 60-day seasonal projection.
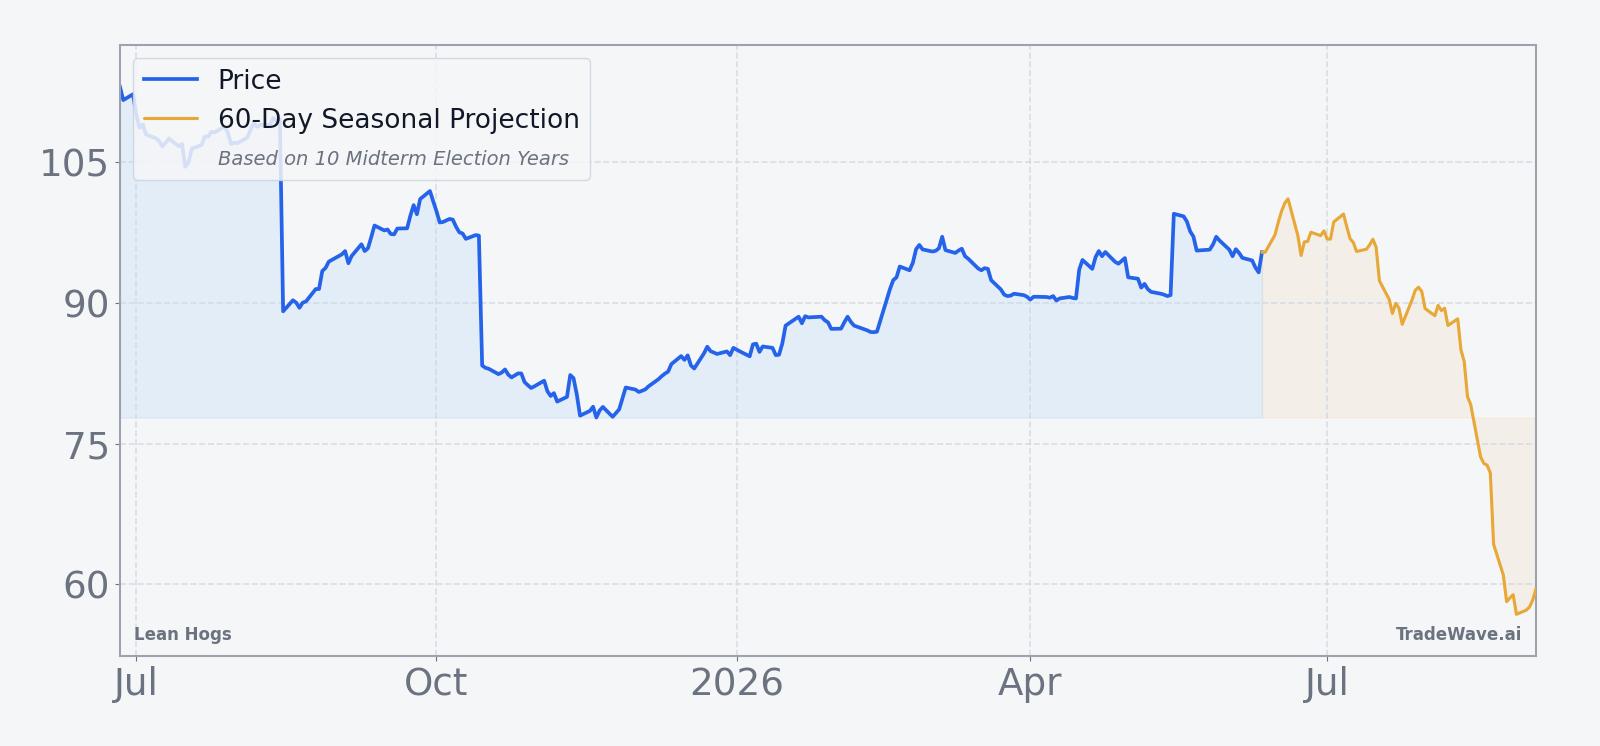
From a macro and policy standpoint, this year’s midterm election backdrop adds another layer to the usual livestock seasonal story. Midterm years often feature contentious budget talks and debates over farm bill priorities, trade policy and environmental regulation, all of which can influence producer sentiment and hedging behavior in hogs. Even without a single headline catalyst on the tape today, the combination of a mid-range price, a maturing uptrend off last year’s lows and a historically bearish seasonal window gives traders a clear framework for thinking about risk and opportunity into late summer.
What should traders watch in this Lean Hogs seasonal window?
First, watch how Lean Hogs behaves around the 94 to 97 band that currently brackets spot and the 50-day moving average. A quick break below that zone early in the window would be consistent with the historical pattern of weakness building as the summer progresses, while a sustained push back toward the 52-week high near 110 would mark a clear departure from the last ten midterm-year cycles.
Second, monitor intraday volatility and the size of countertrend rallies. Past windows have seen maximum adverse moves against shorts in the mid-teens to low-20s in percentage terms before prices ultimately rolled over, which means sharp squeezes are part of the playbook rather than an automatic invalidation of the seasonal trend. If this year’s window features shallower bounces and quicker follow-through to the downside, it would signal that the bearish seasonal tendency is asserting itself with less resistance than usual.
Finally, keep an eye on the policy calendar and export headlines as the midterm year moves into its back half. Announcements around trade access, animal health issues or feed costs can either reinforce or disrupt the usual summer softening in hog prices. If Lean Hogs weakens into those events in line with the historical pattern, it will add weight to the idea that this midterm-year window remains one of the more reliable seasonal stretches on the livestock calendar; if prices instead grind higher through the window, it would mark the first real break in a 10-for-10 record that has held for four decades.
Sources
About this seasonal analysis
Seasonal pattern data is sourced from TradeWave.ai, which analyzes historical price behavior across annual calendar windows going back up to 30 years. Read the full data methodology or the book The 100-Year Pattern by Afshin Moshrefi (2026 edition). Past performance of seasonal patterns does not guarantee future results. This article is for informational purposes only and does not constitute investment advice.