Lumber (CME) (LBR) Heads Into Jul 2 Window With 90% Short-Side Win Record and 7% Avg Decline
Lumber (CME) is hovering near the upper end of its 12‑month range just days before a midterm-year July window that has historically rewarded short exposure.
What is the seasonal pattern for Lumber (CME) (LBR)?
Lumber (CME) has fallen in 9 of the last 10 midterm-year July windows for this 25-day pattern, with an average 7.93% gain in winning years for short positions.
- 9 for 10 in this window, with short trades averaging 7.93% gains in winning years across the last 10 midterm election cycles.
- The upcoming 25‑day Lumber (CME) trading window starts on Jul 2, 2026 and historically favors downside moves for short exposure.
- Percent Profitable sits at 90%, with 9 winners and just 1 loser across the sample.
- Including all years, the pattern has delivered a 7% average return, showing that the lone losing year has not erased the broader edge.
- Maximum adverse excursions have reached double digits in some years, so even successful shorts have faced sizable intraperiod drawdowns.
- A TradeWave Ratio of 2.04 and a Sharpe ratio of 1.15 point to a historically strong and persistent seasonal edge for this short pattern.
According to historical data from TradeWave.ai, this midterm-year July stretch in lumber behaves very differently from an average summer month, with a clear directional bias that many traders overlook.
How has Lumber (CME) (LBR) traded in this midterm-year July window?
Lumber (CME) has fallen in 9 of the last 10 midterm election years during this 25‑day July window, with short positions posting an average 7.93% gain in winning years and a 7% average return across all years. The next iteration of this historical seasonality begins on Jul 2, 2026, with futures last changing hands at 624.0, about 10.7% below the 52‑week high of 698.5 and well above the 52‑week low of 496.0.[1] For a contract that feeds directly into housing margins and construction costs, that combination of elevated price and a historically bearish seasonal window is a setup traders will be watching closely.
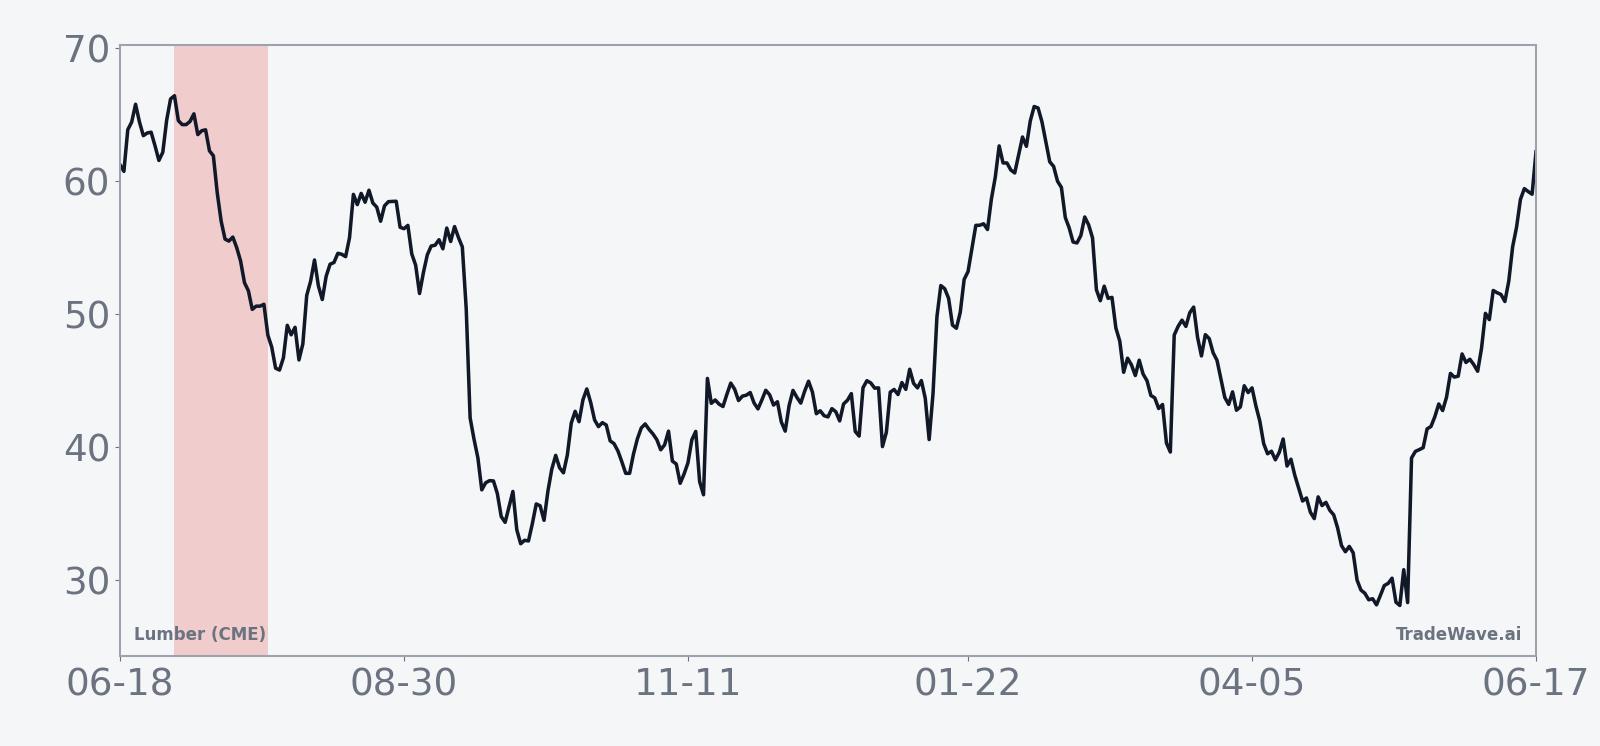
The pattern is built on the last 10 midterm election years, a phase of the presidential cycle that often brings policy uncertainty, shifting fiscal priorities and choppy risk appetite. Grouping by this election phase rather than by simple calendar decades matters for a cyclical commodity like lumber, because housing policy, infrastructure spending and rate expectations tend to cluster around the political calendar. In this specific slice of the cycle, the typical path for LBR during the window is a steady grind lower rather than a sharp one‑day break.
Trade direction for this setup is explicitly short. In prior midterm years, 9 of 10 windows have been profitable for shorts, while only 1 year produced a losing outcome for that stance. The strongest years for the pattern, such as 2018 and 2022, saw net returns of about −16.9% and −15.28% respectively for the underlying contract, which translated into sizable gains for traders positioned short over the window. The lone losing year, 2010, delivered a modest 0.97% rise in prices, a relatively small setback compared with the larger wins in other cycles.
Avg Profit reflects winners only, while Avg Profit - All includes every year in the sample. In this case, the 7.93% average gain in winning years compares with a 7% average when all 10 years are included, which shows that the single losing year has not meaningfully diluted the overall edge. Median Profit of 6.86% sits close to the average, suggesting the distribution of outcomes is not dominated by one or two outliers but by a cluster of mid‑single‑digit to low‑double‑digit declines in lumber prices during the window.
The intraperiod behavior has also been consistent. Maximum favorable excursions, the best point‑to‑trough moves within the window for shorts, have often pushed beyond the final net return, which means that traders who actively managed risk could have seen even larger open profits at some point during the trade. At the same time, maximum adverse excursions, the worst drawdowns from entry, have reached into the high single digits and even low double digits in several years, reminding traders that even historically strong seasonal edges can involve uncomfortable squeezes before the trend reasserts itself.
Looking at individual years, 2022 stands out as one of the most powerful iterations of the pattern. Lumber entered that window near 657 and exited around 557, with the worst intraperiod drawdown for shorts approaching 19.15% and the best favorable move reaching 3.81%. Earlier cycles such as 2002 and 2006 also delivered sizable declines of −8.78% and −8.02% respectively, each accompanied by adverse excursions of more than 9% for shorts before the trade ultimately worked. On the other side of the spectrum, 1994 and 2010 were relatively muted, with small net moves and more balanced intraperiod swings.
The cumulative return profile across all 10 midterm-year windows adds up to a 94% gain for the short strategy over the full sample. That is a striking number for a 25‑day seasonal window that repeats only once every four years. The cumulative curve tends to stair‑step higher rather than oscillate wildly, which reinforces the impression of a persistent, if not perfect, edge for traders who respect the calendar.
Risk‑adjusted metrics back up that story. A Sharpe ratio of 1.15 for the pattern indicates that the average outcome has been strong relative to the volatility of end‑of‑window returns. The TradeWave Ratio of 2.04, which reflects how far price typically travels in the trade direction within the window regardless of the final close, points to meaningful intraperiod movement that can matter for both directional traders and hedgers. For lumber producers, homebuilders and dealers, that combination of sizable typical moves and a clear directional bias is exactly the kind of seasonal information that can inform hedging calendars.
Yearly net and intraperiod swings show how often this window has rewarded shorts while still delivering sizable drawdowns.
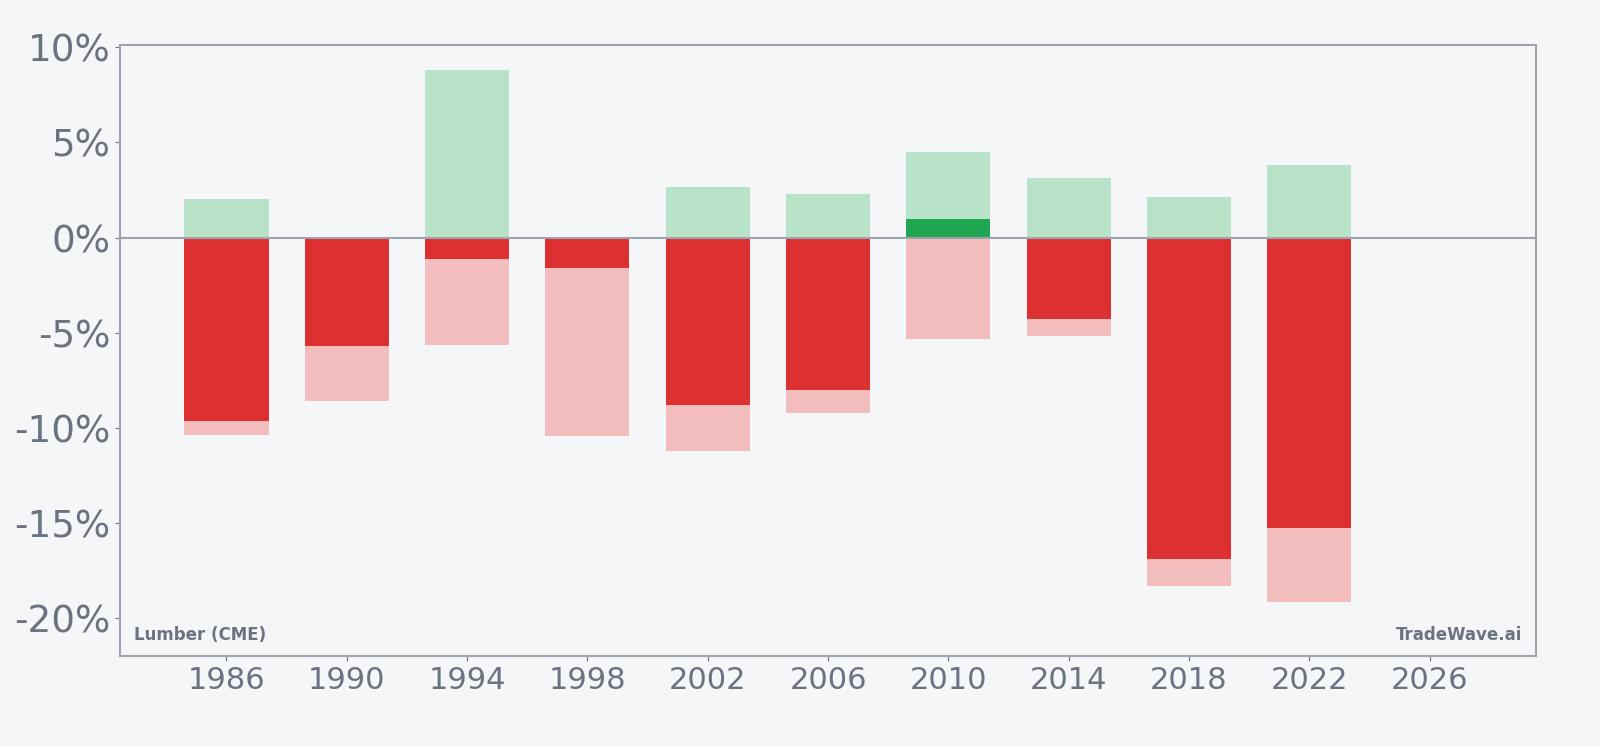
History does not guarantee future results, and maximum adverse excursions have been large in some years even when the window ultimately favored short positions.
Why does Lumber (CME) (LBR) follow this seasonal pattern?
This midterm-year July pattern for lumber likely reflects a mix of commodity supply and demand seasonality and the political calendar. One likely driver is that summer is often when North American construction activity is already in full swing, so incremental demand growth can slow just as mills ramp output, pressuring prices. Analysts also point to midterm-year policy debates around housing, infrastructure and tariffs, which can inject uncertainty into forward demand expectations and encourage producers and builders to hedge more aggressively during this stretch.
What is driving Lumber (CME) (LBR) today?
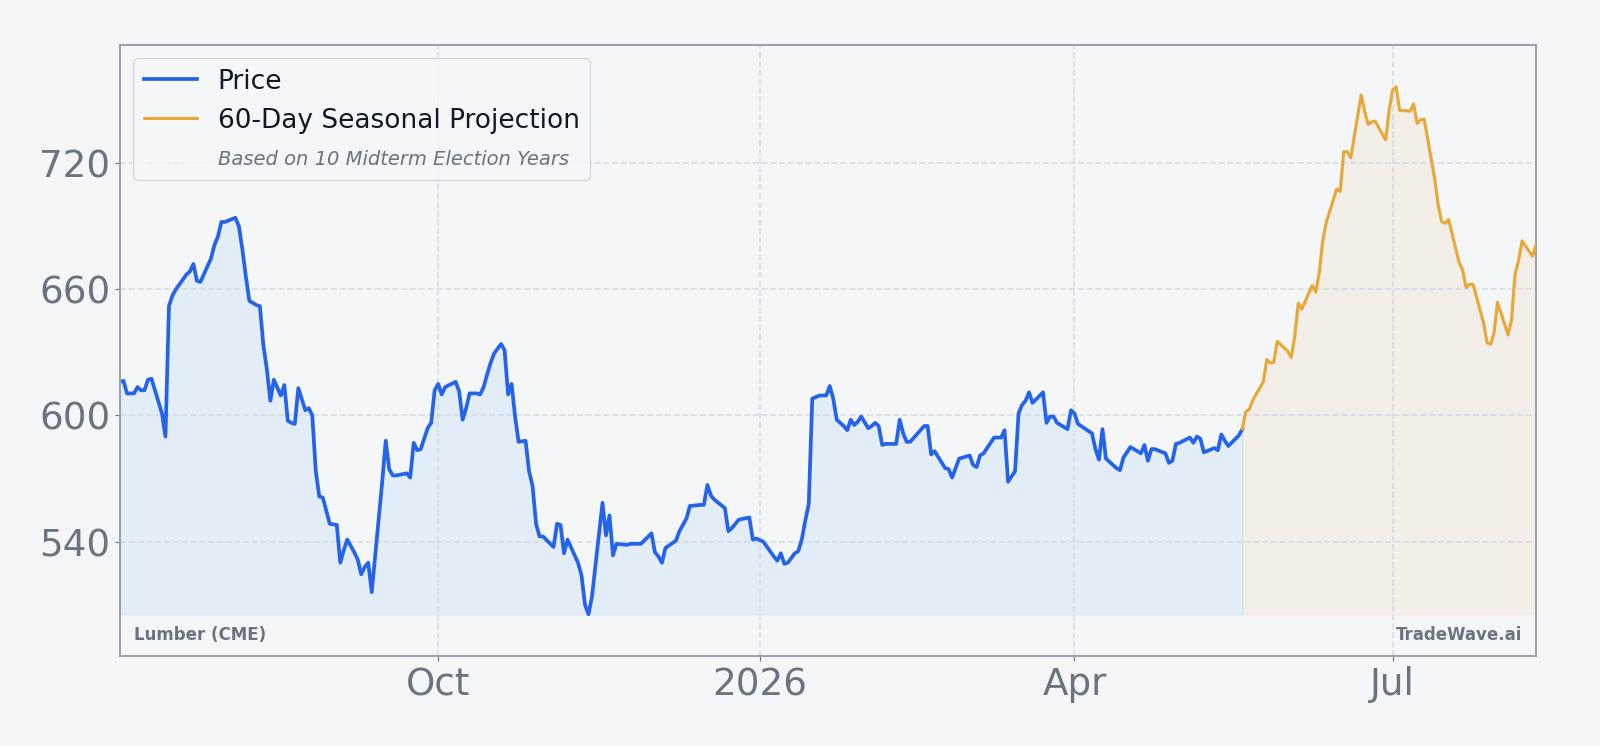
Lumber (CME) futures settled at 624.0 on Jun 25, up 0.16% on the day, extending a roughly 3.3% gain over the past month as prices trade between a 12‑month low of 496.0 and a high of 698.5.[1] Volumes remain modest, with about 975 contracts changing hands against a 20‑day average near 703, suggesting that many participants are still in positioning mode rather than chasing momentum ahead of the July seasonal window.
The chart below situates the latest move in its recent multi‑month context alongside a 60‑day seasonal projection.
What should traders watch as this seasonal window approaches?
With the midterm-year July window set to open on Jul 2, the first watchpoint is whether lumber can hold above its 50‑day moving average around 588.46 or whether sellers start leaning in as the calendar flips.[1] A break back toward the 600 area early in the window would be consistent with prior years where prices rolled over from elevated levels, while a squeeze toward the 52‑week high near 698.5 would look more like the rare losing year for this pattern.
Second, watch construction and housing data that hit during the window, along with any headlines around building codes, tariffs on Canadian softwood or infrastructure spending debates in Washington. Those policy and macro catalysts often intersect with lumber demand expectations, and in prior midterm cycles they have coincided with the kind of volatility that shows up in the historical maximum adverse and favorable excursions.
Finally, behavior inside the window will matter as much as the closing print. If intraday swings start to resemble the double‑digit MAE and MFE seen in past cycles, it would confirm that this is once again a high‑energy stretch for the contract, even if the final net move ends up smaller. If, instead, price action stays unusually quiet and pinned near current levels, that would be a clear departure from the historical LBR seasonal trend and a sign that other forces are overpowering the election‑cycle pattern this time around.
Sources
About this seasonal analysis
Seasonal pattern data is sourced from TradeWave.ai, which analyzes historical price behavior across annual calendar windows going back up to 30 years. Read the full data methodology or the book The 100-Year Pattern by Afshin Moshrefi (2026 edition). Past performance of seasonal patterns does not guarantee future results. This article is for informational purposes only and does not constitute investment advice.