USDA Export and Planting Data Add Pressure as Corn (CME) (ZC) Nears Bearish July 8 Window
Corn (CME) futures are flat near $4.38 as traders approach a July 8 seasonal window that has historically favored short positions and coincides with heavy U.S. supply expectations.
What is the seasonal pattern for Corn (CME) (ZC)?
Corn (CME) has fallen in 9 of 10 years during this July 8 to late-August window, with an average 11.09% gain in winning short years.
- 9 for 10 in this window, with winning short years averaging 11.09% moves in the trade direction.
- Seasonal window runs from Jul 8 and spans 51 trading days, covering much of the U.S. pollination period.
- Percent Profitable is 90%, with 9 winners and 1 loser for the short-side pattern across the past decade.
- Avg Profit - All, which includes the lone losing year, is still a robust 10%, pointing to a strong bearish seasonal bias.
- Historical excursions show sizable intraperiod swings, with meaningful adverse moves even in years that ultimately finished profitable for shorts.
- Trade Direction is short, so the pattern has tended to reward downside exposure rather than rallies in this late-summer stretch.
According to historical data from TradeWave.ai, this upcoming stretch of the calendar has behaved very differently from an average month for corn futures, and the next iteration is now less than two weeks away.
How has Corn (CME) (ZC) traded in the July–August seasonal window?
Corn (CME) has delivered profitable short-side results in 9 of the past 10 years during the 51-day window that begins on Jul 8, making this one of the contract’s most consistently bearish late-summer stretches. Front-month futures settled Tuesday at 437.75 cents per bushel, roughly 9.1% below their 52-week high of 481.75 and about 18.7% above the 52-week low of 368.75, leaving prices mid-range as the pattern approaches.
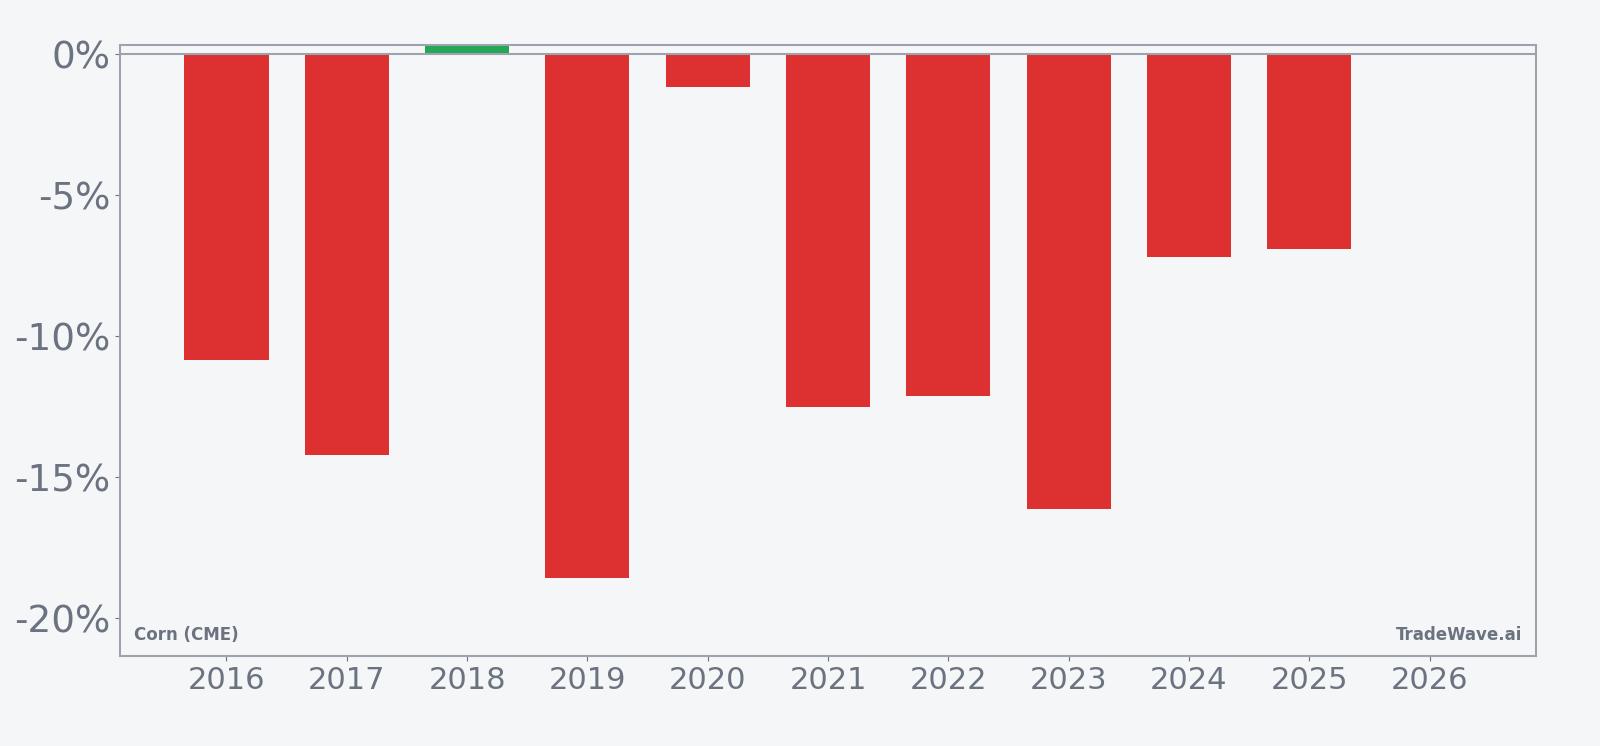
The trade direction for this pattern is short, and the statistics line up with that bias. Percent Profitable sits at 90%, with 9 winning short years and just 1 losing year across the 10-year lookback. Average profit in the winning years is 11.09%, while the all-years average, which includes the lone loss, is still a hefty 10% move in favor of shorts. The median outcome is similar at 11.5%, suggesting the typical year has not been skewed by a single outlier.
Individual years show how that plays out. In 2019, for example, entering around 438.5 cents and exiting near 357.0 produced a 18.59% gain for the short-side pattern as prices broke lower into late summer. By contrast, 2018 was the only losing year in the sample, with a small 0.29% net move against shorts despite an 8.24% best intraperiod drop that would have been favorable if captured. That mix of outcomes illustrates how timing inside the window has mattered even when the final direction has usually been lower.
Intraperiod swings have been meaningful. Maximum favorable moves in winning years have often run into the high single digits or more, while maximum adverse moves have at times pushed into double digits against the short side. In 2022, for instance, the pattern logged a 12.14% net gain for shorts but saw a worst drawdown of 27.85% from the entry before the move ultimately resolved lower, underscoring how painful squeezes can be even in years that finish in the right direction.
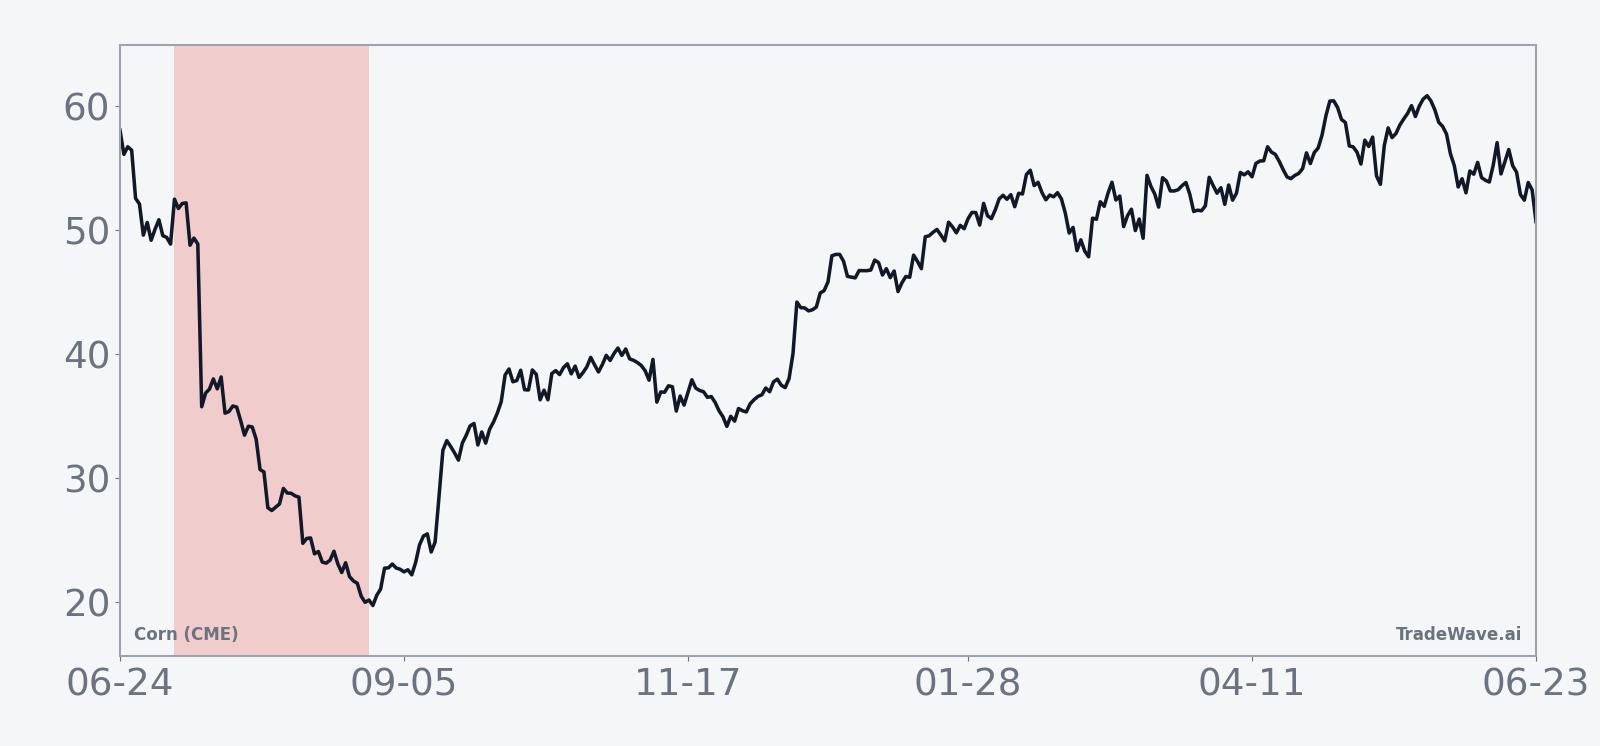
The 10-year seasonal trend chart shows that, on average, the bulk of the downside has tended to accrue in the middle of the window rather than immediately after Jul 8. The typical pattern is a period of choppy trade early on, followed by a more decisive slide as the window progresses, then some stabilization toward the end. That shape fits with years where weather and yield expectations firm up as the U.S. crop moves through pollination.
A second view that layers in best and worst intraperiod swings helps frame the risk around that average path.
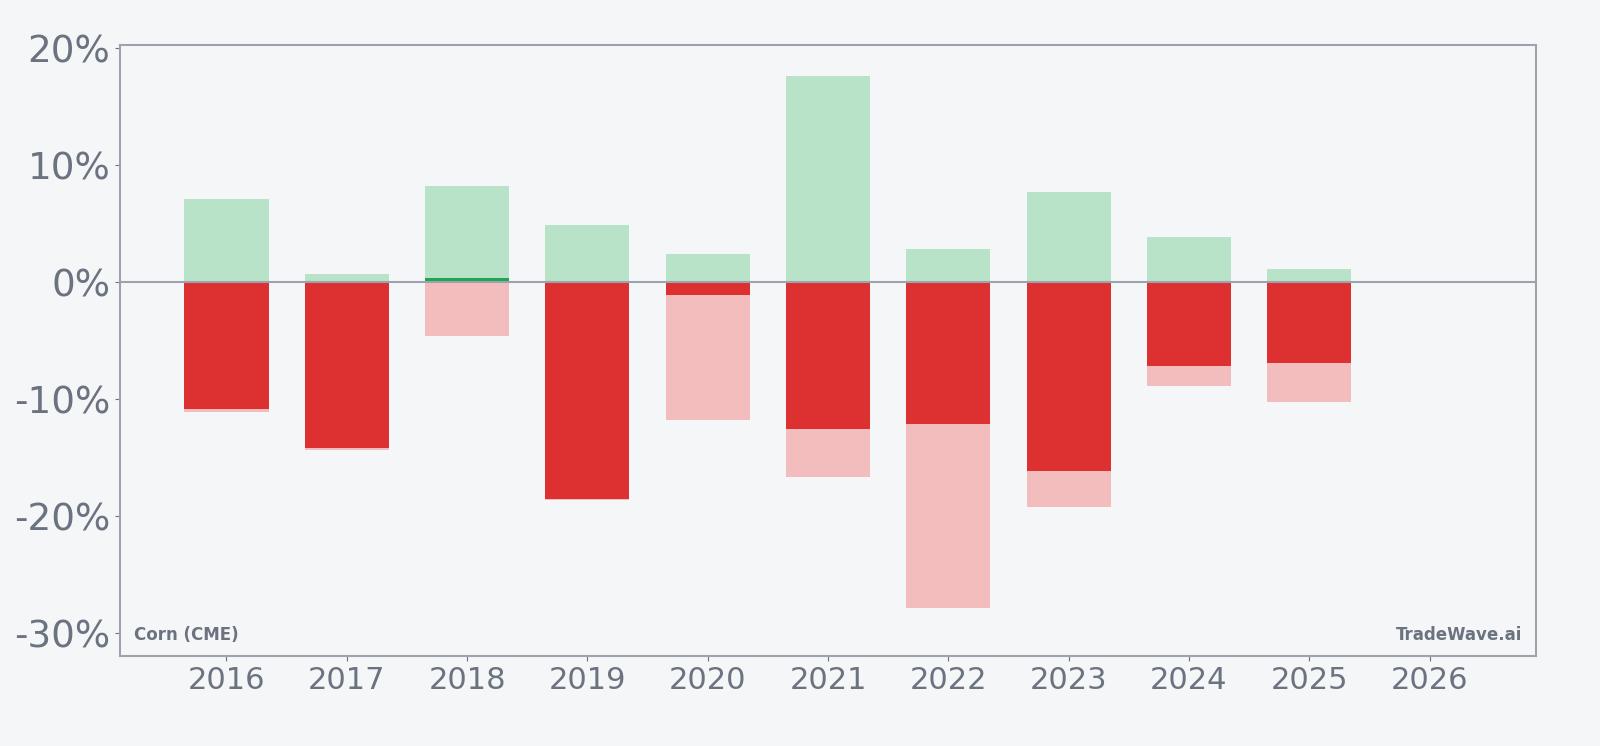
The combined net, maximum favorable, and maximum adverse excursion bars show a clear pattern: when the window works, it often works hard, but the path can be rough. Many years feature sizeable favorable moves in the trade direction alongside notable adverse spikes, which means shorts have historically been rewarded for staying with the trend but punished if they were forced to cover into weather scares or supply shocks. Add it up: 9 of 10 years have ultimately paid the short side, with a double-digit average move, yet several of those wins came with double-digit drawdowns along the way.
History does not guarantee future results; adverse excursions (MAE) can be large even in winning windows.
Why does Corn (CME) (ZC) follow this seasonal pattern?
This late-summer pattern likely reflects classic corn supply and demand seasonality. One likely driver is that by July and August, U.S. planting is complete and weather visibility improves, so markets often shift from fear of tightness toward more confidence in final yields. Analysts have also pointed to the timing of USDA supply updates and export sales reports in this period, which can reinforce a bearish tone when ending stocks are comfortable and global buyers have already booked much of their near-term demand.
What is driving Corn (CME) (ZC) today?
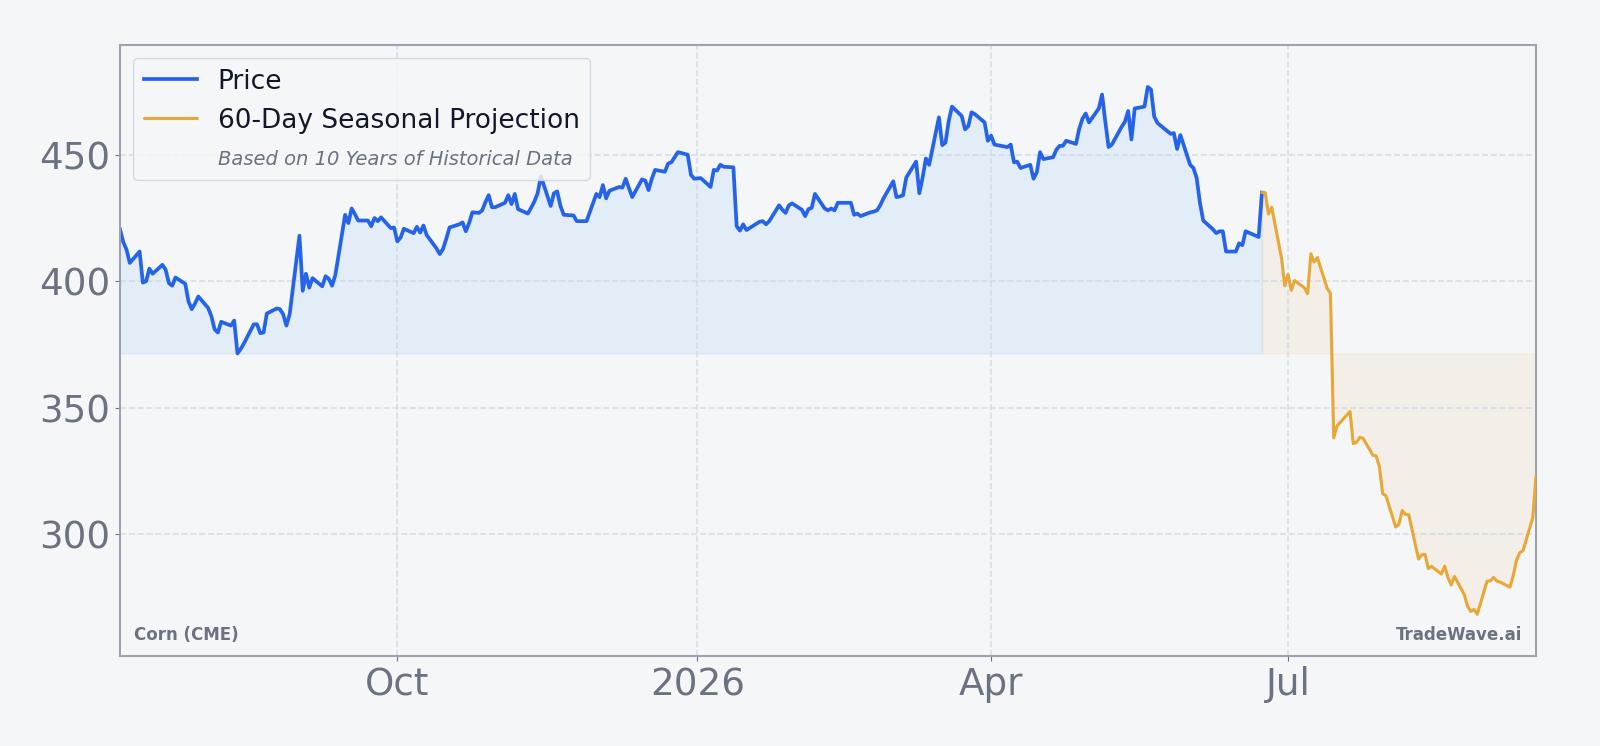
Front-month Corn (CME) futures ended the latest session unchanged at 437.75 cents, leaving the contract about 9.1% below its 52-week high and roughly 18.7% above the 52-week low. Volumes are light at 3,755 contracts on the day versus a 20-day average near 234,925, and prices sit modestly below the 50-day moving average of 446.865, signaling a market that has cooled from spring levels but is not yet in a deep bear trend.
On the fundamental side, the most recent World Agricultural Supply and Demand Estimates from the U.S. Department of Agriculture showed U.S. corn ending stocks at 2.23 billion bushels, a level that points to comfortable domestic supply and has weighed on prices compared with tighter years.[1] Weekly export sales and an improved U.S. planting and weather outlook have also shaped sentiment, with traders watching whether overseas demand can absorb the larger crop or if inventories will continue to build into the new marketing year.[2] With U.S. ending stocks already elevated and the key pollination period approaching, the upcoming seasonal window will intersect directly with the market’s judgment on how much of that supply cushion persists.
The chart below situates the latest move in its recent multi-month context and overlays a short-term seasonal projection.
What should traders watch as this seasonal window approaches?
Into the Jul 8 start date, the key watchpoints are macro, weather, and inventory. On the macro side, any shift in U.S. dollar strength or global growth expectations could alter export competitiveness and either reinforce or blunt the usual late-summer softness in corn. Weather will be critical: if forecasts turn hotter and drier during pollination, the market has a history of spiking first and sorting out the seasonal pattern later, which is where those large historical adverse excursions have come from.
On the supply and demand front, traders will track upcoming USDA WASDE updates and weekly export sales to see whether the 2.23 billion bushel ending-stocks projection tightens or loosens.[1][2] A steady or higher stocks path would rhyme with the historical bearish seasonal trend, while a surprise demand surge or weather-driven yield cut could challenge it. Price-wise, the 52-week band between roughly 369 and 482 cents offers a simple map: behavior inside the window that pushes Corn (CME) back toward the lower third of that range would be consistent with the 9-for-10 short-side record, while a sustained break above the 50-day moving average and toward the 52-week high would mark a clear departure from the usual pattern.
For now, the takeaway is straightforward. Corn (CME) is heading into a calendar stretch that has repeatedly rewarded downside exposure, at a time when U.S. balance sheets look comfortable and weather risk is about to be repriced in real time. If the contract starts to roll over as the window opens and USDA data keep pointing to ample supply, that would look like another year in line with the historical script. If instead prices grind higher on weather scares or stronger exports, traders will know this is one of those rare seasons when the late-summer pattern breaks.
Sources
About this seasonal analysis
Seasonal pattern data is sourced from TradeWave.ai, which analyzes historical price behavior across annual calendar windows going back up to 30 years. Read the full data methodology or the book The 100-Year Pattern by Afshin Moshrefi (2026 edition). Past performance of seasonal patterns does not guarantee future results. This article is for informational purposes only and does not constitute investment advice.