9 of 10 Early-July Windows End Lower for Lean Hogs (LH) as Short-Side Edge Returns
Lean Hogs is approaching a July trading window that has historically favored the short side, just as prices hover below recent highs and traders weigh supply, demand and positioning into midsummer.
What is the seasonal pattern for Lean Hogs (LH)?
Lean Hogs has fallen in 9 of 10 years during this early-July 30-day window, with an average gain of 15.68% in winning short years.
- 9 for 10 in this window, with winning short years averaging 15.68% moves in the trade direction.
- The 30-day seasonal window begins on Jul 2 and has historically been a weak stretch for Lean Hogs prices.
- Percent Profitable is 90%, with 9 winners and 1 loser across the past decade of this pattern.
- Including all years, the average outcome is a 14% move in favor of the short-side setup.
- The strongest year in the sample saw a 31.8% drop in prices from entry to exit, while the lone losing year was modest.
- Intraperiod swings have been sizable, so traders have faced meaningful drawdowns even in years that ultimately finished in the pattern’s favor.
According to historical data from TradeWave.ai, this upcoming early-July stretch in Lean Hogs has behaved very differently from an average month on the calendar, and the next iteration is only days away.
How has Lean Hogs (LH) traded in this early-July seasonal window?
Lean Hogs has dropped in 9 of the past 10 years during the 30-day window that starts on Jul 2, making it one of the contract’s most consistently bearish seasonal stretches for short-side traders. The pattern kicks in with the market trading not far below its 52-week high of 113.375, after a choppy spring that has already seen a one-month pullback of 5.15% from recent levels. That combination of a softening tape into a historically weak midsummer window is why many livestock desks keep a close eye on this part of the calendar.
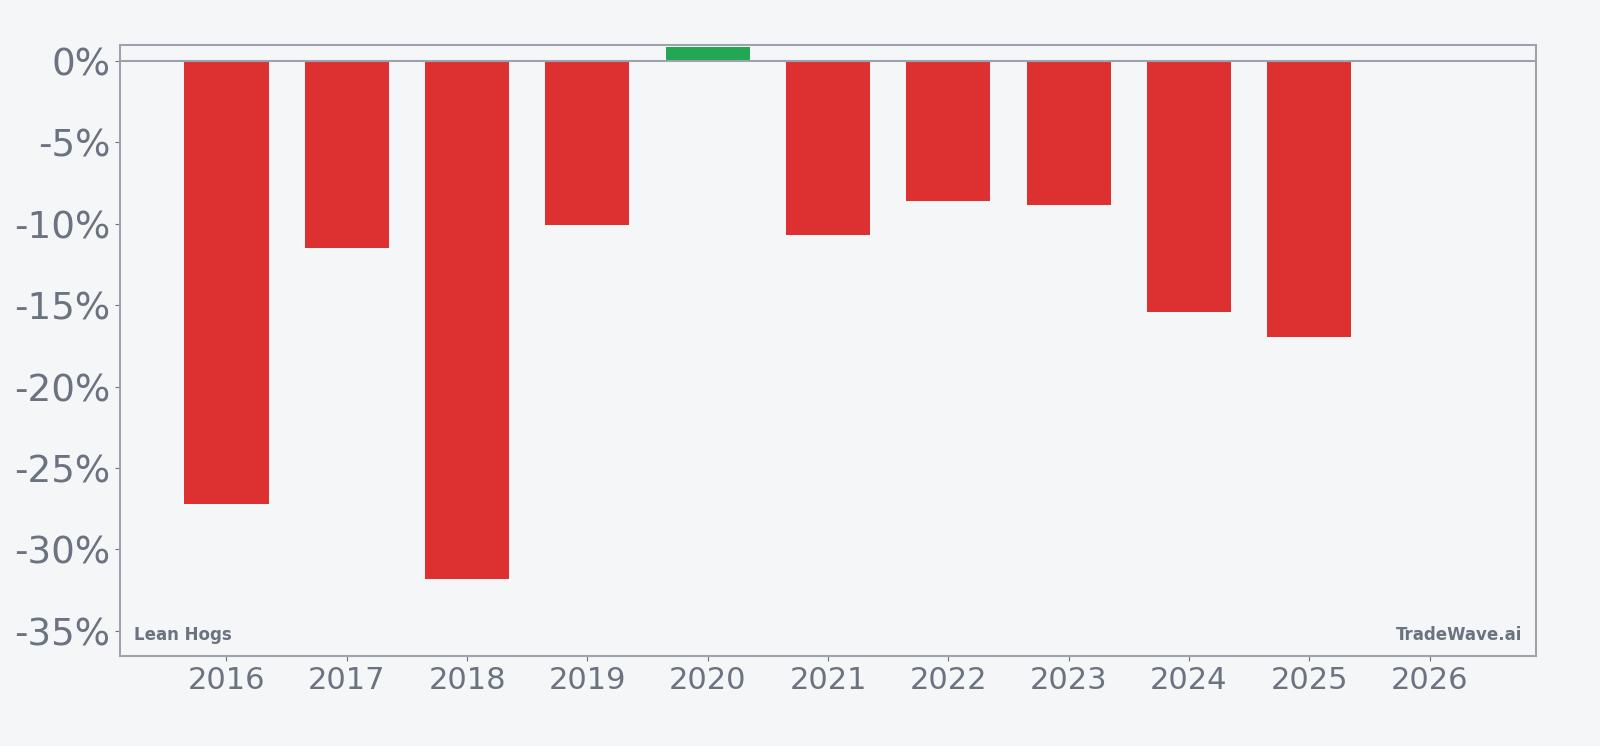
Across the 10-year lookback, the short-side pattern has been both consistent and sizable. Percent Profitable sits at 90%, with 9 winners and just 1 losing year, and the average move in winning years is 15.68% in favor of shorts. When every year is included, the average outcome is still a 14% move in the trade direction, which means the lone losing year was relatively contained compared with the stronger downswings.
The per-year table shows 2018 as the standout, with a 31.8% price drop from entry to exit and a worst intraperiod drawdown of 32.61% from the starting level. At the other end of the spectrum, 2020 was the only year that finished against the pattern, with a small 0.86% move higher in prices despite a maximum favorable move of 5.84% in the short direction before the contract reversed. That mix of one mild miss and several deep hits is what drives the relatively high Sharpe ratio of 1.44 for this window.
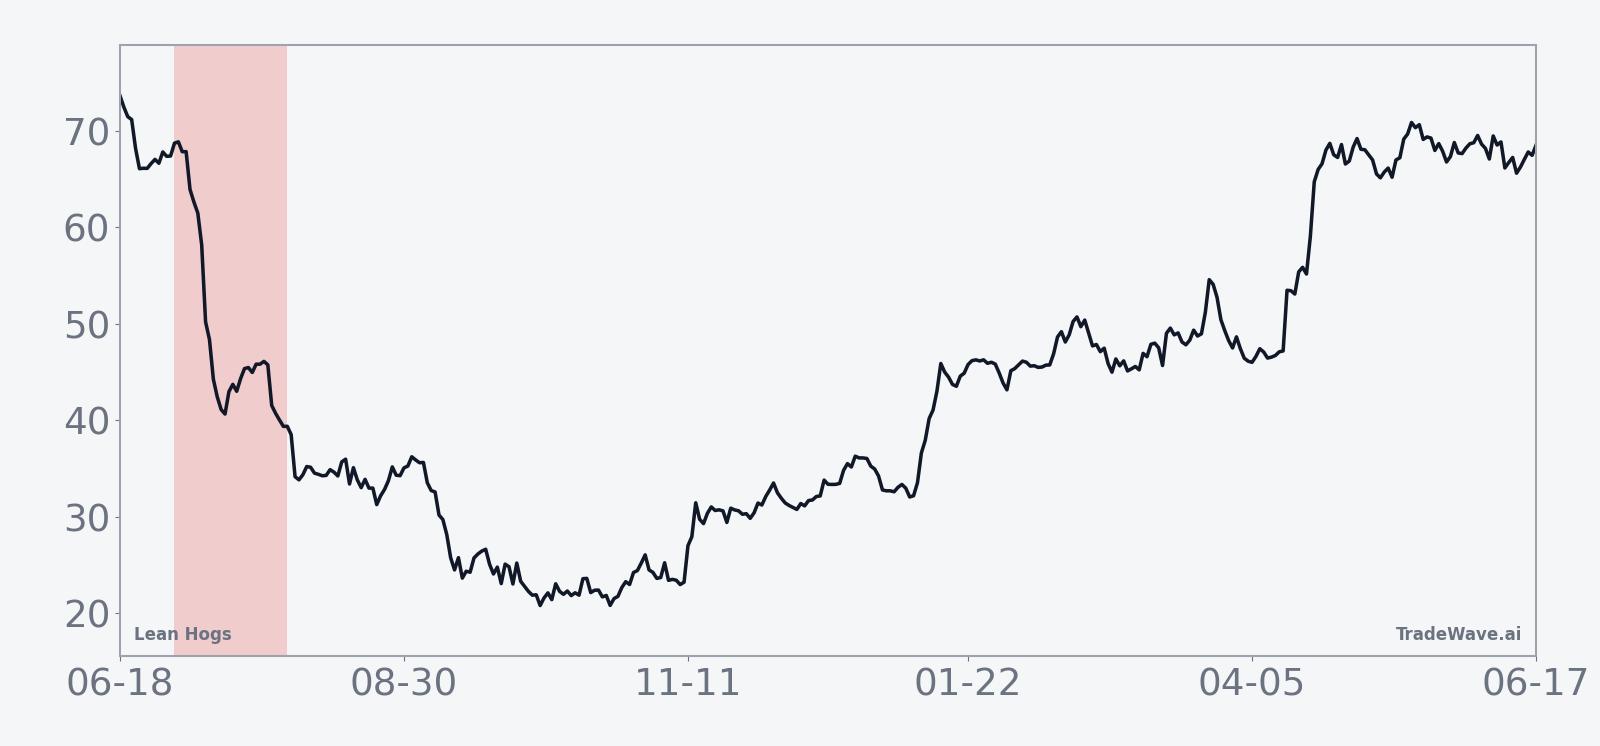
The historical seasonal average suggests that much of the move in this Lean Hogs trading window tends to occur in the middle of the 30-day span rather than in a single sharp break at the start. Returns often build as the window progresses, with a tendency for prices to grind lower over several weeks instead of collapsing in one session. That profile can matter for risk management, because it implies more opportunity to adjust exposure as the pattern unfolds.
Year-by-year net results, along with peak favorable and worst adverse moves, show how much room Lean Hogs has historically given both shorts and longs inside this window.
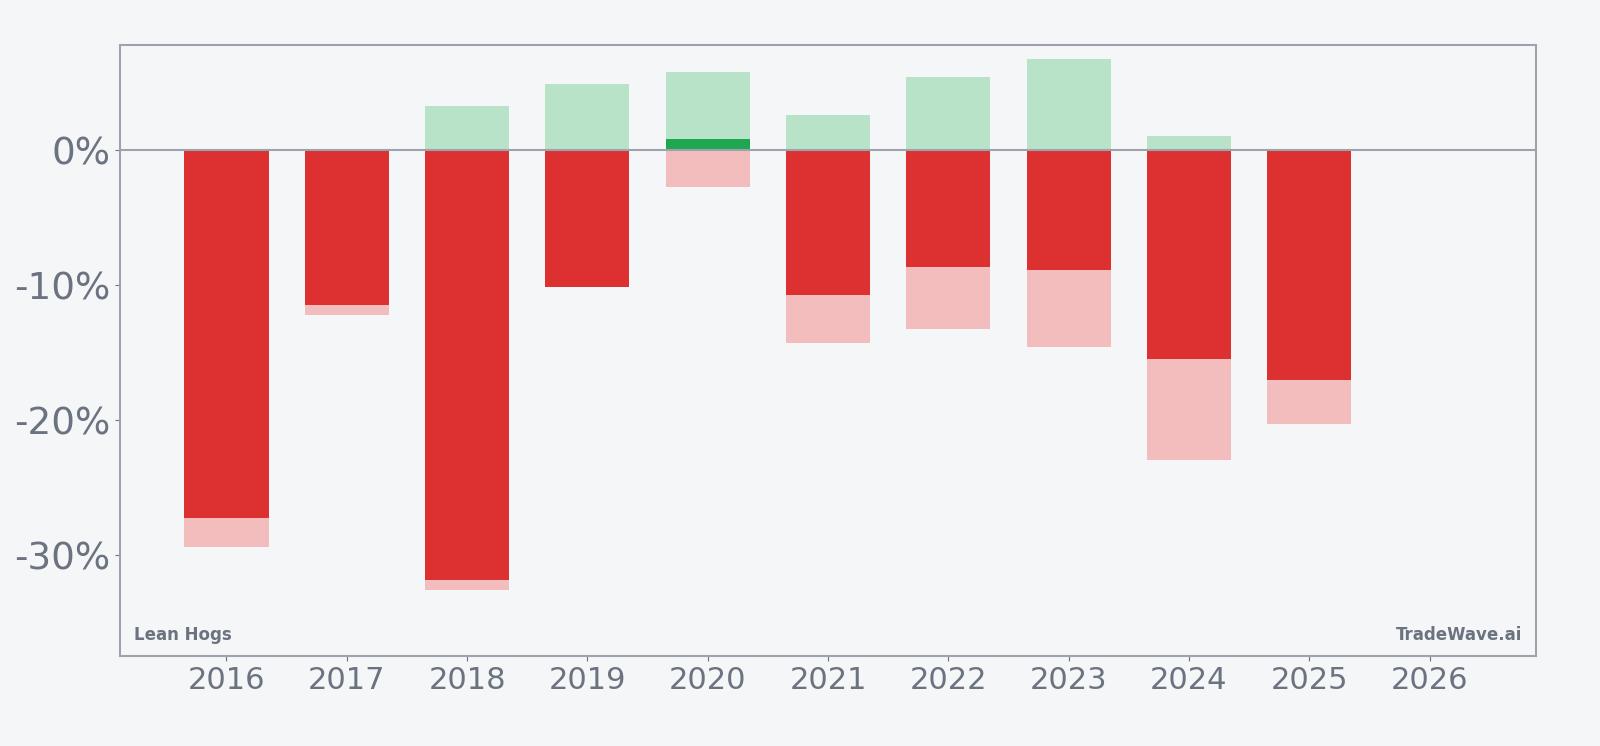
The combined net, maximum favorable excursion and maximum adverse excursion view underlines that this is a high-energy seasonal stretch. In strong years like 2016 and 2018, shorts saw both large net gains and deep maximum favorable moves, while MAE readings showed that adverse bounces against the trend were often limited. In other years, MAE has been more pronounced, reminding traders that even a historically bearish window can feature sharp countertrend rallies before the pattern reasserts itself.
History does not guarantee future results, and adverse excursions can be large even in windows that ultimately finish in the pattern’s favor.
Why does Lean Hogs (LH) follow this seasonal pattern?
This early-July Lean Hogs seasonal pattern likely reflects commodity supply and demand seasonality more than technical quirks. Analysts often point to midsummer shifts in slaughter rates, carcass weights and retail demand as grilling season peaks and then begins to fade, which can pressure prices after earlier-year rallies. The pattern may also capture how packers and producers hedge forward exposure around key USDA reports and summer weather, creating a recurring pocket of selling pressure in the futures curve.
What is driving Lean Hogs (LH) today?
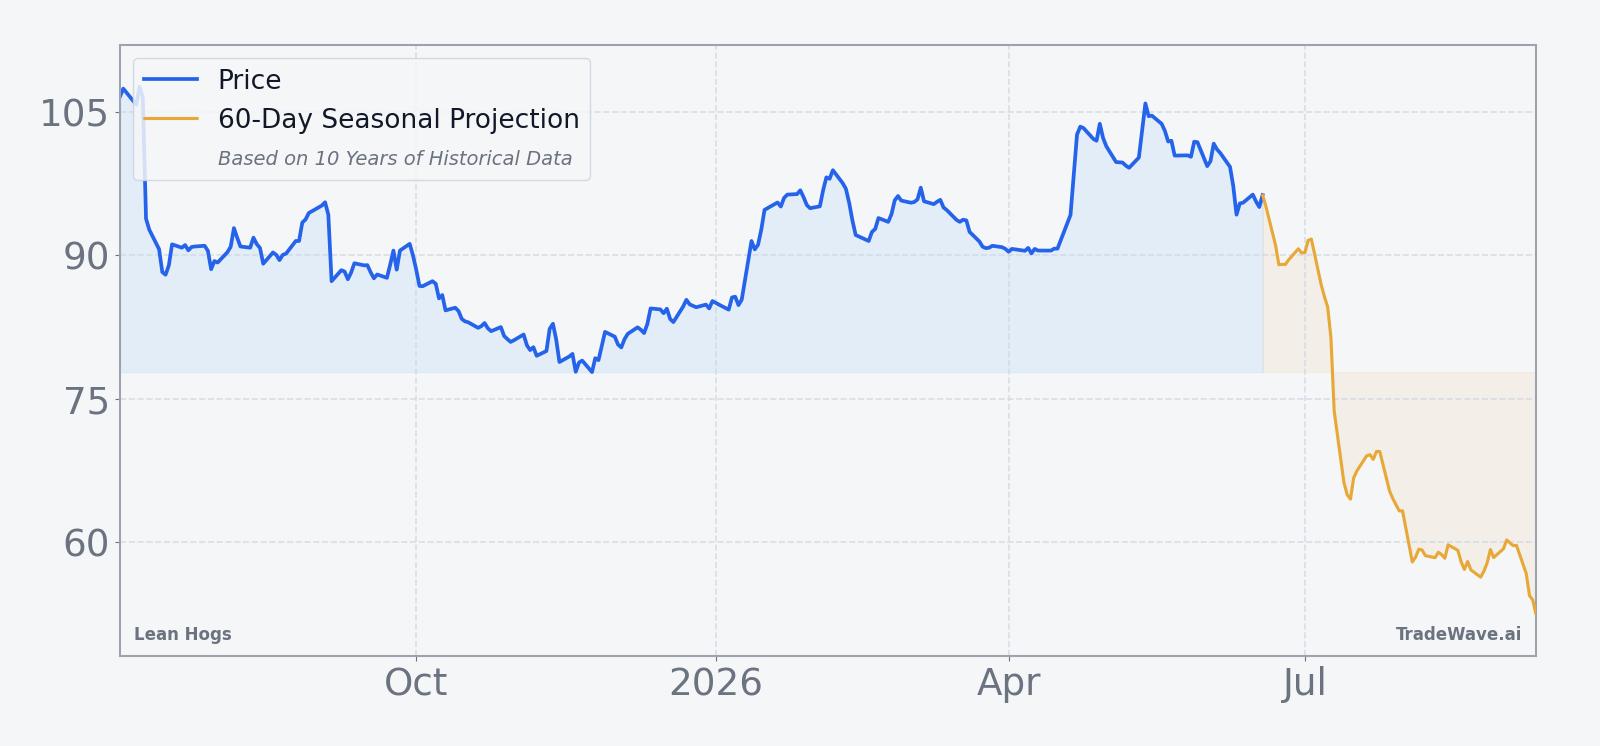
With no fresh fundamental headlines on Jun 23, Lean Hogs is trading in the shadow of its recent high near 113.375 and digesting a one-month slide of 5.15% from prior levels. The front-month contract last settled at 96.725 on Jun 18, leaving it well above the 52-week low of 77.125 but below the 50-day moving average of 98.2205, a sign that momentum has cooled even as prices remain elevated on a longer-term chart. Average 20-day volume of 26,958.65 contracts points to healthy liquidity as traders weigh whether the latest pullback is a pause in a broader uptrend or the start of a more meaningful seasonal downswing.
The chart below situates the latest move in its recent multi-month context and overlays the upcoming 60-day seasonal projection.
From a macro standpoint, Lean Hogs sits at the intersection of consumer meat demand, feed costs and broader inflation expectations. Softer grain prices can encourage heavier hog weights, while any cooling in headline inflation can temper speculative interest in livestock as an inflation hedge. At the same time, export flows and currency moves influence how aggressively overseas buyers step into the U.S. market, which can either amplify or blunt the seasonal weakness that has often emerged in July.
On the supply and demand side, midsummer is a key checkpoint. Producers are watching carcass weights, slaughter schedules and packer margins as the peak grilling season matures, and any sign of softer wholesale pork prices can quickly feed back into futures. If packers pull back on bids or cold storage data show inventories building, the historical July pattern of lower Lean Hogs prices has often had fundamental backing. Conversely, a surprise tightening in supplies or stronger-than-expected export demand could challenge the usual seasonal script.
Positioning is another wildcard. While detailed CFTC data are not included here, the pattern of strong short-side performance in this window suggests that speculative traders have often leaned into the seasonal weakness, either by adding outright shorts or by reducing long exposure. If that behavior repeats, the early-July window could again see volatility pick up as funds rebalance and commercial hedgers adjust coverage into the back half of summer.
What should traders watch as the July Lean Hogs window opens?
As Jul 2 approaches, the key for traders is how Lean Hogs behaves around current resistance and the 50-day moving average. A failure to reclaim the 98.2205 area with conviction would fit the historical pattern of weakness into this 30-day window, while a decisive break higher would signal that the market is willing to fight the seasonal trend. Price action relative to the 52-week high near 113.375 will also matter, because fresh highs into a historically bearish stretch have sometimes preceded sharper reversals.
Fundamentally, watch upcoming USDA hog and pork reports, any updates on slaughter pace and carcass weights, and cold storage data that might hint at inventory build or drawdown. If those numbers point to comfortable supplies and moderating demand, they would align with the decade-long tendency for Lean Hogs to soften in July. If instead the data show tightening availability or robust export bookings, that would be an early sign that this year’s window could diverge from the usual script.
Finally, monitor volume and open interest as the window begins. Rising volume on down days would suggest that fresh selling is joining the move, consistent with the historical pattern of strong short-side performance. A lack of follow-through, or heavy short covering on any bounce, would argue that the market is treating this July more as a consolidation phase than as a repeat of prior seasonal breaks. In a contract that has fallen in 9 of the last 10 early-July windows, how Lean Hogs trades through this stretch will tell traders a lot about whether the long-running seasonal trend is still in force.
Sources
About this seasonal analysis
Seasonal pattern data is sourced from TradeWave.ai, which analyzes historical price behavior across annual calendar windows going back up to 30 years. Read the full data methodology or the book The 100-Year Pattern by Afshin Moshrefi (2026 edition). Past performance of seasonal patterns does not guarantee future results. This article is for informational purposes only and does not constitute investment advice.