Lumber (CME) (LBR) Has Dropped in 9 of 10 Midterm July Windows, With Shorts Averaging 7.93%
Lumber (CME) is trading well below its 52-week high just as a midterm-year July seasonal window that has favored short positions in most past cycles opens again.
Price as of Jul 1, 2026: $624.00 (last close).

What is the seasonal pattern for Lumber (CME) (LBR)?
Lumber (CME) has fallen in 9 of 10 midterm-year July windows during this 25-day stretch, with an average 7.93% gain in winning short years.
- 9 for 10 in this window, with short positions averaging 7.93% gains in winning years.
- Percent Profitable is 90%, with 9 winning years for shorts and just 1 losing year.
- Across all years, including the lone loss, the average return for the short setup is 7%.
- The window runs 25 calendar days from Jul 2 and is based on the last 10 midterm election years.
- Maximum favorable and adverse moves inside the window have both been large, pointing to sharp swings even when the final result is profitable for shorts.
- Trade Direction is short, so rallies have historically been the risk, not the goal, in this pattern.
According to historical data from TradeWave.ai, this midterm-year July stretch in lumber behaves differently from a typical summer month, with a clear bias that traders often overlook.
How has Lumber (CME) (LBR) traded in this midterm-year July window?
Lumber (CME) has moved lower in 9 of the last 10 midterm election years during the 25 calendar days starting Jul 2, making this one of the contract’s most reliable short-side seasonal windows. The new window opens with front-month futures around 624, leaving the market about 10.7% below its 52-week high near 698.5 and well off last year’s extremes. That combination of a historically bearish midterm-year slice and a market still trading far under its prior peak gives hedgers and speculators a defined calendar to watch as summer construction demand meets policy uncertainty.
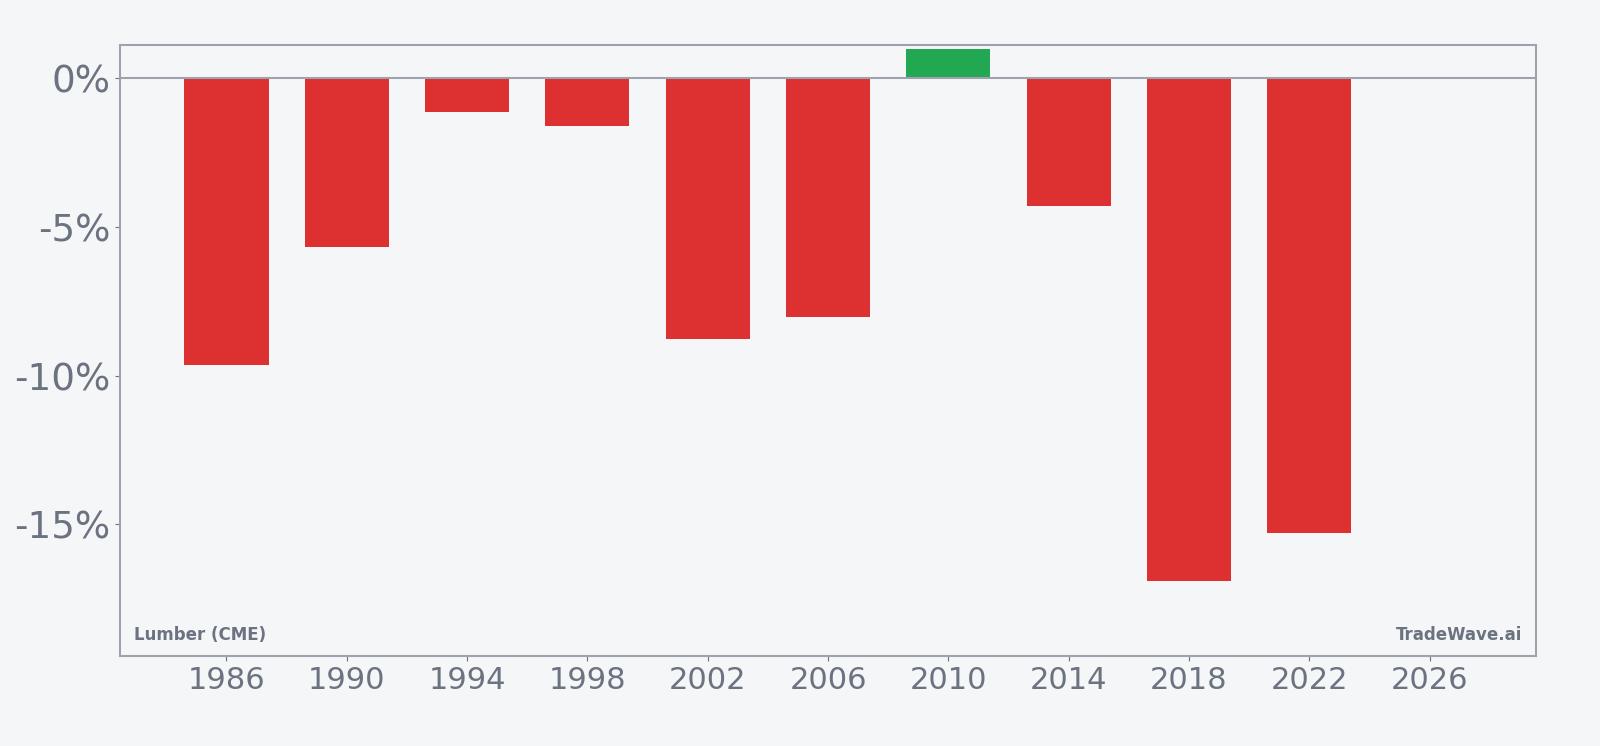
Because this pattern is grouped by the presidential election cycle, it only looks at midterm election years, not every calendar year. That matters for lumber because midterms often coincide with shifting fiscal priorities, infrastructure debates and rate-policy uncertainty, all of which can hit housing and construction demand at the same time seasonal building activity is still elevated.
The trade direction for this window is explicitly short. In other words, the historical pattern is evaluated from the perspective of traders who sold lumber at the start of the window and covered 25 calendar days later. With 90% of those midterm-year samples ending profitably for shorts and only one losing year, the bias has been clear across the last ten cycles.
Average profit in the winning short years is 7.93%, while the average across all ten years, including the lone loss, is still 7%. That gap between Avg Profit and Avg Profit - All is small, which tells you the losing year did not fully erase the gains from the winners. For a short pattern, that is unusual and speaks to how consistently prices have tended to soften in this slice of the calendar.
Looking at individual years shows how that plays out. In 2018, a short entered around 575.5 and exited near 478.2, a net move of about 16.9% in favor of the short as lumber unwound from a spike in prices. In 2022, a similar setup from roughly 656.9 to 556.5 delivered a 15.28% gain for shorts as the market cooled from pandemic-era volatility. Even the milder years, such as 1994 and 2014, still produced modest net declines that lined up with the broader pattern.
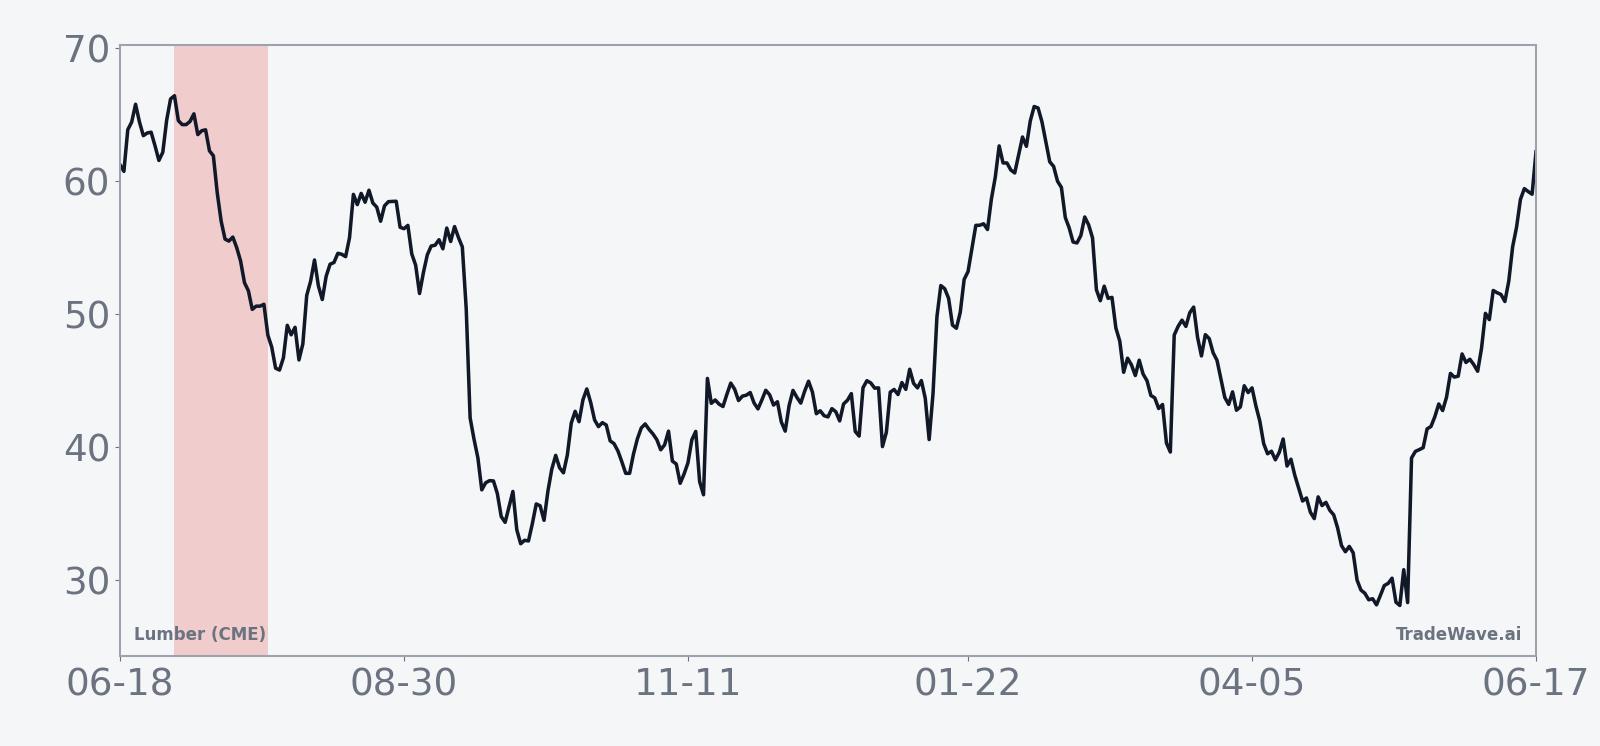
The historical seasonal trend line for this window slopes steadily lower rather than chopping sideways. That suggests the typical pattern is not a quick air pocket followed by a rebound, but a grind lower across most of the 25 days, which has favored patient short positioning rather than intraday scalps.
A closer look at yearly net returns alongside peak favorable and adverse moves shows how much lumber has tended to swing inside the window.
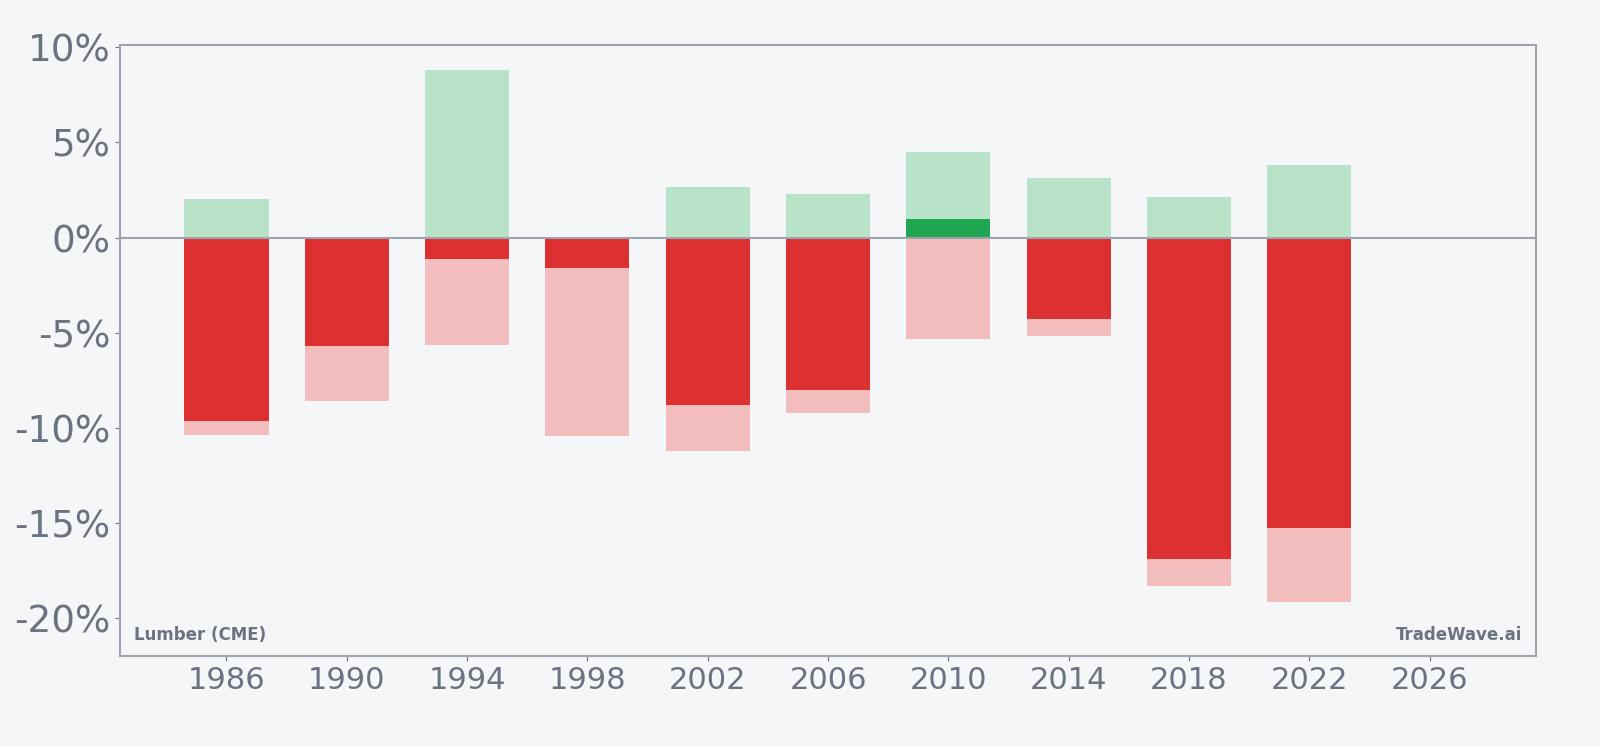
The combined net, maximum favorable move and maximum adverse move bars show that even in winning years, lumber has often swung hard in both directions. In 2022, for example, the best intraperiod move from entry (the maximum favorable excursion) was significantly larger than the final net decline, while the worst drawdown from entry (the maximum adverse excursion) still reached into double digits. That profile fits a market where shorts have usually been rewarded by the close, but have had to sit through sharp countertrend rallies along the way.
History does not guarantee future results; adverse excursions can be large even in winning windows, and traders can be forced out before the seasonal pattern plays out.
Why does Lumber (CME) (LBR) follow this seasonal pattern?
This midterm-year July pattern likely reflects a mix of commodity supply and demand seasonality and the policy calendar. One likely driver is that early-summer construction demand often peaks by July, just as builders reassess orders and mills adjust output, which can soften prices after spring strength. At the same time, midterm election years frequently bring uncertainty around housing policy, infrastructure spending and interest rates, which can cool risk appetite in rate-sensitive commodities like lumber even before the pre-election year’s typical risk-on tone arrives.
What is driving Lumber (CME) (LBR) today?
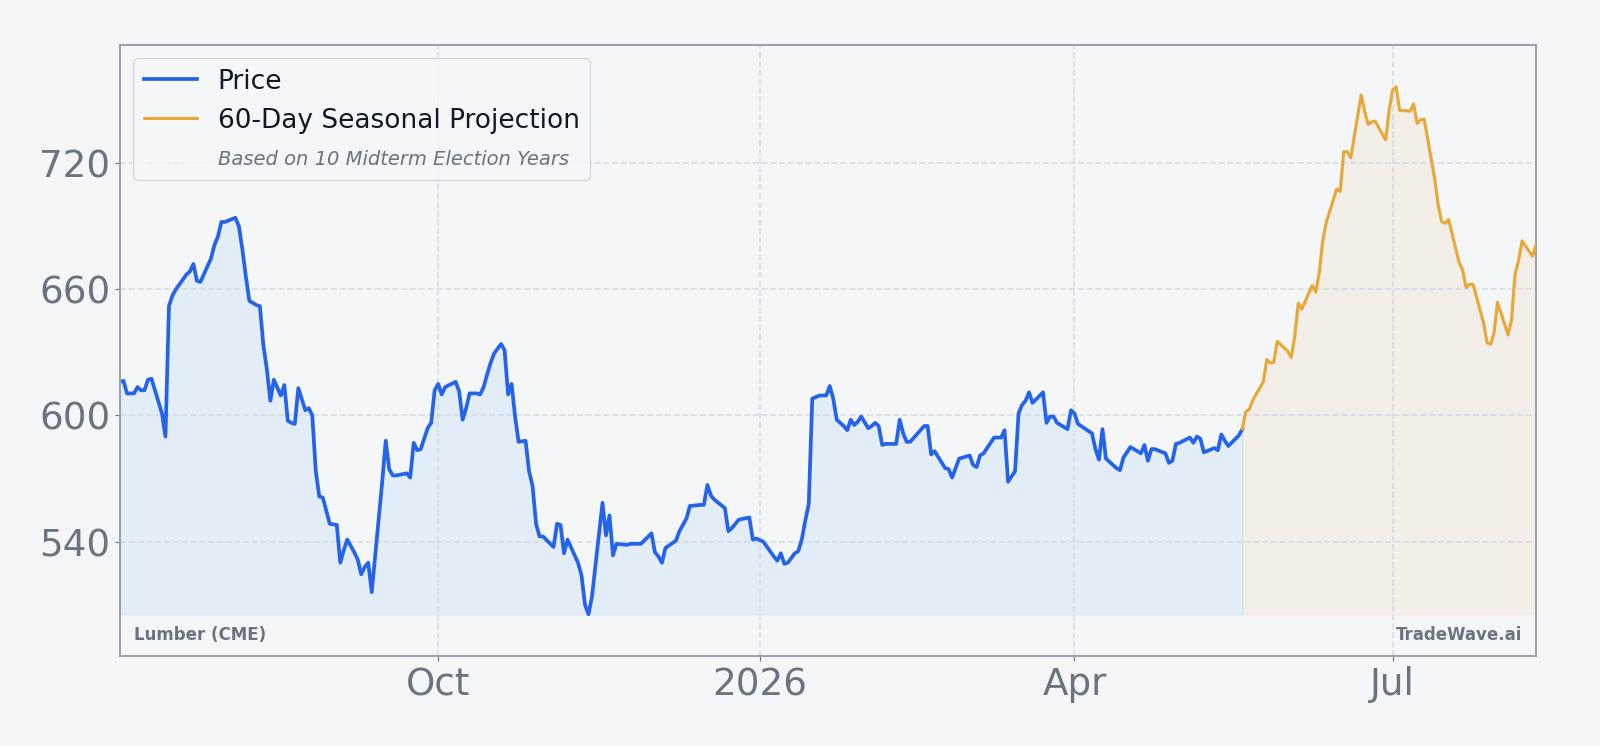
Lumber futures settled around 624 in the latest session, down 0.24% on the day, and sit roughly 10.7% below the 52-week high of 698.5. That comes after a 3.3% gain over the past month and a modest 0.41% rise over the past year in benchmark CFD pricing, a profile that looks more like a slow recovery than a runaway bull market.[1] CME data show active trading in near-term contracts such as the September 2026 LBRU6, with volumes in the high hundreds, underscoring that liquidity is concentrated in the front of the curve as traders position around construction demand and rate expectations.[3]
The chart below situates the latest move in its recent multi-month context and overlays the next 60 days of seasonal projections.
On the macro side, lumber’s modest year-over-year gain suggests that supply and demand have largely rebalanced after the extreme swings of the pandemic era, even as housing markets continue to digest higher interest rates.[1] CME’s product slate shows a full strip of lumber futures and options across multiple months, giving builders, mills and funds several ways to hedge or express views on this seasonal window.[2] For traders watching the LBR seasonal trend, the key question is whether this midterm-year July stretch again delivers the kind of steady softening that has historically rewarded shorts, or whether a different macro mix finally produces the second losing year in the sample.
What should traders watch in this midterm-year July window?
Three things will matter most as this 25-day window unfolds. First, price behavior relative to the historical seasonal path: if lumber starts to drift lower in line with the past midterm-year pattern, that would confirm that the familiar July soft patch is still in play. A fast break below recent support levels while staying well under the 52-week high would fit that script.
Second, watch construction and housing data, along with any policy headlines that could shift expectations for infrastructure spending or mortgage rates. Midterm years often bring noisy debates in Washington, and any sign of delayed projects or tighter financing can quickly feed into lumber demand expectations, amplifying the seasonal tendency.
Third, monitor futures volumes and open interest in the front contracts. CME quotes already show active trading in near-term months, and a further pickup in volume or a sharp change in positioning would signal that larger players are leaning into this window rather than fading it.[3][4] If prices instead grind higher on rising volume, that would be a clear break from the historical pattern and a sign that this midterm-year July stretch is trading on a different playbook.
Put together, the setup is straightforward: lumber is well off its highs, liquidity is concentrated in the front of the curve, and a midterm-year July window that has gone 9-for-10 for shorts is opening again. The next few weeks will show whether history’s bias toward lower prices in this slice of the calendar still carries weight in a post-pandemic, higher-rate world.
Sources
About this seasonal analysis
Seasonal pattern data is sourced from TradeWave.ai, which analyzes historical price behavior across annual calendar windows going back up to 30 years. Read the full data methodology or the book The 100-Year Pattern by Afshin Moshrefi (2026 edition). Past performance of seasonal patterns does not guarantee future results. This article is for informational purposes only and does not constitute investment advice.