Lean Hogs (LH) Faces Fresh July Downside as 97¢ Futures Near 10-for-10 Bearish Window
Lean Hogs futures sit near 97 cents with prices well off last year’s highs as a July seasonal window that has favored short positions for a decade comes back into view.
Price as of Jul 1, 2026: $97.05 (last close).
What is the seasonal pattern for Lean Hogs (LH)?
Lean Hogs has fallen in 10 of 10 years during this early-July 27-day window, with an average gain of 12.02% in winning short trades.
- 10 for 10 in this window for short positions, with average winning trades returning 12.02% over 27 days.
- The upcoming pattern runs from Jul 6 for 27 calendar days and has historically been a bearish seasonal stretch for Lean Hogs prices.
- Percent Profitable is 100%, with 10 winners and 0 losers across the past decade of this Lean Hogs trading window.
- Average profit in winning years is 12.02%, with a median outcome of 12.18%, pointing to consistent downside pressure in this July seasonal pattern.
- Intraperiod swings have been large, with several years showing double-digit adverse moves before prices ultimately broke lower.
- The TradeWave Ratio of 1.97 and Sharpe ratio of 1.84 signal a historically strong and directional short-side seasonal trend.
According to historical data from TradeWave.ai, this early-July stretch in Lean Hogs has behaved very differently from an average month on the calendar, with a clear short-side bias emerging over the past decade.
How has Lean Hogs (LH) traded in this early-July seasonal window?
Lean Hogs has dropped in every single iteration of this 27-day early-July window for 10 straight years, delivering an average 12.02% gain for short positions. The next window begins on Jul 6 with futures last settling at 97.05 cents per pound on Jul 1, well below the 52-week high of 111.775 and still comfortably above the 77.125 low for the year. That combination of a decade-long bearish seasonal pattern and a market trading in the middle of its recent range puts fresh focus on how producers and speculators manage downside risk into mid-summer.
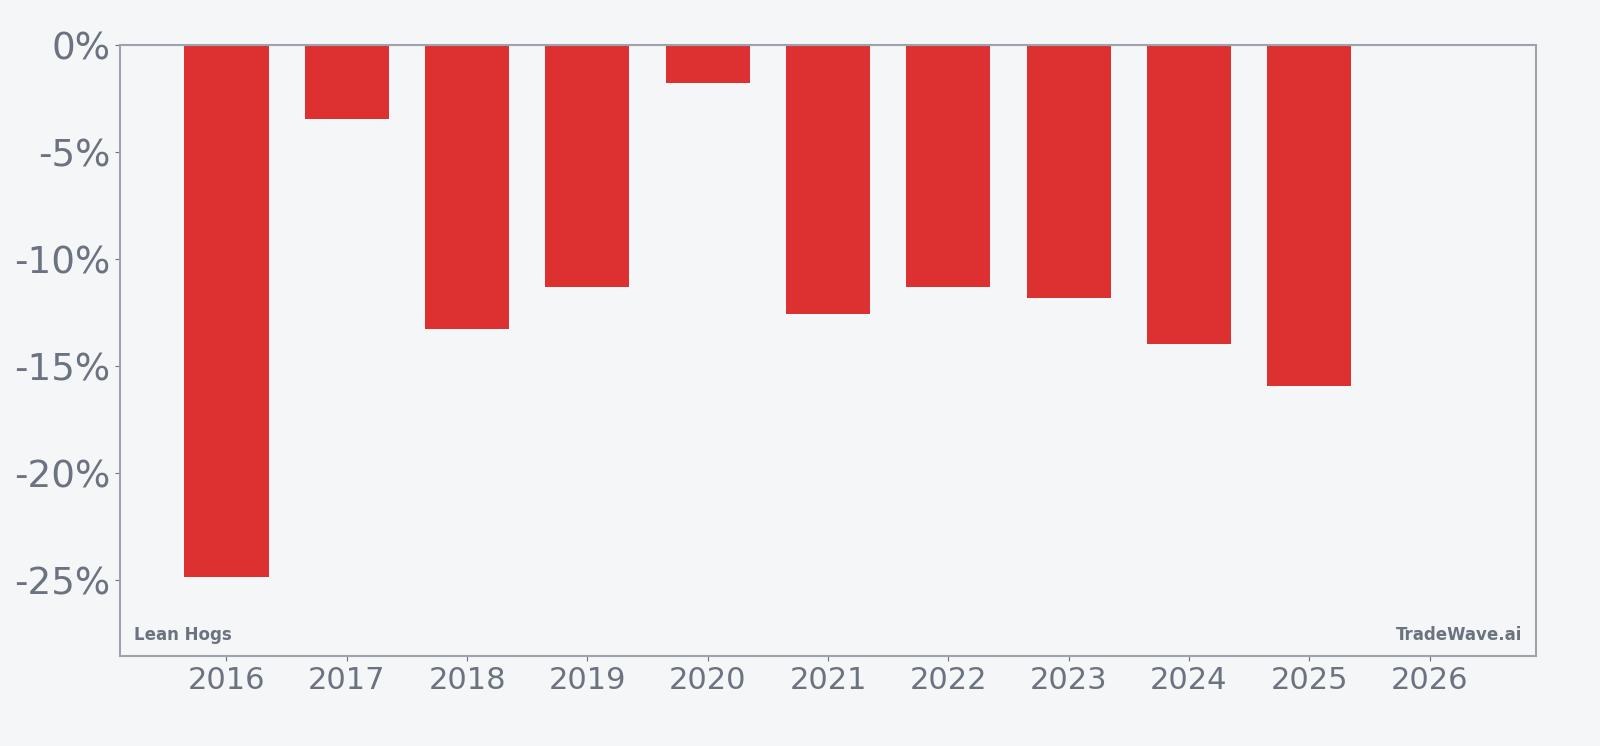
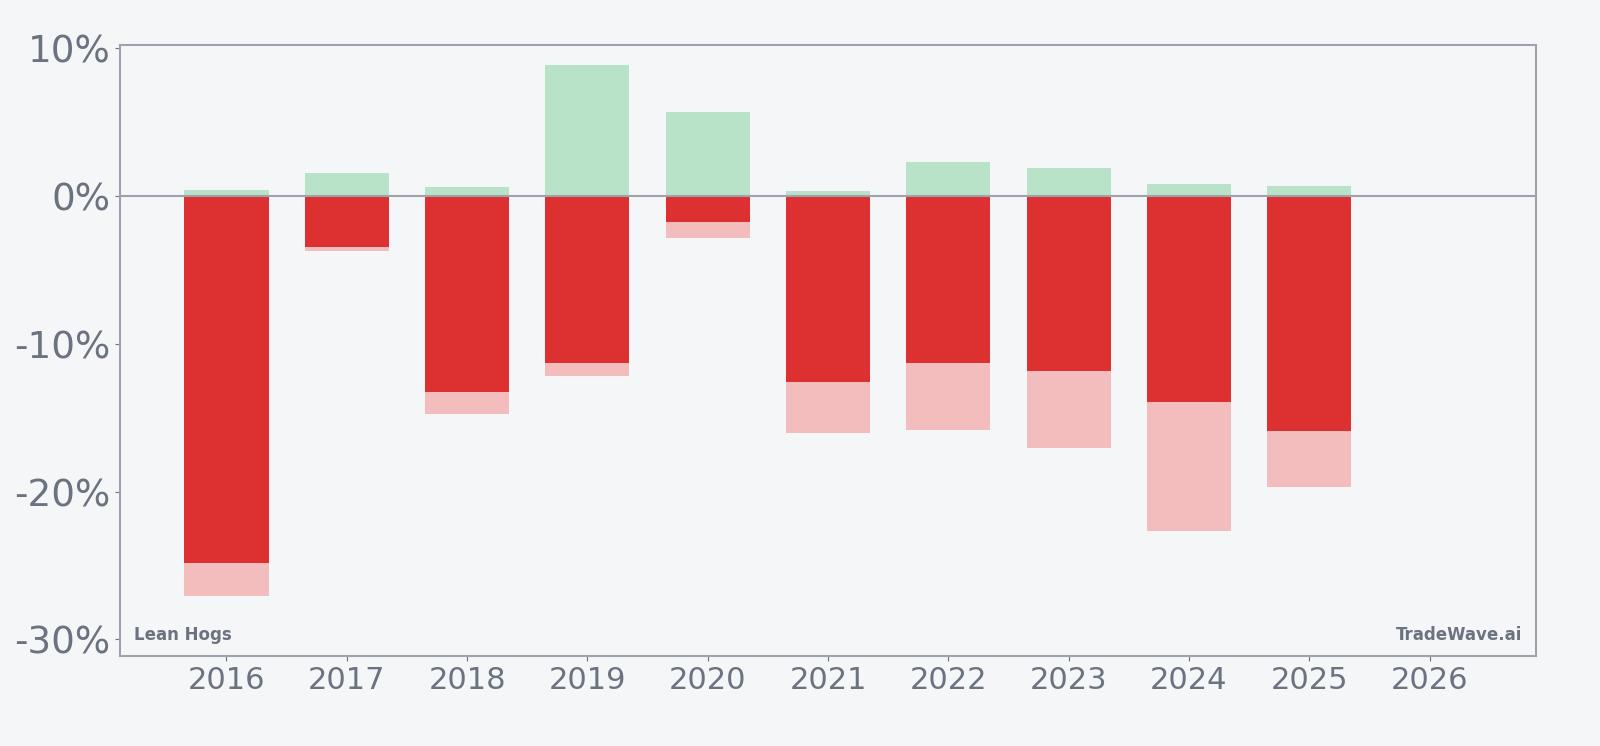
Year-by-year net returns and intraperiod swings show how consistently this window has rewarded shorts while still delivering sizable drawdowns along the way.
The historical stats line up cleanly with the charts. Across the past decade, every early-July window has produced a negative net return for Lean Hogs prices, which translates into a 100% hit rate for the short-side seasonal strategy and a cumulative return of 206% for repeated shorts. Average profit per winning year is 12.02%, with a median of 12.18%, and the risk-adjusted Sharpe ratio of 1.84 is unusually strong for a commodity pattern of this length.
The per-year table shows how that plays out in practice. The strongest year for shorts was 2016, when Lean Hogs fell 24.84% from an entry near 80.625 cents to an exit around 60.6 cents during the window. The softest outcome was 2020, when prices slipped just 1.78% from 49.275 to 48.4, still enough to keep the streak intact. In between, most years cluster in the low double-digit decline range, including 2024’s 13.96% drop and 2025’s 15.92% slide.
Intraperiod swings have been meaningful. Maximum favorable excursions, the best point-to-peak moves in the trade direction, have often been modest, with several years showing less than 2% additional downside beyond the final close. Maximum adverse excursions, the worst drawdowns from entry, have been much larger, with years like 2016 and 2024 showing adverse moves of 27.1% and 22.7% before the trade ultimately worked. That profile suggests a window where the final result has been reliably lower prices, but the path has frequently involved sharp countertrend rallies.
The ten-year seasonal trend chart points to a typical pattern where Lean Hogs tends to chop early in the window before accelerating lower into the back half. The cumulative return curve reinforces that view, with most of the average decline accruing after the midpoint of the 27 days. For traders who watch historical seasonality, that timing nuance can matter as much as the headline win rate.
Put it together and the message is blunt. Ten for ten, double-digit average declines, and a high TradeWave Ratio of 1.97 all describe a July window that has consistently favored short exposure in Lean Hogs while demanding a strong stomach for intraperiod volatility.
History does not guarantee future results; adverse excursions can be large even in winning windows, and Lean Hogs has a track record of sharp countertrend spikes inside this pattern.
Why does Lean Hogs (LH) follow this seasonal pattern?
This early-July Lean Hogs seasonal pattern likely reflects commodity supply and demand seasonality more than technical quirks. One likely driver is the transition from spring hog marketing into heavier summer slaughter, when more animals reach market weight and packer demand can lag the flow of supply. Analysts also point to consumer spending cycles, with pork demand often softer after the early-summer grilling ramp, leaving futures vulnerable if production stays high while wholesale prices ease.
What is driving Lean Hogs (LH) today?
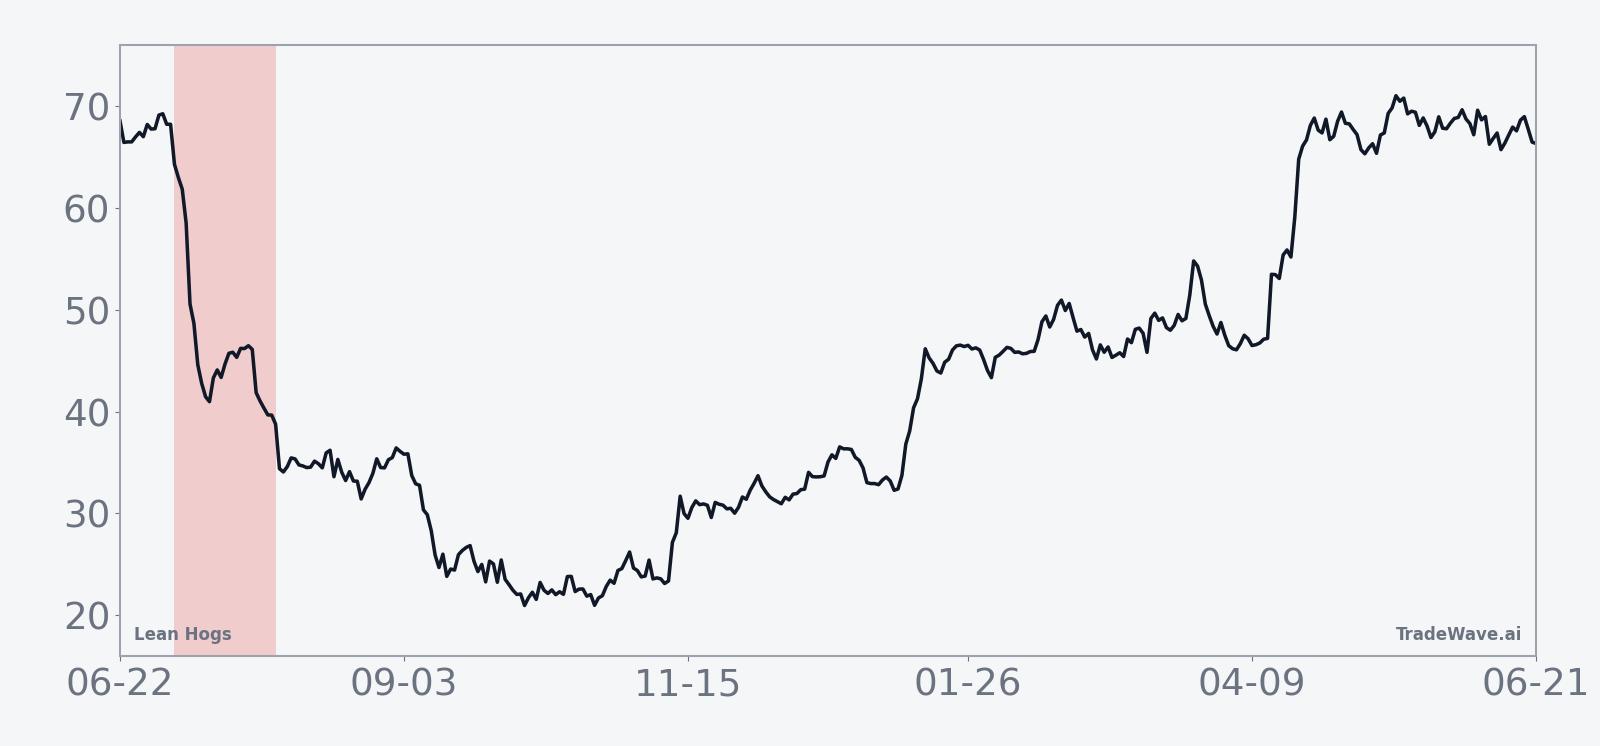
Lean Hogs futures last settled at 97.05 cents per pound on Jul 1, down about 13.2% from the 52-week high of 111.775 and still roughly 25.8% above the 77.125 low, with front-month volume over the past 20 sessions averaging 28,491 contracts. The contract has slipped 4.53% over the past month, trading below its 50-day moving average of 99.2635, which keeps the near-term tone cautious even before the seasonal window opens.
The chart below situates the latest move in its recent multi-month context alongside a 60-day seasonal projection.
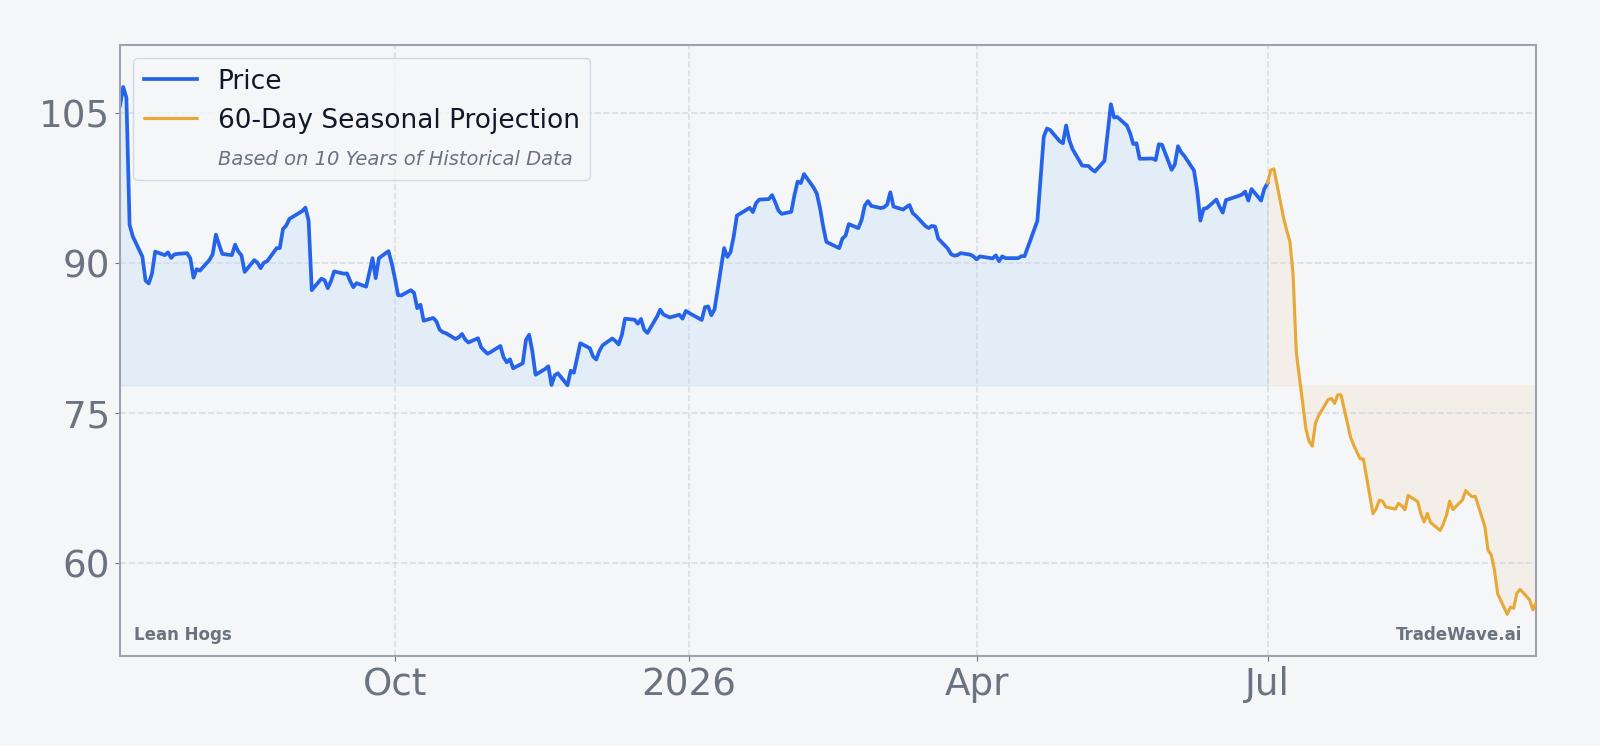
With no major fresh macro or sector headlines tied directly to Lean Hogs in recent weeks, the focus for many traders is shifting toward how this contract behaves as the July seasonal window kicks in. The combination of a mid-range price level, soft one-month performance and a historically bearish seasonal stretch has some hedgers looking at whether to lock in margins ahead of potential volatility. Speculators, meanwhile, are weighing whether the decade-long pattern of lower prices in this window can persist against whatever supply and demand surprises the summer brings.
What should traders watch in this Lean Hogs (LH) seasonal window?
First, watch how Lean Hogs trades around the Jul 6 start date relative to its 50-day moving average near 99.26 cents. A failure to reclaim that level and renewed selling pressure would be consistent with the historical pattern of weakness building as the window progresses, while a decisive break higher would be an early sign that this year may diverge from the past decade’s script.
Second, monitor intraperiod volatility. Prior years show that maximum adverse excursions have often been much larger than the final net move, with several seasons featuring double-digit rallies against the short side before prices rolled over again. If similar spikes appear this year, the way the market absorbs them will say a lot about whether producers and funds are leaning into the seasonal trend or fading it.
Third, keep an eye on fundamental catalysts that intersect with this calendar stretch, including weekly slaughter and carcass weight data, export sales reports, and any weather developments that could affect feed costs or hog weights. A seasonal window that has historically favored shorts can still be overwhelmed by a genuine supply shock or a demand surprise, and the path of cash hog and wholesale pork prices will be critical context for any futures move.
Finally, the most telling signal will be how Lean Hogs behaves into the back half of the 27-day window. In prior years, much of the average decline has come after the midpoint, so a market that stays firm or grinds higher late in the period would be a clear break from the established Lean Hogs seasonal trend. A renewed slide into late July, by contrast, would extend a 10-year run that has already made this one of the most striking short-side seasonal patterns on the commodity board.
Sources
About this seasonal analysis
Seasonal pattern data is sourced from TradeWave.ai, which analyzes historical price behavior across annual calendar windows going back up to 30 years. Read the full data methodology or the book The 100-Year Pattern by Afshin Moshrefi (2026 edition). Past performance of seasonal patterns does not guarantee future results. This article is for informational purposes only and does not constitute investment advice.