Lean Hogs (LH) Nears Jul 6 Window After 10 Straight Early-July Declines for Bears
Lean Hogs futures sit in the middle of their 12-month range just days before a July trading window that has delivered consistent downside over the past decade.
Price as of Jun 26, 2026: $96.58 (last close).
What is the seasonal pattern for Lean Hogs (LH)?
Lean Hogs has fallen in 10 of 10 years during this early-July 27-day window, with an average gain of 12.02% in winning short trades.
- 10 for 10 in this window, with short trades averaging 12.02% profits across the past decade.
- The upcoming pattern runs from Jul 6 for 27 calendar days and has historically favored downside in Lean Hogs prices.
- Percent Profitable is 100%, with 10 winners and 0 losers over the 10-year lookback.
- Average profit in winning years is 12.02%, with a median outcome of 12.18%, pointing to a tight cluster of sizeable moves.
- The TradeWave Ratio of 1.97 suggests prices have typically traveled meaningfully in the short direction within the window before settling.
- Intraperiod drawdowns have at times been deep even in winning years, so risk management has mattered as much as direction.
According to historical data from TradeWave.ai, this early-July stretch in Lean Hogs has behaved very differently from an average month on the calendar, and the next iteration is only days away.
How has Lean Hogs (LH) traded in the upcoming July seasonal window?
Lean Hogs has delivered profitable short trades in every single early-July 27-day window over the past 10 years, averaging 12.02% gains for bears. The front-month contract last settled at 96.575 on Jun 26, about 14.8% below its 52-week high of 113.35 and roughly 25.2% above its 52-week low of 77.125. With the next window set to open on Jul 6, traders are staring at a pattern that has not produced a single losing year in the last decade.
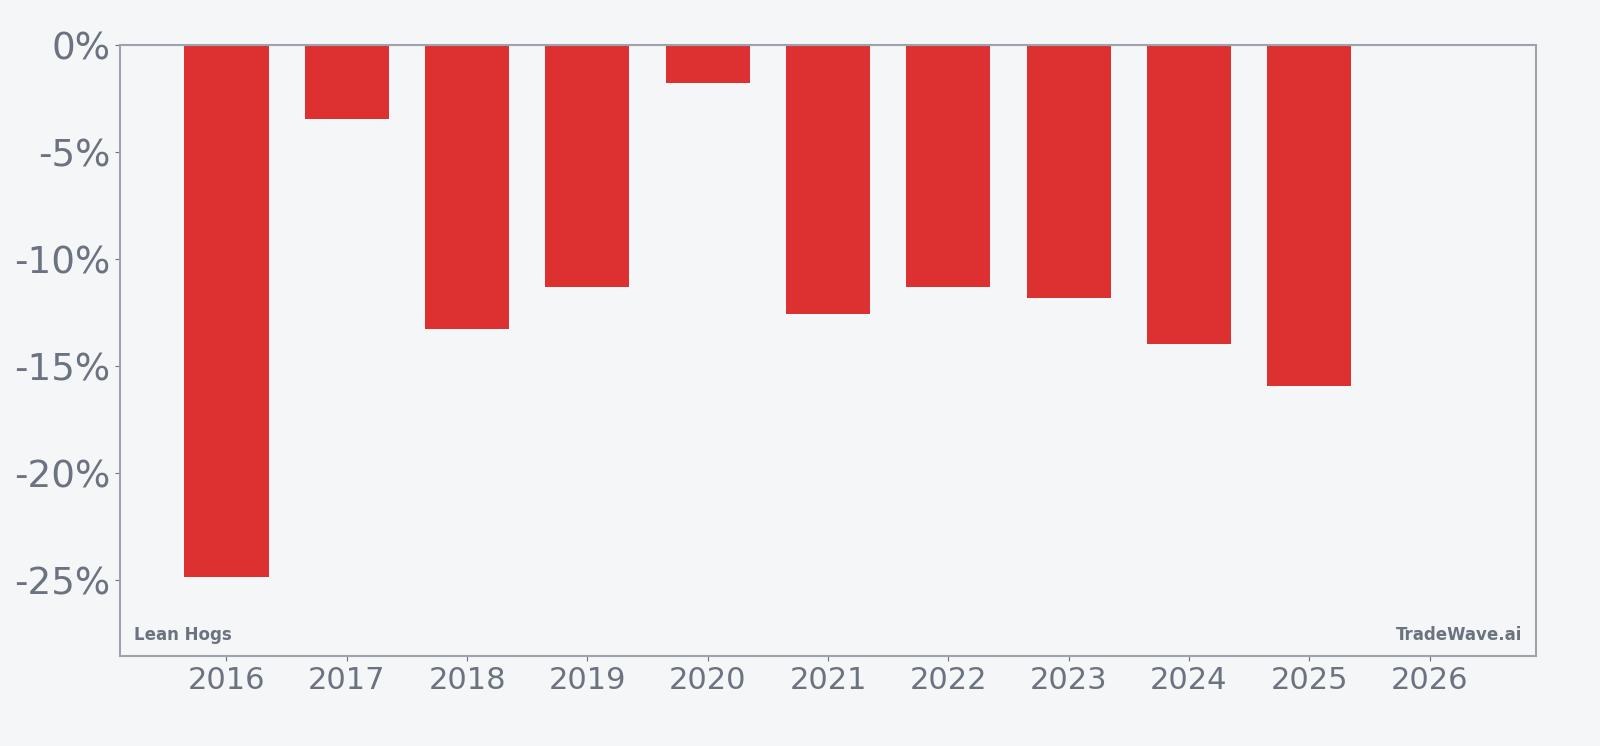
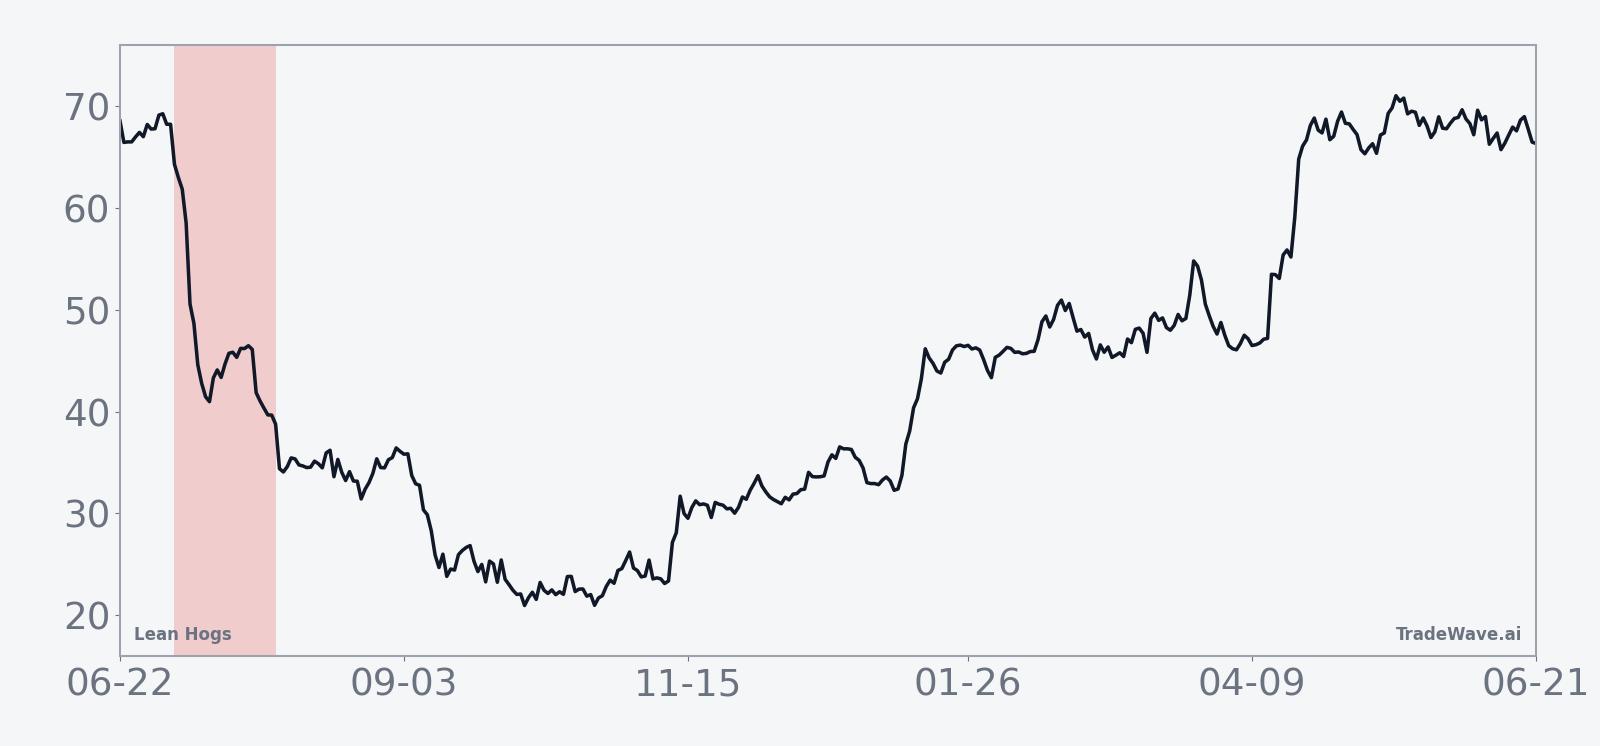
Year-by-year net returns and intraperiod swings show how consistently this July window has rewarded short exposure while still delivering sizable price moves.
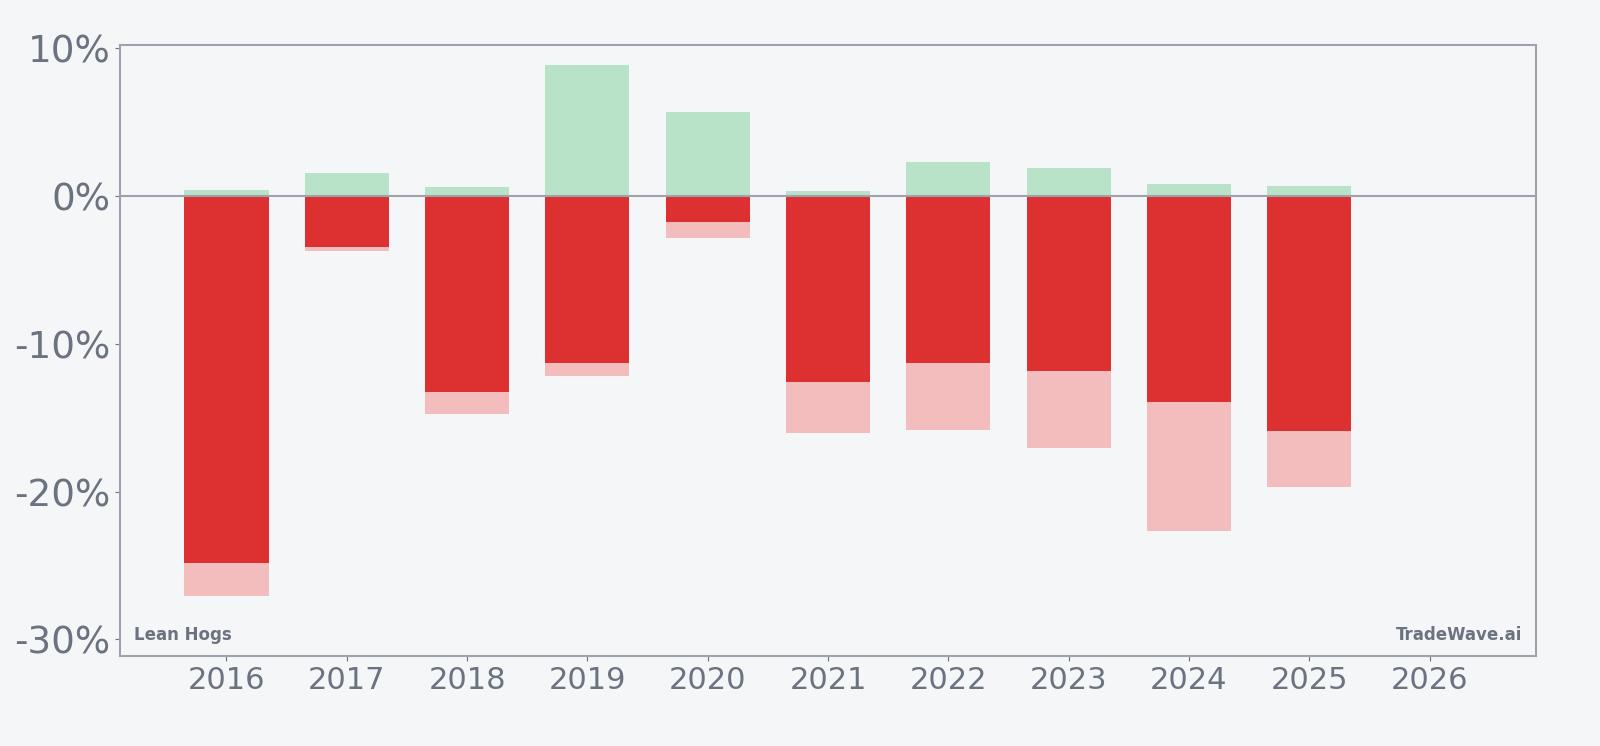
The trade direction for this pattern is explicitly short, and the record is clean: 10 winners, 0 losers, and 100% of years finishing with lower prices by the end of the 27-day stretch. Average profit across those winning short trades is 12.02%, with a median of 12.18%, which means the typical year has not been skewed by a single outlier collapse. The annualized return of 11.86% and a Sharpe ratio of 1.84 point to a historically strong risk-adjusted profile for traders who were positioned for downside during this specific Lean Hogs trading window.
The maximum favorable move in many of these years has been substantial, reflected in a TradeWave Ratio of 1.97 that signals prices often travel meaningfully in the short direction before the window closes. At the same time, maximum adverse excursions have at times been sharp, with several years showing double-digit intraperiod rallies against the short before prices rolled back over. The per-year table shows 2016 as the standout, with a 24.84% net decline from entry to exit, while 2020 was the mildest outcome at a 1.78% drop, underscoring that even the “soft” years still finished in the red for spot prices.
The 10-year seasonal trend chart suggests that weakness has tended to build gradually rather than in a single air pocket. In many years, Lean Hogs has chopped sideways or even ticked higher in the first few sessions of the window before heavier selling pressure emerged into the back half. The cumulative return profile across the window slopes steadily lower, which is unusual for a commodity contract that often trades around discrete supply shocks and demand headlines.
The combined net/MFE/MAE bar chart reinforces that this is not a low-volatility grind lower. In several years, maximum favorable excursions for shorts have pushed beyond the final net decline, meaning traders who managed exits intraperiod could have captured even larger moves than the close-to-close result. On the flip side, maximum adverse excursions show that countertrend rallies of 10% or more have been part of the playbook, especially in years like 2016 and 2024, where the worst drawdowns from entry were deep before the trend reasserted itself.
Put simply, this July Lean Hogs seasonal window has been a perfect 10-for-10 for shorts over the past decade, with sizeable average declines and enough intraperiod noise to punish complacent risk management.
Why does Lean Hogs (LH) follow this seasonal pattern?
This pattern may reflect the way summer hog supplies and slaughter schedules intersect with demand from processors and retailers. One likely driver is that heavier market-ready hog weights and seasonally softer pork demand after early-summer grilling peaks can pressure cash prices and futures during this stretch. Analysts also point to hedging flows from producers and packers that often ramp up ahead of late-summer contract expiries, adding selling pressure just as the historical window opens.
History does not guarantee future results; even in a 10-for-10 window, adverse intraperiod moves have been large enough to challenge poorly managed positions.
What is driving Lean Hogs (LH) today?
Lean Hogs futures last settled at 96.575 on Jun 26, leaving the contract roughly in the middle of its 52-week range between 77.125 and 113.35 and modestly below its 50-day moving average of 98.8475. The front month is down 5.43% over the past month, a pullback that has eased some of the spring strength but stopped well short of a full-blown breakdown. With no major macro or sector-specific headlines in the immediate backdrop, the market is trading largely on expectations for summer pork demand, feed costs and producer margins rather than a single dominant catalyst.
The chart below situates the latest pullback in the context of the past year and overlays the upcoming 60-day seasonal projection.
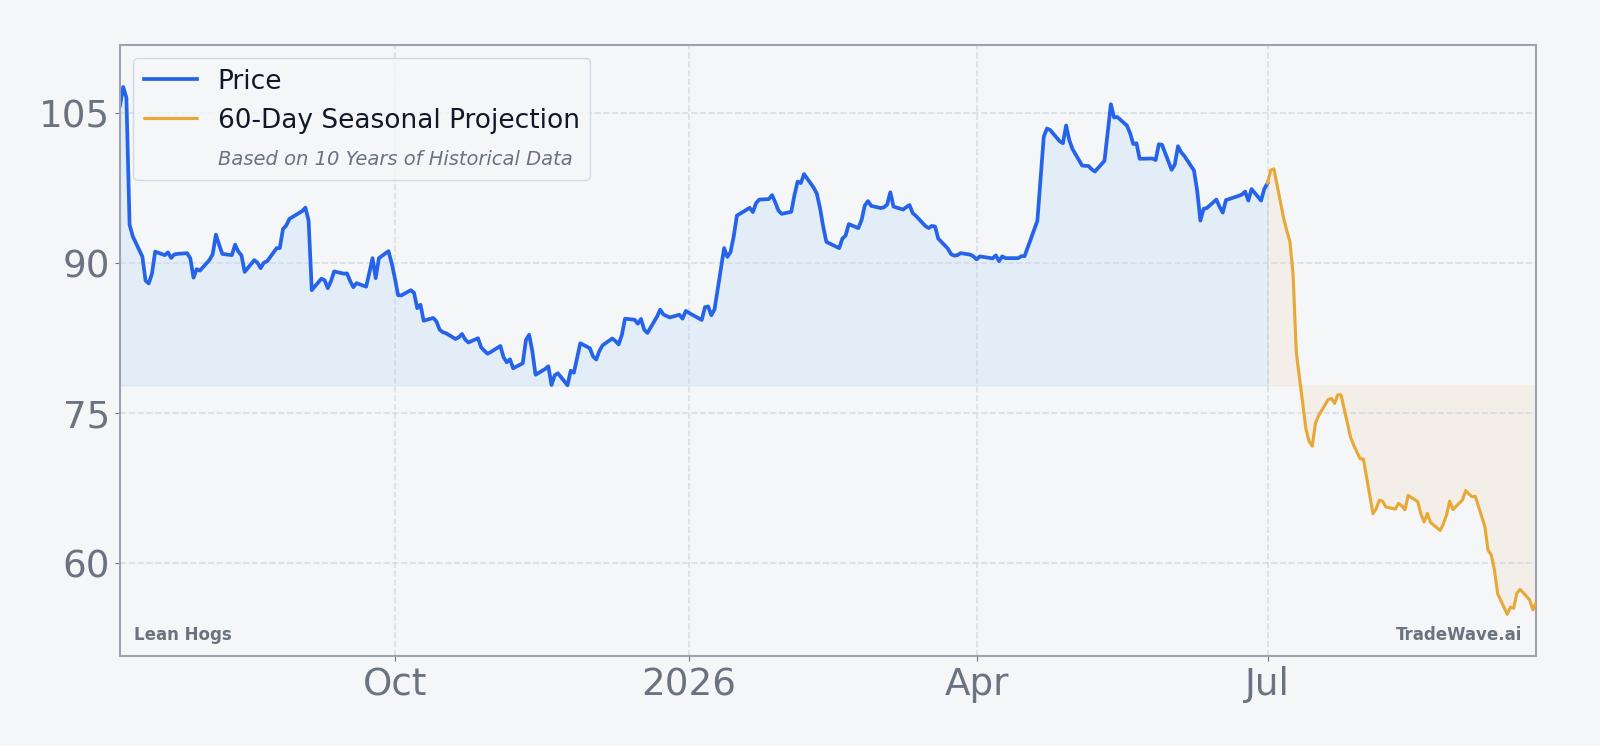
From a macro standpoint, Lean Hogs sits at the intersection of protein demand, feed costs and broader inflation expectations. Moves in grain markets can quickly alter hog producer economics, while shifts in consumer spending on meat can change packer demand for live hogs. With the contract already backing off its highs and the historically weak July window approaching, traders are watching whether current consolidation breaks toward the lower end of the recent range or stabilizes despite the seasonal headwind.
What should traders watch as the July Lean Hogs window opens?
As the Jul 6 seasonal window approaches, the first thing to watch is how Lean Hogs behaves around the 50-day moving average near 98.85. A failure to reclaim that level before or early in the window would fit the historical pattern of weakness building after a period of consolidation, while a decisive move back above it would signal that buyers are willing to lean against the seasonal trend.
Second, monitor daily ranges and intraday reversals once the window is underway. The historical MFE and MAE profile shows that even in years that finished sharply lower, Lean Hogs often staged sizeable countertrend rallies before rolling over again. If early July brings wide intraday swings and failed rallies that fade into the close, that would echo the past decade’s pattern of choppy but ultimately bearish price action.
Third, keep an eye on fundamental markers such as slaughter numbers, carcass weights and wholesale pork prices, which can either reinforce or blunt the seasonal tendency. A surprise tightening in supplies or stronger-than-expected export demand could limit downside even in a historically weak stretch, while evidence of heavy hog flows and soft packer margins would add fuel to the seasonal bias.
Finally, watch how positioning evolves around key technical levels and into any macro data that might shift inflation or consumer-spending expectations. If selling pressure accelerates on breaks of recent lows and is accompanied by rising volume, it would suggest that traders are leaning into the established July pattern. A quiet, low-volume drift that holds above support, by contrast, would mark a rare challenge to a window that has been 10-for-10 for shorts over the last decade.
Sources
About this seasonal analysis
Seasonal pattern data is sourced from TradeWave.ai, which analyzes historical price behavior across annual calendar windows going back up to 30 years. Read the full data methodology or the book The 100-Year Pattern by Afshin Moshrefi (2026 edition). Past performance of seasonal patterns does not guarantee future results. This article is for informational purposes only and does not constitute investment advice.