Corn (CME) (ZC) Has Fallen in 9 of 10 Late-Summer Windows, Averaging 10.93% Declines
Corn (CME) is sitting near the middle of its 52-week range just days before a historically bearish 50-day late-summer window that has often rewarded short exposure.
Price as of Jun 29, 2026: $417.00 (intraday).

What is the seasonal pattern for Corn (CME) (ZC)?
Corn (CME) has fallen in 9 of 10 years during this 50-day late-summer window since 2016, with an average 10.93% decline in winning short years.
- 9 for 10 in this window, with winning short years averaging 10.93% declines and a 10% average move across all years.
- The 50-day Corn (CME) trading window begins Jul 9 and has historically favored short exposure in late summer.
- Percent Profitable sits at 90%, with 9 winners and 1 loser for the short-side pattern over the past decade.
- Avg Profit reflects winners only at 10.93%, while Avg Profit - All, which includes the lone losing year, is still a hefty 10% move.
- The TradeWave Ratio of 2.11 signals that price typically travels meaningfully in the trade direction within the window.
- Intraperiod swings have been sizable, with adverse moves that can reach double digits even in years that ultimately finish profitable for shorts.
According to historical data from TradeWave.ai, this upcoming 50-day stretch has behaved very differently from an average month on the corn calendar. The next section walks through what that late-summer pattern has looked like in prior years and how sharp the swings have been.
How has Corn (CME) (ZC) traded in this late-summer window?
Corn (CME) has fallen in 9 of the past 10 years during the 50 calendar days starting Jul 9, with winning short years averaging a 10.93% decline and a 10% average move across all years. The new window is set to open with front-month futures at 417.0 cents per bushel, about 13.4% below the 52-week high of 481.75 and 13.1% above the 52-week low of 368.75. That combination of a mid-range price and a historically bearish late-summer seasonal trend gives this year’s setup real bite for anyone exposed to corn prices.
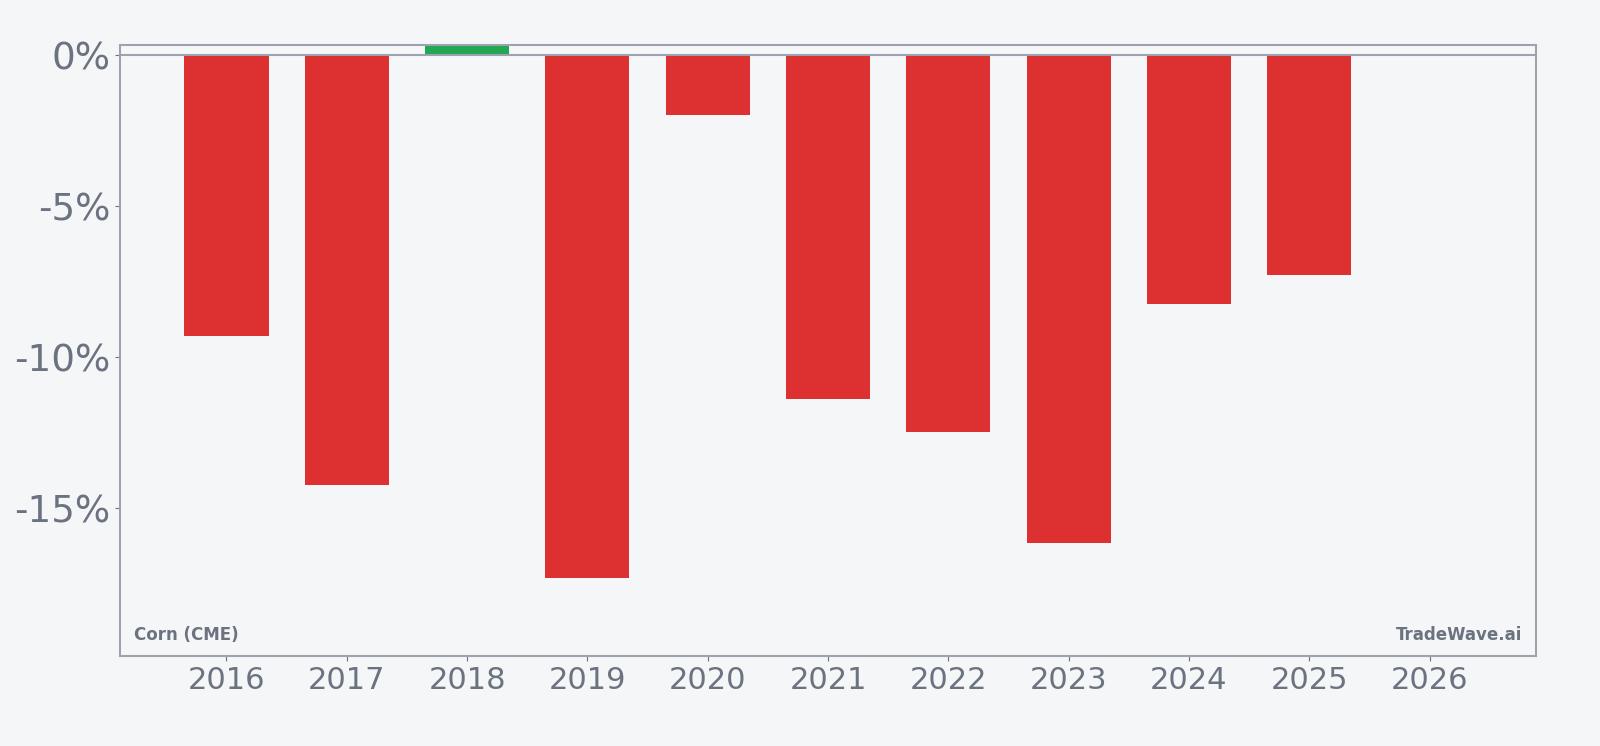
Across the decade-long lookback, the short-side pattern has been unusually consistent. Nine years delivered net declines for corn futures over this 50-day span, while only one year, 2018, finished slightly higher with a 0.29% gain against the short. The annualized return of 9.67% and Sharpe ratio of 1.61 for the strategy underscore that this is not just a one-off weather fluke but a repeatable late-summer tendency in the ZC seasonal trend.
The depth of those winning years is what stands out. Average profit in the winners is 10.93%, and even after including the lone losing year, the all-years average sits at 10%. That means the typical short that worked did not just drift lower; it moved with conviction. The median outcome of 10.35% lines up closely with the average, which suggests the pattern is not being skewed by a single outlier year.
Looking at individual seasons, 2019 and 2023 were among the strongest years for the short, with net returns of 17.31% and 16.16% respectively as corn rolled over from early-summer strength into harvest expectations. At the other end of the spectrum, 2016 saw a 9.31% gain for shorts, still a sizable move but smaller than the double-digit declines that dominate the sample. The lone losing year, 2018, barely broke even for longs, which kept the overall profile firmly tilted toward downside in this Corn (CME) trading window.
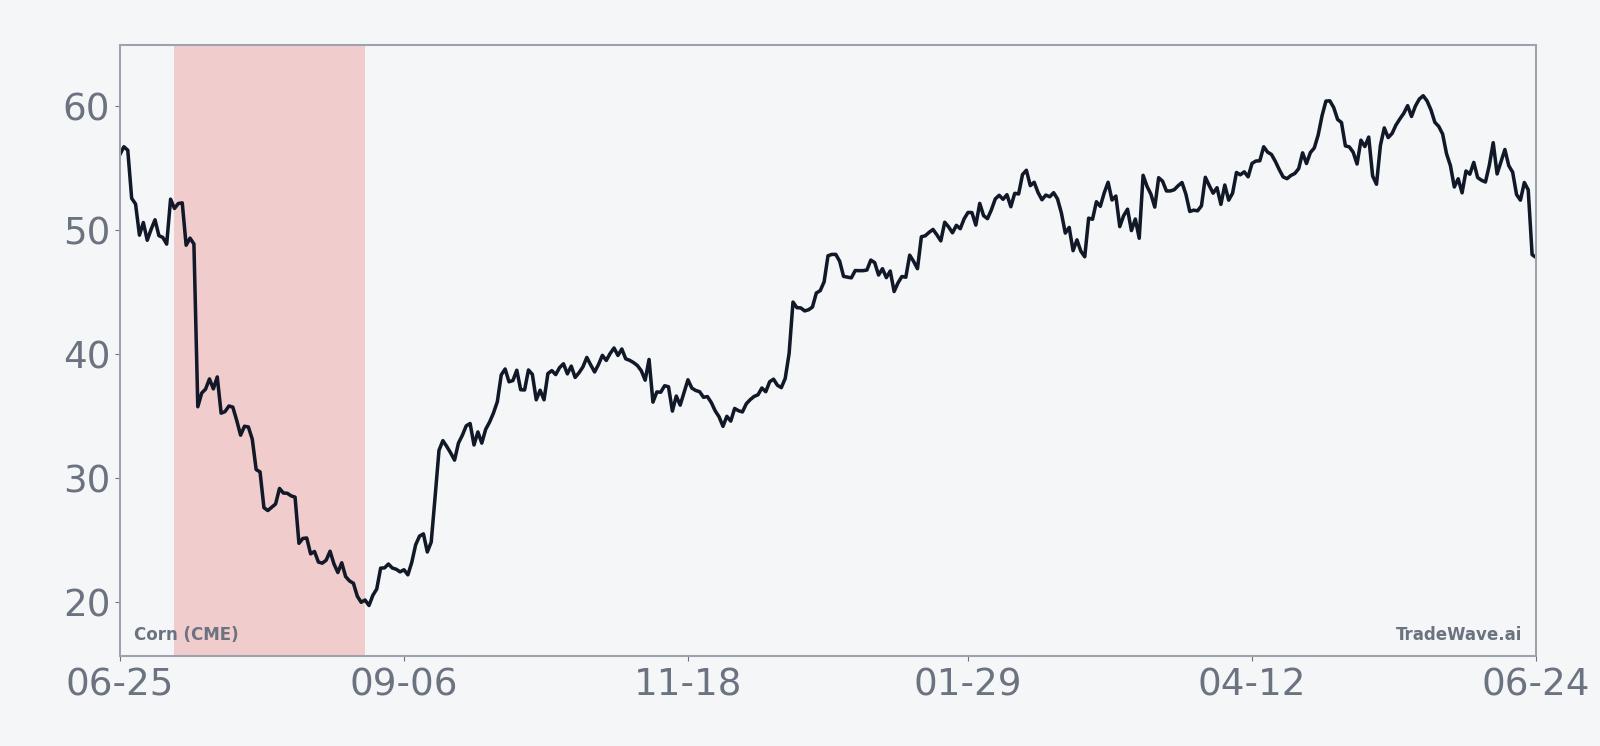
Yearly net and peak moves highlight how far corn has tended to travel in both favorable and adverse directions within this window.
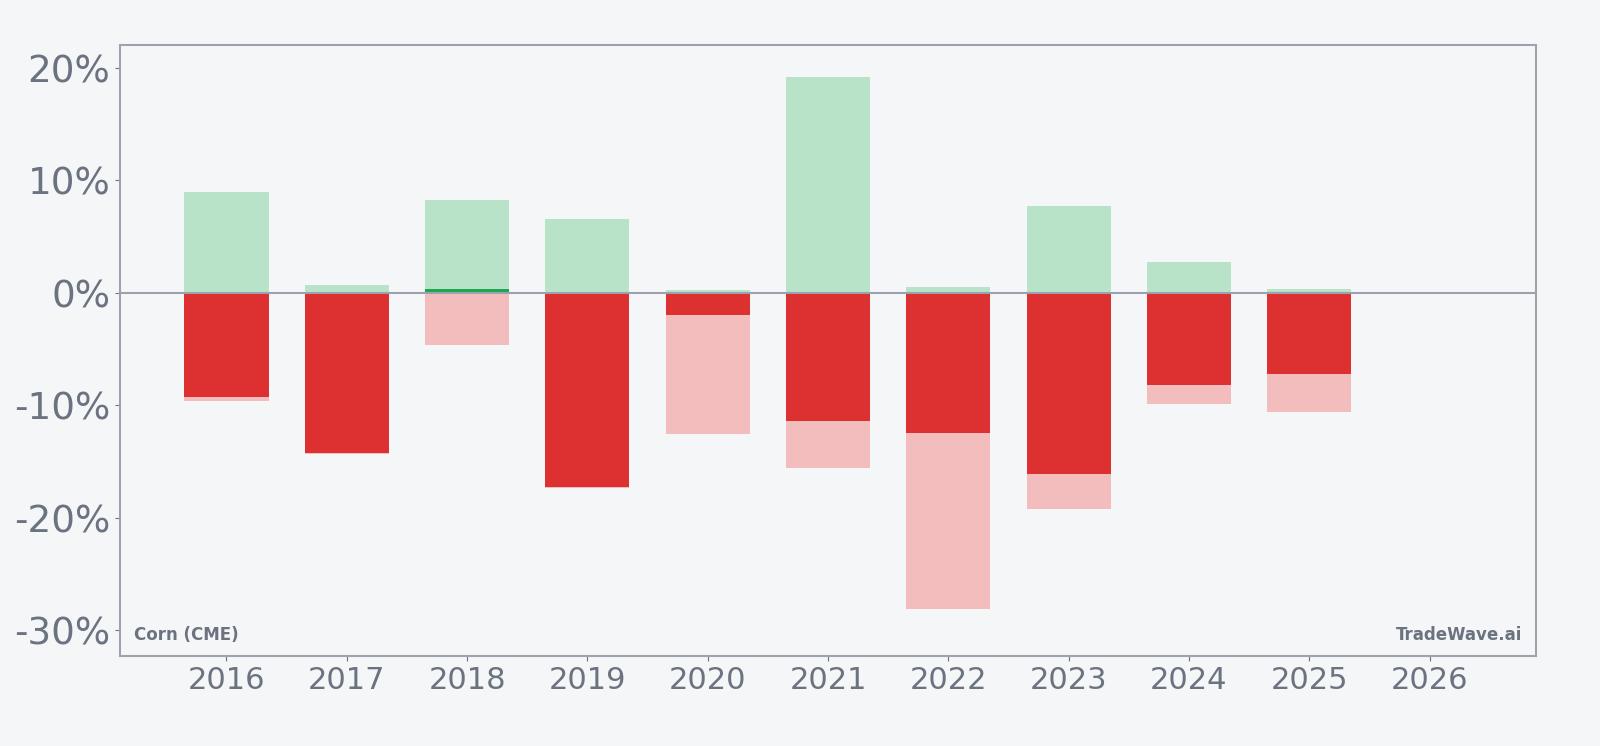
The maximum favorable move and maximum adverse move profile shows why this window commands respect. In strong years like 2021, shorts ultimately booked an 11.39% gain, but the contract first rallied as much as 19.17% from entry before rolling over, a reminder that intraperiod squeezes can be violent even when the final outcome favors the short. In 2022, the worst drawdown from entry reached 28.13% against the short before the market reversed to finish with a 12.48% decline in corn prices.
Across the sample, maximum adverse excursions often sit in the high single digits to low double digits, while maximum favorable excursions for the short side also cluster in the low to mid-teens. That mix points to a high-variance window where both sharp rallies and deep selloffs have occurred, but where the closing tape has leaned heavily toward lower prices by the end of the 50 days. The TradeWave Ratio of 2.11 captures that tendency for corn to travel meaningfully in the trade direction within the window, independent of the final close.
Put together, the pattern is clear: this late-summer stretch has favored short exposure in 9 of 10 years, with typical moves large enough to matter for hedgers, speculators, and anyone whose margins are tied to corn.
Why does Corn (CME) (ZC) follow this seasonal pattern?
This late-summer window lines up with the heart of the U.S. growing season, when weather clarity improves and traders shift from planting risk to yield and harvest expectations. One likely driver is that better visibility on crop size, combined with USDA supply updates, often pushes the market to price in more comfortable ending stocks, which can pressure futures lower. Analysts also point to producer hedging and commercial selling into rallies during this period, which can reinforce the historical seasonality toward weaker prices.
History does not guarantee future results, and adverse excursions within the window can be large even in years that ultimately finish profitable for shorts.
What is driving Corn (CME) (ZC) today?
Corn futures settled the prior session at 417.0 cents per bushel, up 1.0% on the day and sitting roughly in the middle of the past year’s 368.75 to 481.75 range. The contract has been under pressure in 2026 after the U.S. Department of Agriculture lifted projected corn ending stocks to 2.23 billion bushels in its January World Agricultural Supply and Demand Estimates report, a sizeable increase that signaled more comfortable supply and weighed on grain prices earlier in the year.[1]
That supply backdrop has been reinforced by reports of solid early planting progress and drier Corn Belt forecasts, which have eased concerns about delays and yield risk that sometimes support prices in spring.[2] With the market no longer trading a tightness story and volatility compressed relative to the spikes seen during past weather scares, the upcoming seasonal window arrives against a calmer but still fundamentally heavy backdrop for corn.
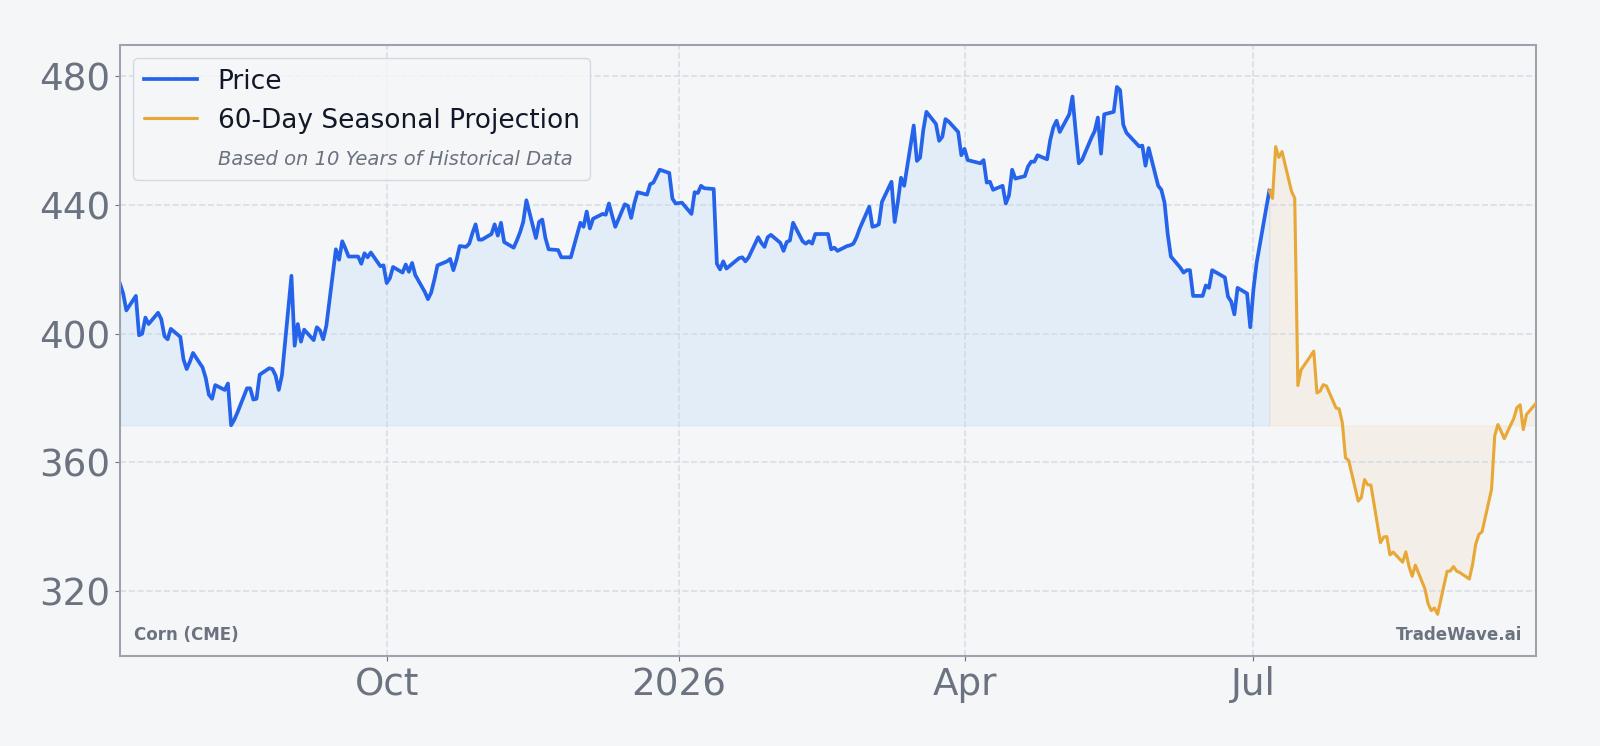
The chart below situates the latest move in its recent multi-month context and overlays the next 60 days of historical seasonal behavior.
How do supply, demand, and positioning intersect with this seasonal window?
The January WASDE shift to higher ending stocks set the tone for 2026, tilting the corn market away from the tightness narrative that dominated earlier years.[1] When supply looks ample heading into July, the historical pattern of late-summer weakness can be amplified as traders grow more comfortable fading weather rallies and as commercial hedging programs lean into forward selling. In years when stocks are tighter, the same window can still produce downside, but the path often involves sharper squeezes before the seasonal gravity reasserts itself.
On the demand side, feed and export flows tend to be steadier than the supply narrative during this part of the year, which leaves weather, acreage, and yield expectations as the main swing factors. Reports of good planting progress and cooperative weather reduce the odds of a supply shock that could override the historical seasonality.[2] That does not remove upside risk, but it means the burden of proof sits with the bulls as the window opens.
Positioning data for corn is often dominated by commercial hedgers and managed money trend-followers, and this window has historically rewarded those who were willing to lean into weakness rather than chase late-season rallies. The pattern of large maximum adverse moves, however, shows that shorts who arrive early or size aggressively can face painful squeezes before the broader seasonal trend plays out. For producers and consumers using futures to hedge, the lesson from the past decade is that timing and risk limits matter as much as direction in this high-volatility slice of the calendar.
What should traders watch as this Corn (CME) (ZC) window opens?
Three things will matter most as the Jul 9 window approaches. First, watch how corn trades around key technical levels near the middle of the 52-week range; a failure to sustain rallies toward the 440 to 450 area would be consistent with the historical pattern of late-summer softness, while a decisive break higher would signal that this year may diverge from the usual script. Second, track upcoming USDA reports and weekly crop progress updates for any sign that yield expectations or ending stocks are tightening again, which could blunt or even reverse the typical seasonal downside.[1][2]
Third, monitor intraday volatility and the size of countertrend rallies once the window begins. In prior years, some of the best short outcomes still featured double-digit rallies against the position before prices rolled over, so a spike in volatility would not automatically invalidate the pattern. If corn starts to show repeated failures on strength and closes weak into the back half of the 50-day stretch, that behavior would line up closely with the historical seasonality. If instead the contract grinds higher on strong demand or surprise supply cuts, traders will have a clear signal that this cycle is breaking from the past decade’s script.
Sources
About this seasonal analysis
Seasonal pattern data is sourced from TradeWave.ai, which analyzes historical price behavior across annual calendar windows going back up to 30 years. Read the full data methodology or the book The 100-Year Pattern by Afshin Moshrefi (2026 edition). Past performance of seasonal patterns does not guarantee future results. This article is for informational purposes only and does not constitute investment advice.