Lean Hogs (LH) Has Fallen in All 10 of These July Windows, With Shorts Averaging 11%
Lean Hogs is hovering just under 100 cents as a 26-day July seasonal window opens that has delivered consistent downside in every year of the past decade.
Price as of Jul 6, 2026: $98.53 (last close).
What is the seasonal pattern for Lean Hogs (LH)?
Lean Hogs has fallen in 10 of 10 years during this late-July 26-day window, with an average gain of 11.26% in winning short trades.
- 10 for 10 in this window, with short trades averaging 11.26% gains across the past decade.
- The current 26-day Lean Hogs trading window starts Jul 7 and has historically favored downside moves.
- Percent Profitable is 100%, with 10 winners and 0 losers for the short-side seasonal pattern.
- Average winner gains of roughly 11% come alongside several years with intraperiod drawdowns deeper than 15% before the move played out.
- The pattern’s TradeWave Ratio of 1.86 and Sharpe ratio of 1.73 point to strong, directional behavior rather than random summer chop.
According to historical data from TradeWave.ai, this mid-summer stretch in Lean Hogs has behaved very differently from an average month on the calendar. The next section walks through how that pattern has played out over the past decade and what it means for the new window that just opened.
How has Lean Hogs (LH) traded in this July seasonal window?
Lean Hogs has delivered profitable short trades in every one of the past 10 years during the 26-day window that begins on Jul 7, with average gains of 11.26% for those short positions. The new window opens with the front-month contract last quoted at 98.525 cents per pound, sitting between its 52-week low near 77 cents and high around 110.5 cents as traders weigh whether another summer slide is coming. That combination of a clean 10-for-10 record and double-digit average returns makes this one of the more striking livestock seasonal patterns on the board.
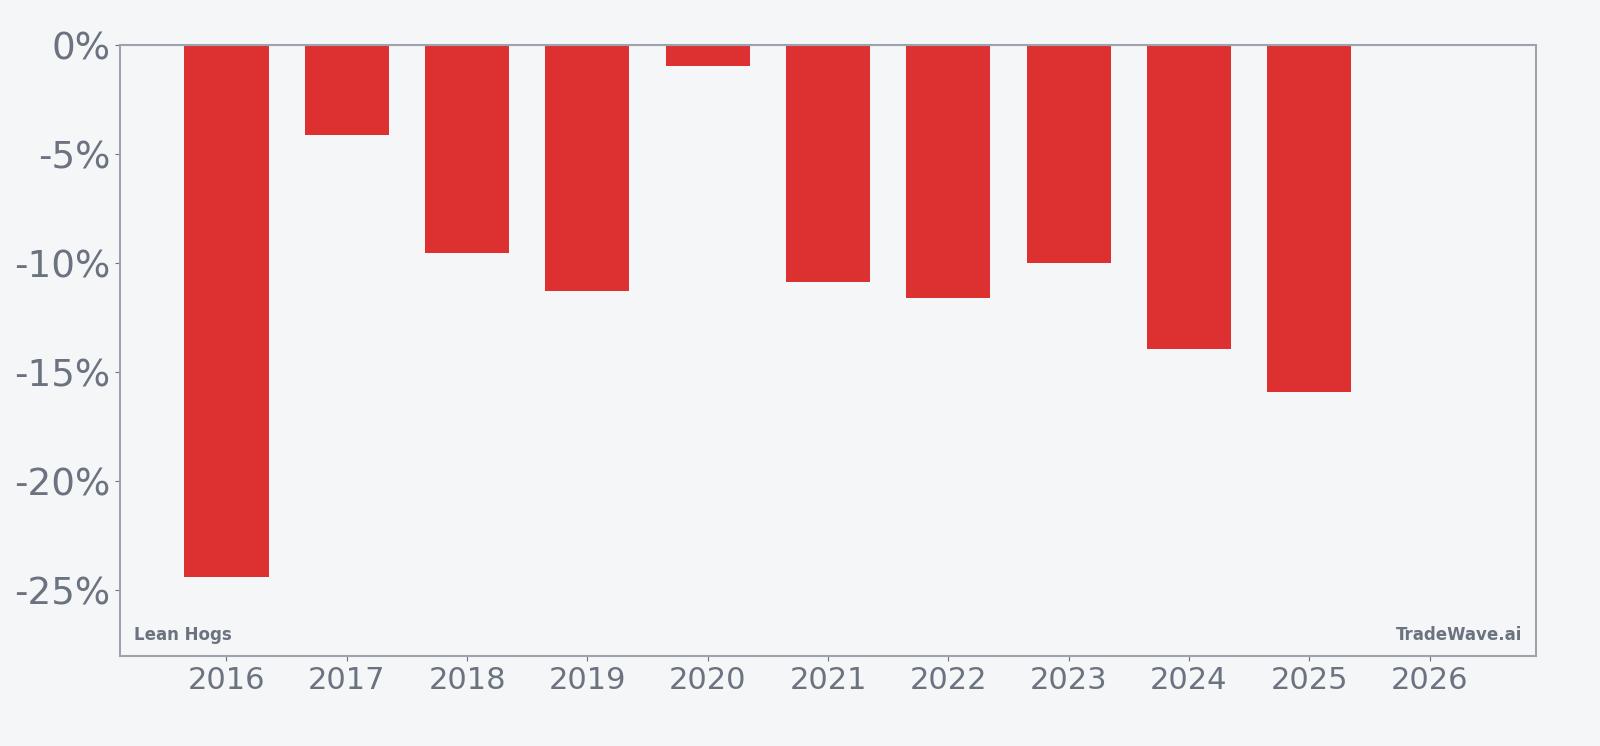
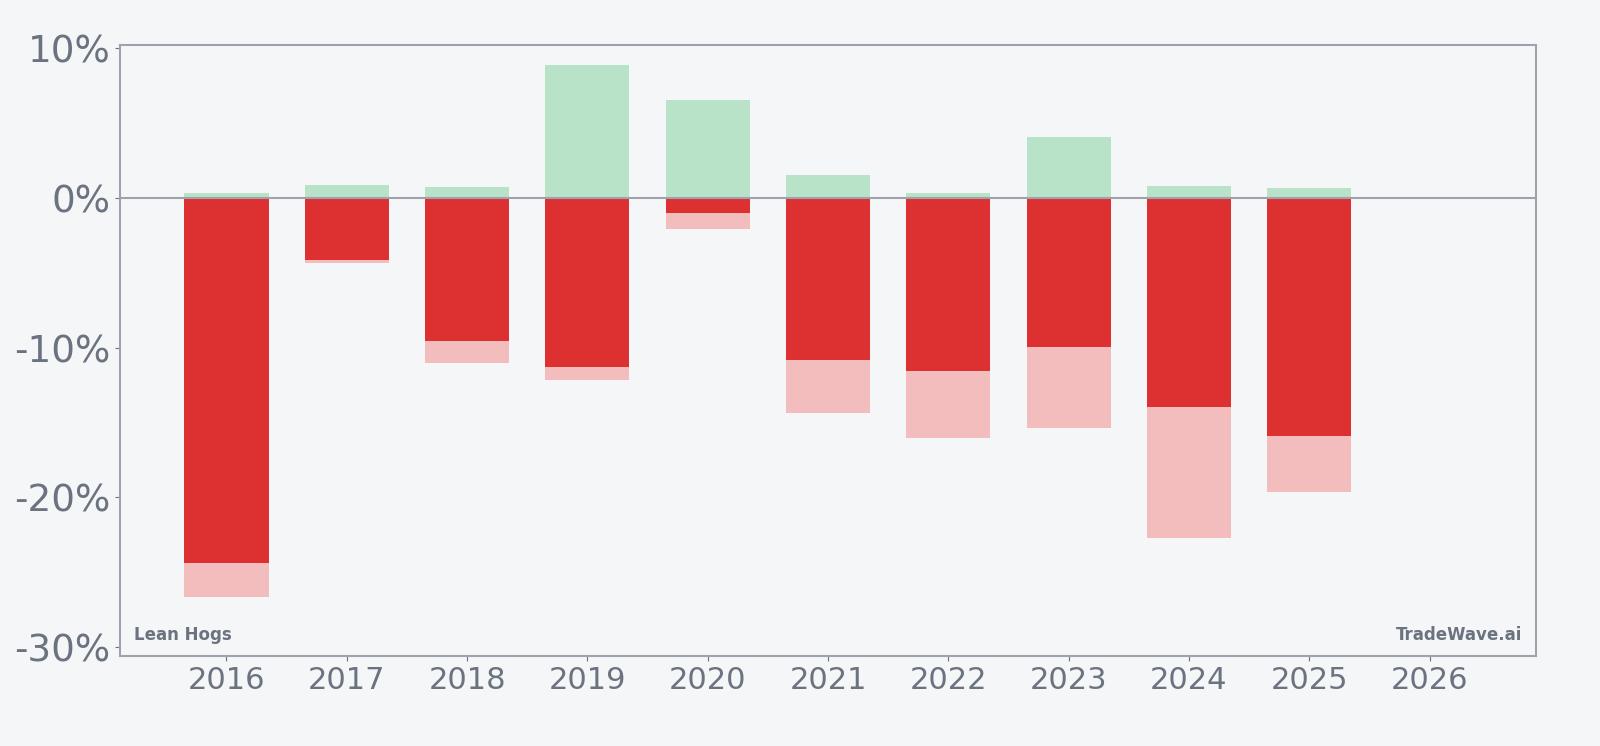
Year-by-year net returns and intraperiod swings show how consistently this window has rewarded shorts while still delivering sizable drawdowns along the way.
The trade direction for this pattern is explicitly short, and the 100% win rate across 10 years means every iteration has seen Lean Hogs finish the window lower than it started. Average profit of 11.26% reflects the mean gain for those short trades, while the median outcome of 11.08% shows that results have clustered around that double-digit mark rather than being driven by a single outlier year. The cumulative return of 186% across the decade underlines how powerful this specific slice of the calendar has been for traders who were positioned for downside.
Intraperiod behavior has not been one-way traffic. In 2016, for example, the contract dropped 24.37% from entry to exit, but the worst drawdown from the short entry reached 26.65% against the position before the move fully unfolded, illustrating how painful countertrend rallies can be even in a winning year. Several other years, including 2021, 2022 and 2024, show maximum adverse excursions in the mid-teens, while maximum favorable excursions often extend beyond the final net profit, signaling that the window has historically offered both deep downside and sharp interim bounces.
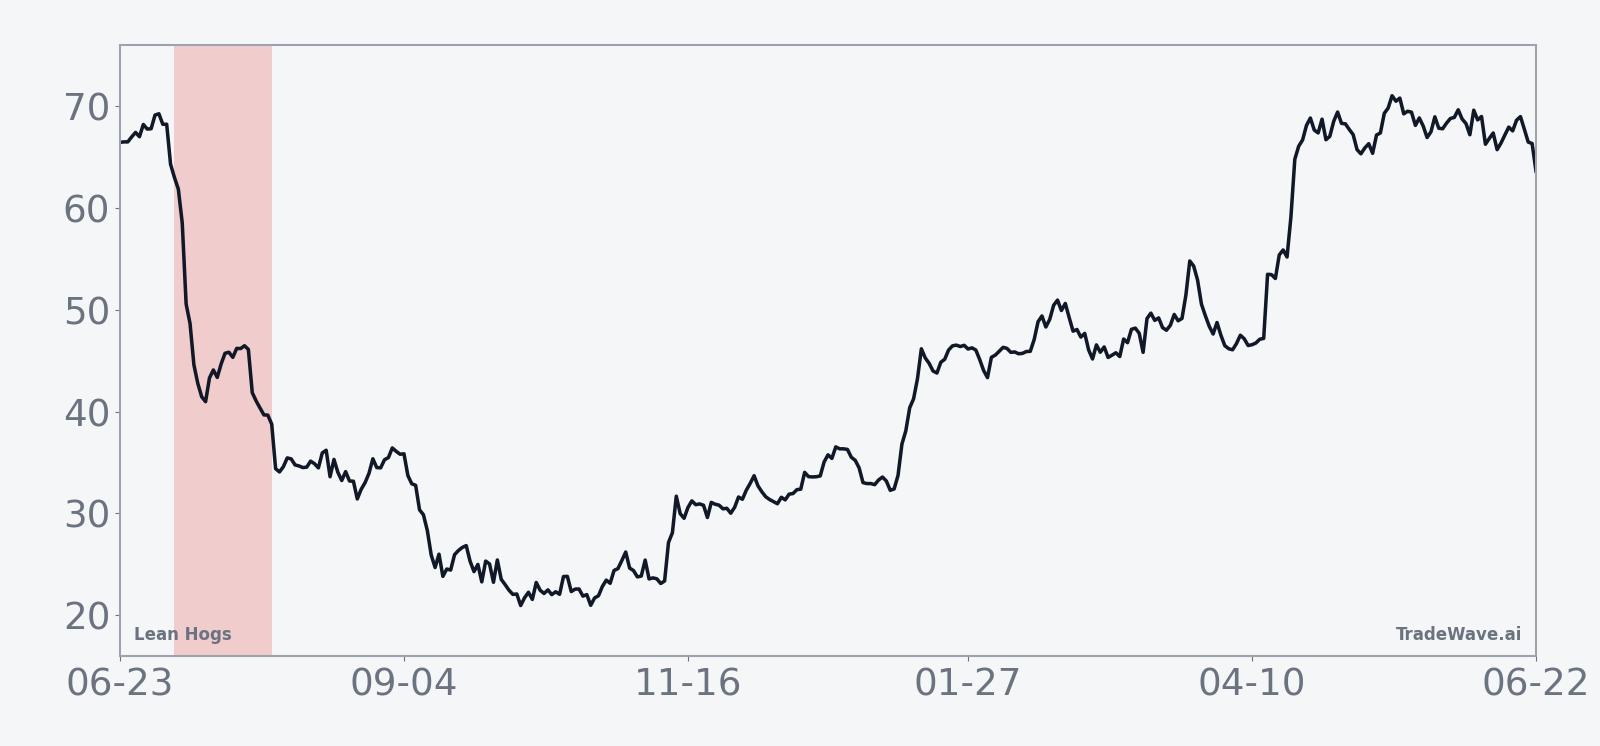
The trend view suggests that weakness tends to build rather than gap. The 10-year seasonal average slopes lower through much of the 26-day span, with relatively few instances where the contract spent the bulk of the window grinding sideways. The cumulative return chart reinforces that impression, with a steady downward staircase rather than a jagged, mean-reverting profile.
Put together, the pattern is clear: this July window has favored short positions in Lean Hogs in every year of the past decade, with consistent double-digit percentage declines from entry to exit.
Why does Lean Hogs (LH) follow this seasonal pattern?
This mid-summer Lean Hogs seasonal trend likely reflects commodity supply and demand seasonality more than technical quirks. Hog supplies often build into late summer as earlier farrowings reach market weight, while grilling-season demand can start to fade, pressuring prices. Analysts also point to packer margins and feed-cost dynamics that tend to shift around this time of year, creating a recurring window where futures have historically struggled to hold early-summer strength.
History does not guarantee future results; even in a 10-for-10 window, adverse excursions within the trade can be large before the seasonal pattern asserts itself.
What is driving Lean Hogs (LH) today?
Lean Hogs futures settled the prior session at 98.525 cents per pound, with the front-month contract trading in a relatively tight intraday band between 98.175 and 99.025 as of Jul 6. That leaves prices well off the 52-week high of 110.5 but still comfortably above the 77.125 low, after a one-month slide of about 3.03% that has cooled what had been a strong spring rally. Volume near 27,500 contracts on the latest session sits slightly below the 20-day average of roughly 29,754, suggesting traders are only beginning to adjust positioning as the new seasonal window opens.
The chart below situates the latest move in its recent multi-month context and overlays the next 60 days of seasonal tendencies.
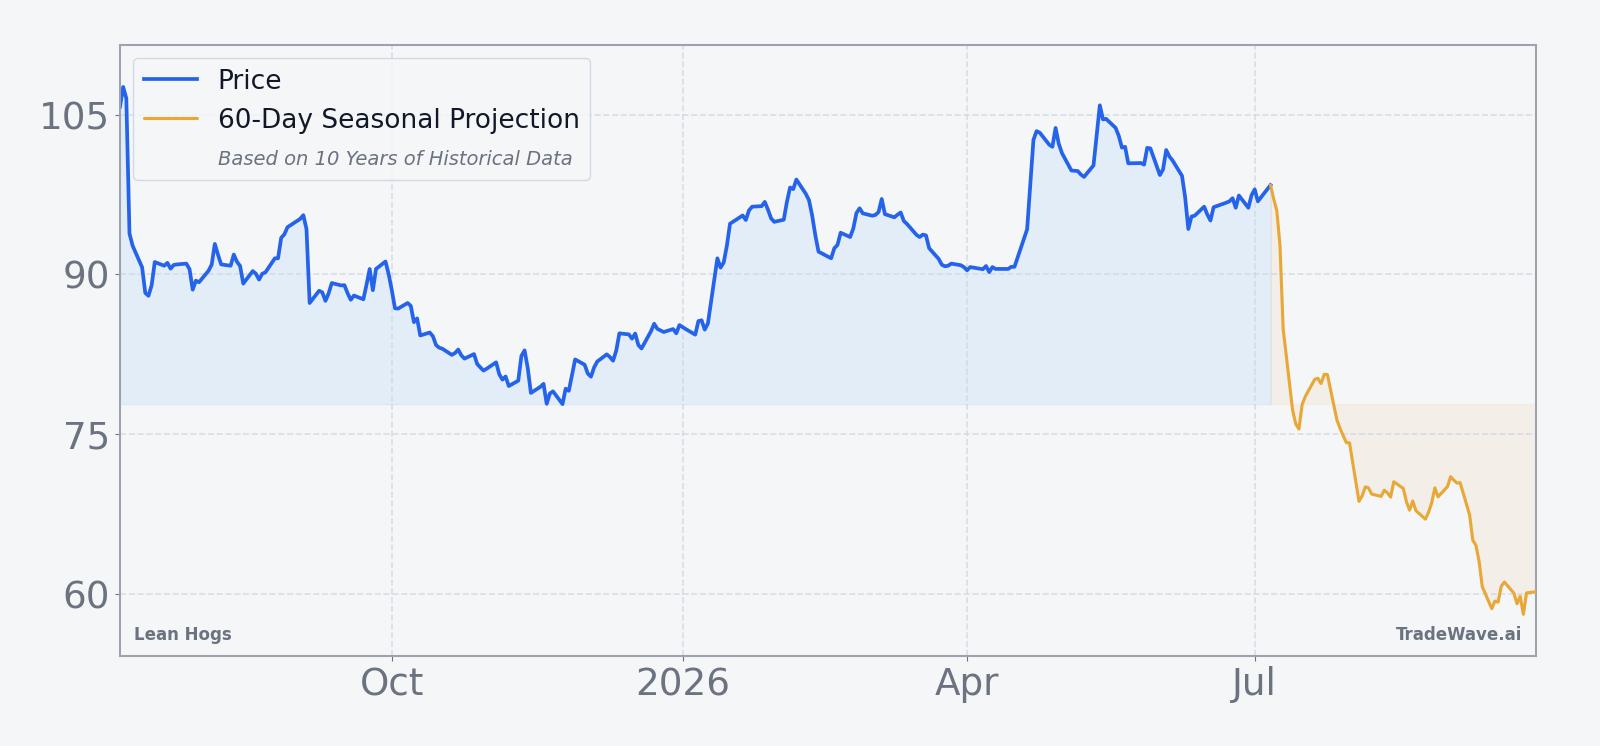
From a technical standpoint, the contract is sitting just below its 50-day simple moving average around 99.58, a level that has acted as a pivot several times this year. A sustained break below that moving average during the window would align with the historical pattern of mid-summer softness, while a decisive push back above it would signal that current fundamentals are overpowering the usual seasonal drag. With no major macro or policy headlines specific to hogs in the latest data set, the focus for many traders is likely to remain on slaughter numbers, carcass weights and export demand as they gauge whether this year will again rhyme with the past decade’s July script.
What should traders watch in this Lean Hogs seasonal window?
For this 26-day stretch, the key watchpoints are how price behaves around the 50-day moving average, whether volume picks up as the window progresses, and how slaughter and export data line up with the usual late-summer supply build. A quick break lower with expanding volume would fit the historical pattern of profitable short trades, especially if rallies struggle to reclaim the 99 to 100 cent area. On the other hand, a firm bid that keeps Lean Hogs pinned above the recent range would be an early sign that 2026 could be one of the rare years that diverges from the 10-for-10 record. Either way, the next few weeks are likely to be closely watched by livestock desks that have learned to respect this particular slice of the calendar.
Sources
About this seasonal analysis
Seasonal pattern data is sourced from TradeWave.ai, which analyzes historical price behavior across annual calendar windows going back up to 30 years. Read the full data methodology or the book The 100-Year Pattern by Afshin Moshrefi (2026 edition). Past performance of seasonal patterns does not guarantee future results. This article is for informational purposes only and does not constitute investment advice.