Soybean Meal (ZM) Has Dropped in 8 of 10 Midterm Windows Starting Jul 12
Soybean Meal futures sit in the middle of their 52-week range as an 11-day midterm-election-year seasonal window approaches that has historically favored short positions and sharp intraperiod swings.
Price as of Jul 7, 2026: $314.70 (intraday).
What is the seasonal pattern for Soybean Meal (ZM)?
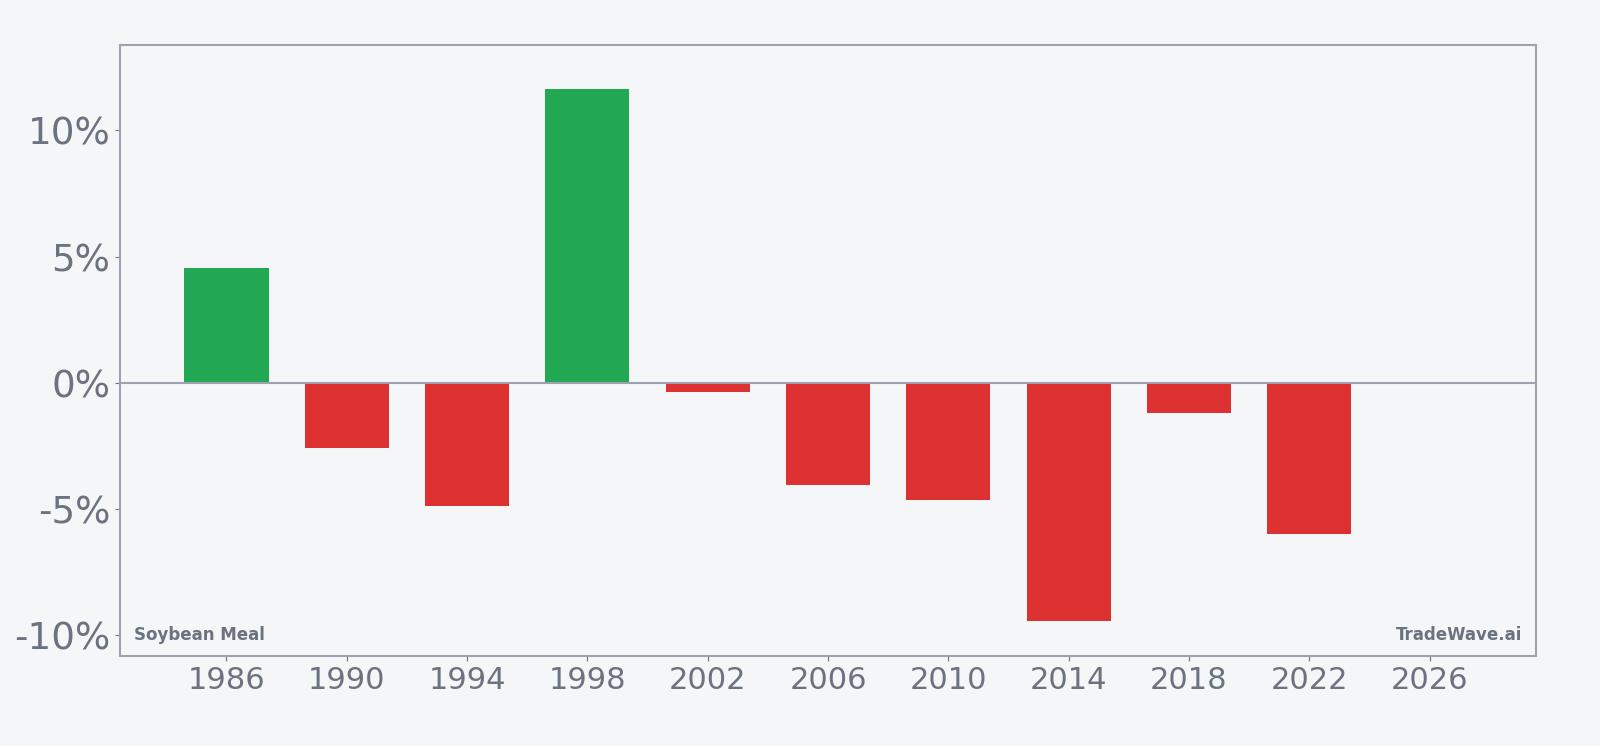
Soybean Meal has fallen in 8 of 10 midterm-election-year windows starting around Jul 12, with an average 4.14% gain in winning short years.
- 8 wins and 2 losses for short trades in this 11-day window, with winning years averaging 4.14% moves in the trade direction.
- The window begins on Jul 12 and runs for 11 calendar days, grouped across the last 10 midterm election years rather than consecutive calendar years.
- Percent Profitable sits at 80%, with 8 winners and 2 losers across the sample.
- Including every year, Avg Profit - All is 2%, reflecting that losing years have been meaningfully larger than the median outcome.
- Average loss in the two unfavorable years is 8.09%, underscoring that adverse moves against the short can be sharp.
- The TradeWave Ratio of 1.38 and a Sharpe ratio of 0.27 point to a window where price often travels meaningfully in the trade direction but with moderate risk-adjusted consistency.
According to historical data from TradeWave.ai, this mid-July stretch in midterm election years has behaved differently from a typical summer for Soybean Meal, and the next iteration is only days away.
How has Soybean Meal (ZM) traded in this mid-July window?
Soybean Meal has delivered profitable short setups in 8 of the last 10 midterm-election-year windows that start around Jul 12 and last 11 calendar days, with winning years averaging 4.14% moves in the trade direction. Futures settled at 314.7 in the prior session, leaving the contract about 8.2% below its 52-week high of 342.7 and roughly 18.1% above the 52-week low of 266.5. That combination of a clear historical seasonal bias and a price sitting mid-range on the chart gives this upcoming Soybean Meal trading window unusual weight for risk managers and directional traders.
Grouping the data by the presidential election cycle matters here because this pattern only looks at the last 10 midterm election years, a phase that often brings shifting farm policy debates, trade negotiations and budget wrangling that can alter grain and oilseed flows. In this context, the mid-July Soybean Meal seasonal pattern is not just a generic summer trend but a recurring feature of how feed markets have behaved in the middle of the political cycle.
Historically, the trade direction for this window has been short, meaning the favorable years for the pattern are those where Soybean Meal prices drifted lower over the 11-day span. With 80% of the sampled midterm years producing profits for shorts and only 2 losing years, the win–loss record is unusually clean for a commodity contract that often trades on weather and headline risk. At the same time, the 2% Avg Profit - All shows that when the pattern misses, it tends to miss by enough to drag down the overall average.
The per-year table shows how that plays out in practice. In 1998, for example, a short entry around 170.9 and exit near 190.8 translated into an 11.64% loss for the pattern, with the best intraperiod move against the short reaching a 15.86% rally from entry. By contrast, 2014 delivered one of the strongest years for the short setup, with Soybean Meal sliding 9.42% from 421.5 to 381.8 and the worst drawdown against the trade limited to about 10.75% from entry.
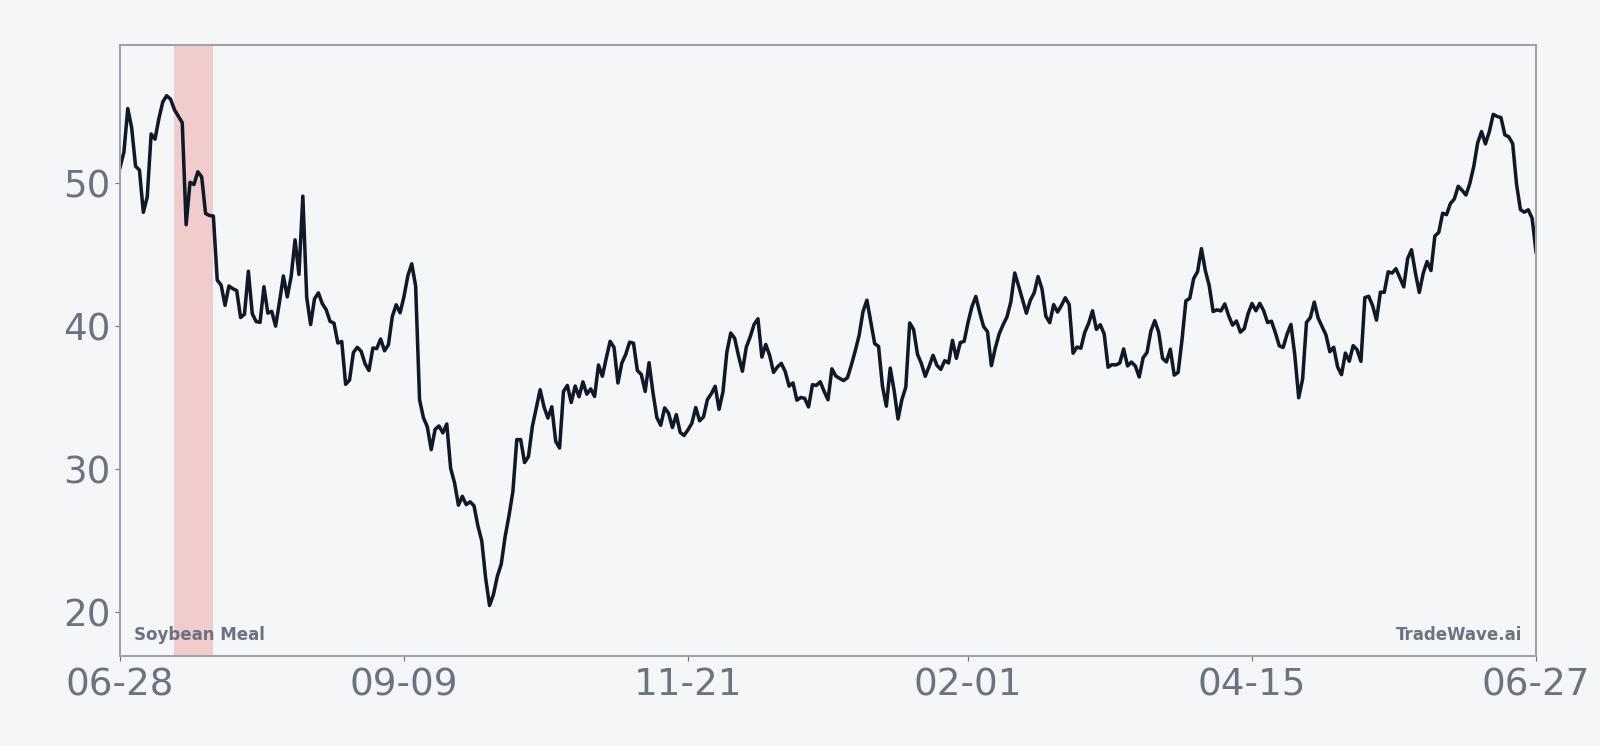
The historical seasonal average suggests that much of the move in winning years tends to accrue steadily rather than in a single collapse, with the trend line tilting lower across the bulk of the 11-day span. That profile fits a market where hedging flows and positioning adjustments around crop reports and export programs gradually pressure prices instead of triggering one-off air pockets.
Year-by-year bars that combine net results with best and worst intraperiod swings show how far Soybean Meal has typically moved in both directions during this window.
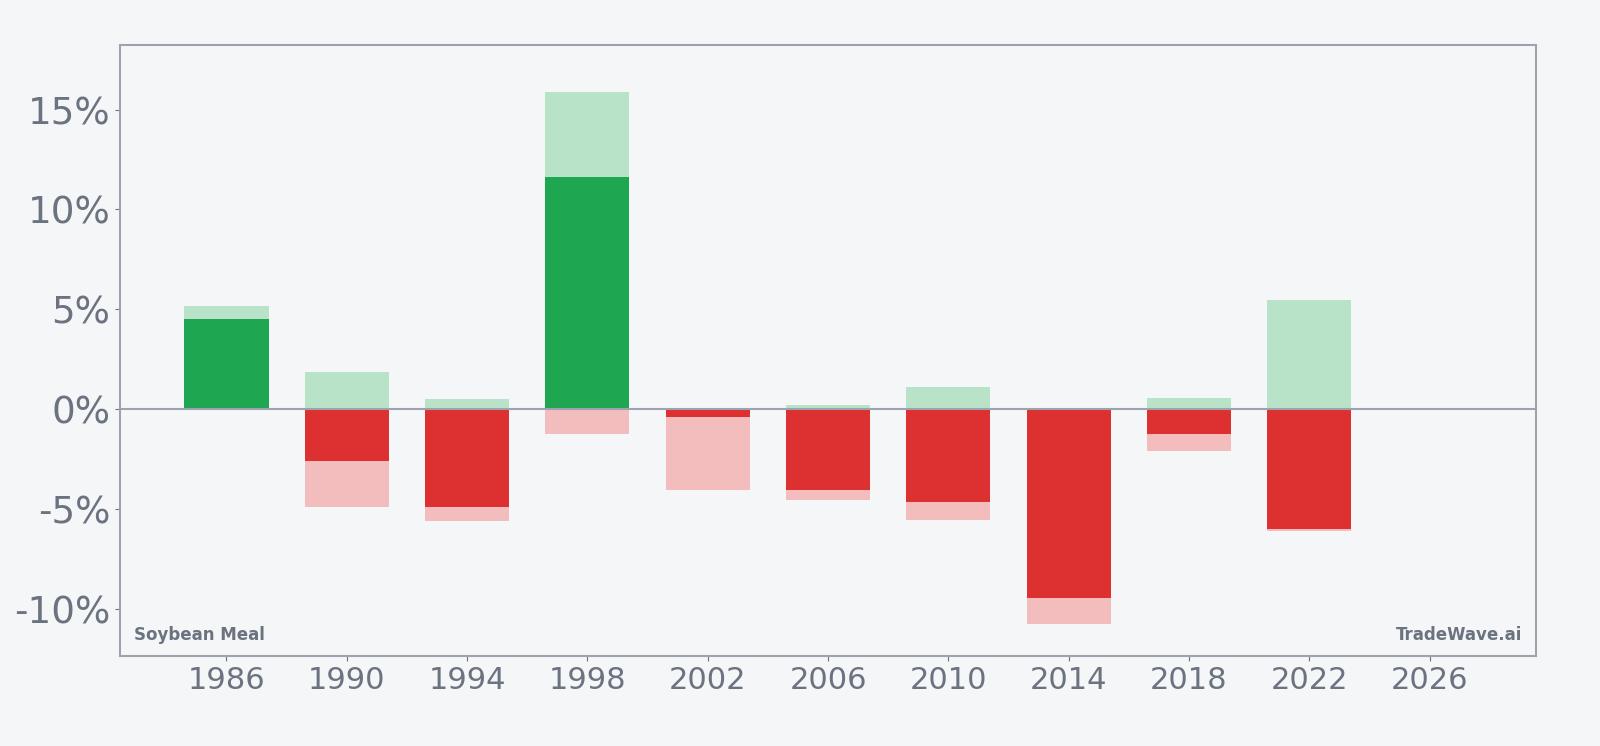
The combined net, maximum favorable excursion and maximum adverse excursion bars underline that this is a window with real two-way risk. In several years, shorts enjoyed sizable peak gains before giving some of them back by the close, while in others the worst drawdown against the trade approached or exceeded the final loss. Add it up: this is a historically short-friendly window with 8 wins out of 10, but the losing years have been large enough to matter.
History does not guarantee future results; adverse excursions can be large even in winning windows, and traders should size positions with that downside in mind.
Why does Soybean Meal (ZM) follow this seasonal pattern?
This mid-July Soybean Meal seasonal pattern likely reflects a mix of crop-supply updates, export program adjustments and feed buyers locking in coverage as the U.S. growing season progresses. Analysts have pointed to USDA supply estimates and shifting expectations for U.S. soybean ending stocks as key drivers of grain and oilseed price pressure in some years, which can spill directly into Soybean Meal pricing. The midterm-election-year focus may also capture recurring policy and trade headlines that influence how aggressively crushers and exporters commit to forward sales in this part of the calendar.[2]
What is driving Soybean Meal (ZM) today?
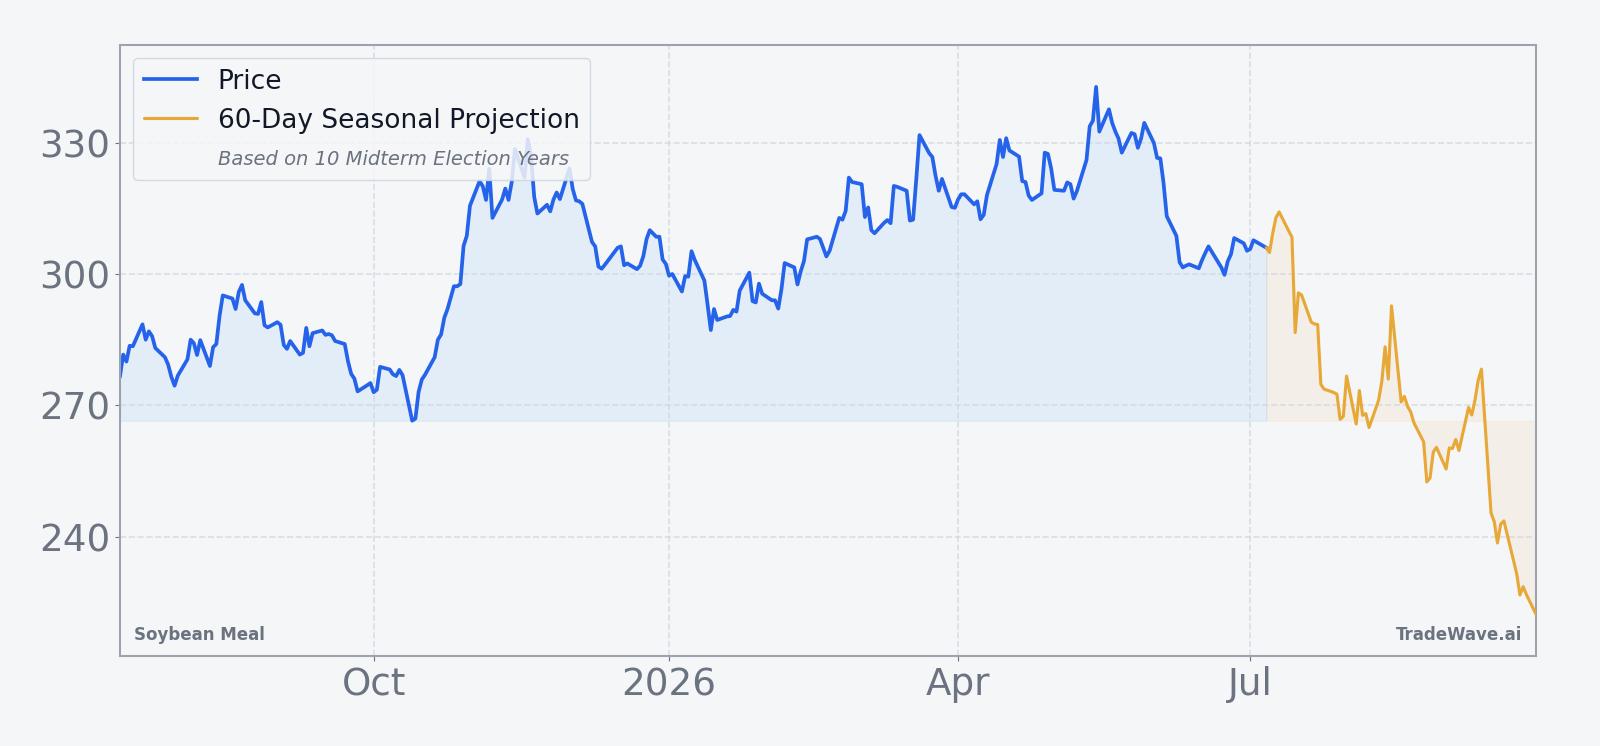
Soybean Meal futures finished the prior session at 314.7, down 0.1% on the day, with the contract trading in a band between 310.7 and 315.0 on relatively light volume of 7,012 contracts versus a 20-day average of about 63,141. That leaves ZM roughly in the middle of its 52-week range, about 8.2% below the high at 342.7 and 18.1% above the low at 266.5, a neutral starting point as traders look ahead to the next set of crop and export updates.
In Jan 2026, the U.S. Department of Agriculture raised crop-supply estimates for corn and soybeans, pressuring grain and oilseed prices and reminding traders how quickly balance-sheet revisions can reset the feed complex.[2] Earlier discussions about China’s soybean import needs and the growing role of Brazil as a key supplier have also reshaped expectations for where crushing and Soybean Meal production will occur, with implications for U.S. export competitiveness and domestic availability.[1] Against that backdrop, Soybean Meal remains a core protein input for industrialized animal feed, so even modest price shifts can ripple through livestock margins and feed-buying behavior.[1]
The chart below shows how the latest pullback fits into the past year of trading, alongside a 60-day seasonal projection path.
What should traders watch as this Soybean Meal window opens?
With the mid-July window only a few sessions away, the first thing to watch is whether Soybean Meal continues to hover in the 310 to 320 zone or breaks toward either the 52-week high near 343 or the low around 266. A push toward the upper end of that range before Jul 12 would give the historical short pattern more room to work, while a slide toward the lower band could blunt the typical downside.
Second, policy and data catalysts matter. Any fresh USDA supply revisions, export-sales surprises or signals about Chinese soybean buying could quickly change the tone in the feed complex, especially given prior episodes where higher supply estimates knocked grain and soybean prices sharply lower.[2] Traders should also keep an eye on Brazil’s export pace and crush margins, since shifts there can redirect Soybean Meal flows and alter how much pressure lands on U.S. futures.[1]
Finally, behavior inside the 11-day window will be the real test of this historical seasonality. A pattern-consistent move would see Soybean Meal drift lower with intraperiod rallies that stay smaller than the eventual downside, echoing the majority of past midterm years. A sharp squeeze higher that erases early declines or pushes ZM back toward its 52-week high would instead look more like the 1998 or 2010 outliers, reminding traders that even strong seasonal tendencies can be overwhelmed by new information.
Sources
About this seasonal analysis
Seasonal pattern data is sourced from TradeWave.ai, which analyzes historical price behavior across annual calendar windows going back up to 30 years. Read the full data methodology or the book The 100-Year Pattern by Afshin Moshrefi (2026 edition). Past performance of seasonal patterns does not guarantee future results. This article is for informational purposes only and does not constitute investment advice.