Corn (CME) (ZC) Has Dropped in 9 of 10 Years in This 50-Day July-August Window
Corn (CME) is rallying into harvest season even as a historically weak 50-day window opens this week, setting up a clash between bullish price action and a decade of bearish seasonality.
Price as of Jul 7, 2026: $459.75 (intraday).

What is the seasonal pattern for Corn (CME) (ZC)?
Corn (CME) has fallen in 9 of 10 years during this 50-day July–August window, with an average gain of 10.93% in winning years for the short side.
- 9 for 10 in this window, with the short side averaging 10.93% gains in winning years and a 10% average across all years.
- The upcoming 50-day Corn (CME) trading window starts Jul 9 and has historically favored downside moves for ZC futures.
- Percent Profitable stands at 90%, with 9 winners and 1 loser for the short trade direction over the past decade.
- Avg Profit reflects winners only at 10.93%, while Avg Profit - All, which includes the lone losing year, is still a robust 10%.
- The TradeWave Ratio of 2.11 signals that price has typically traveled meaningfully in the short direction inside the window, with sizable intraperiod swings.
- A Sharpe ratio of 1.61 for this pattern points to historically strong risk-adjusted returns for traders positioned with the seasonal trend.
According to historical data from TradeWave.ai, this mid-July window in Corn (CME) has behaved very differently from an average month on the calendar, and the next iteration begins in days.
How has Corn (CME) (ZC) traded in this July–August seasonal window?
Corn (CME) has dropped in 9 of the past 10 years during the 50-day window that starts on Jul 9, with the short side posting an average 10.93% gain in winning years and a 10% average across all years. That pattern kicks in again this Thursday just as front-month ZC futures trade at 459.75 cents per bushel, up 4.3% on the prior session and sitting about 4.6% below their 52-week high of 481.75. For a market that anchors global feed, ethanol and food costs, a decade-long tendency for late-summer weakness is a seasonal signal grain traders cannot ignore.
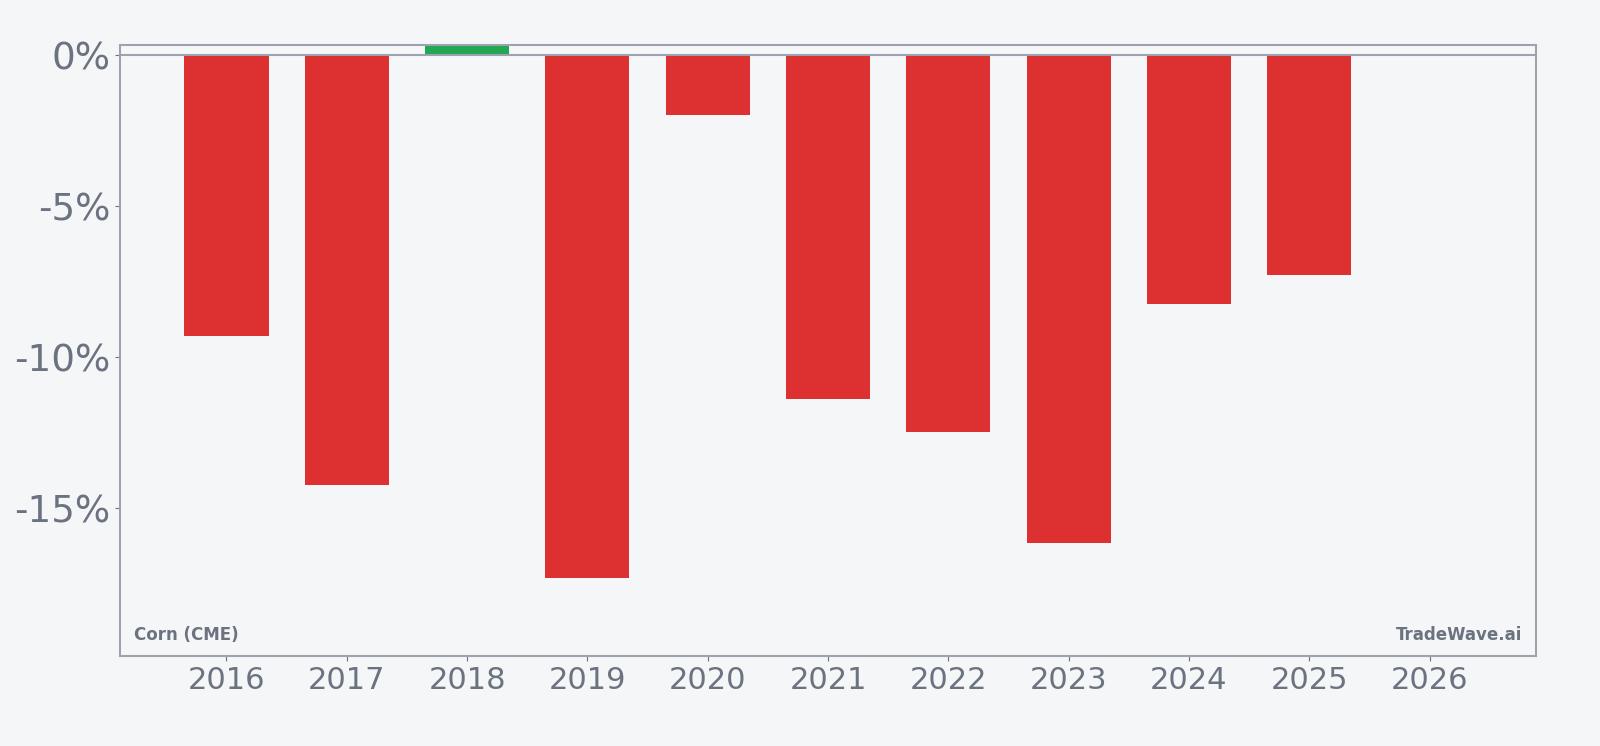
Trade direction for this setup is explicitly short, which means years where corn prices fell during the window were favorable for the pattern, while rallies counted as losing years. Across the last decade, 9 of 10 iterations delivered profits for shorts, with only 2018 posting a small 0.29% loss against the trade. The median outcome sits at a 10.35% gain for the short side, close to the 10.93% average winner, which suggests the typical successful year has not relied on a single outlier collapse.
The per-year table shows several heavy downside stretches. In 2019, the short trade gained 17.31% as prices slid from 431.75 to 357.00 cents, while 2017 and 2022 also delivered double-digit percentage gains for bears as corn retreated from elevated levels. Even the milder years often saw meaningful intraperiod swings: 2020 booked a modest 1.99% profit for shorts, but the worst drawdown inside the window still reached 12.53% against the position before prices rolled over.
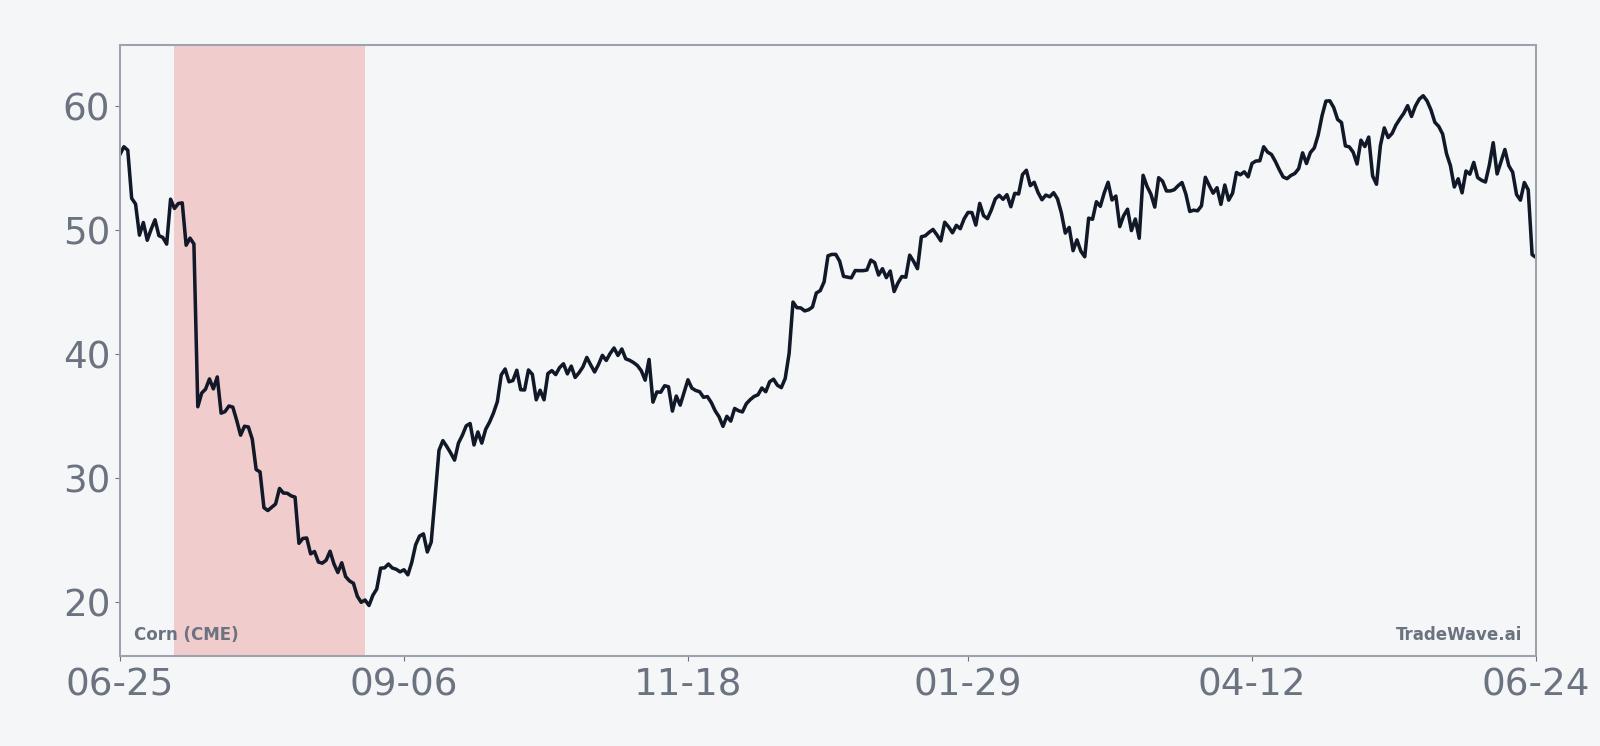
The historical seasonal average shows corn futures tending to roll over early in the window, with weakness often building through the middle weeks before stabilizing toward the end. That shape lines up with the fundamental calendar, where U.S. crop prospects become clearer and weather risk starts to shift from planting to yield, often easing the fear premium that can support prices in late spring and early summer.
Yearly net and peak moves highlight how far prices have swung in both favorable and adverse directions inside this window.
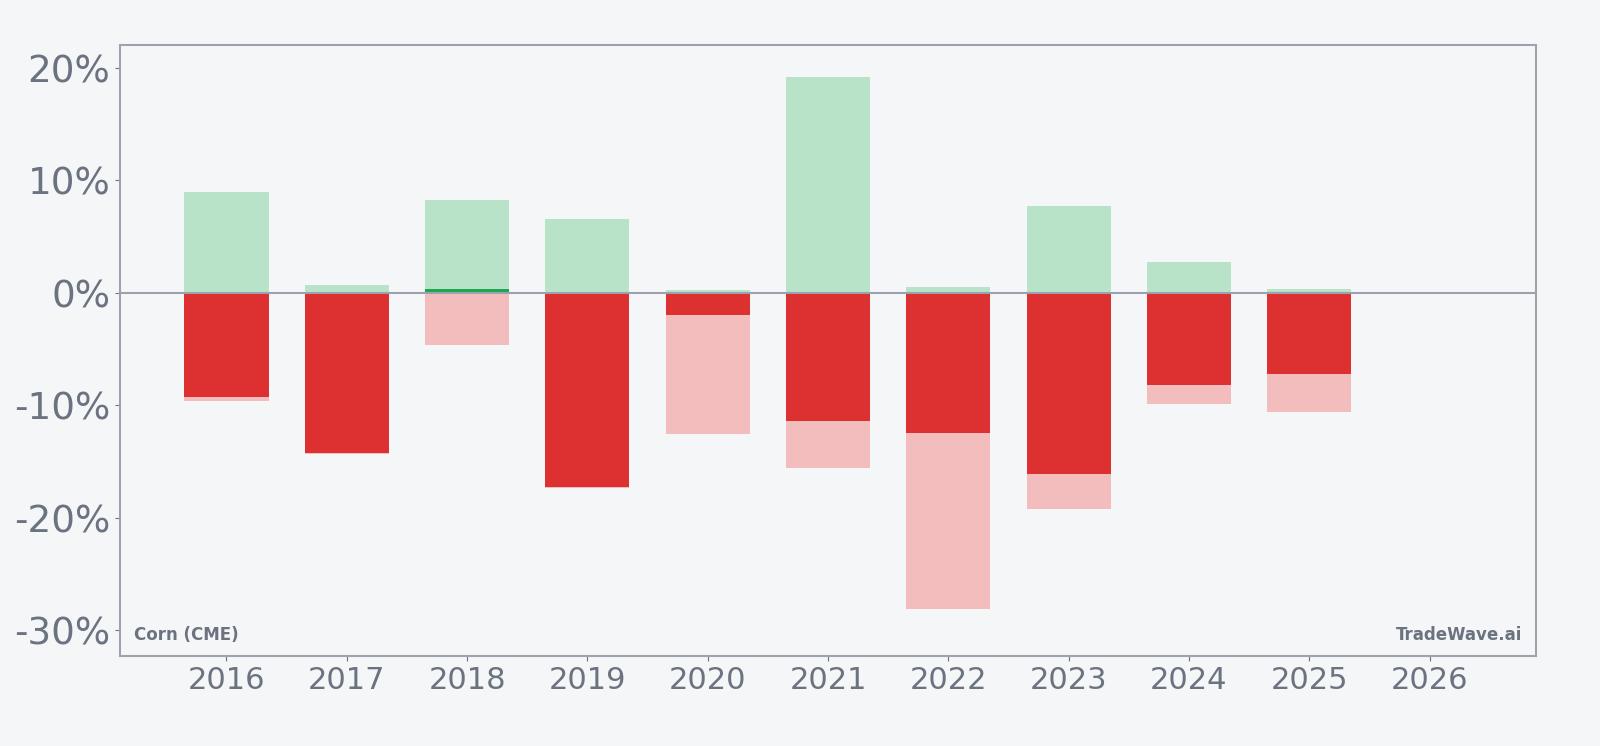
The combined net, MFE and MAE bars underline how volatile this seasonal stretch can be. In strong years for the pattern such as 2019 and 2023, maximum favorable moves for shorts reached into the mid-teens, while adverse excursions often stayed in single digits. In tougher years like 2021, corn first spiked as much as 19.17% against the short before reversing into an 11.39% profit, a reminder that even winning windows can involve deep drawdowns before the seasonal trend reasserts itself.
The cumulative return profile across the decade adds up to a 151% gain for the short strategy, annualized at 9.67% with a Sharpe ratio of 1.61. Put simply, this has been one of the more consistent bearish seasonal stretches on the corn calendar, with only a single mild miss and several years delivering double-digit percentage declines from entry to exit.
History does not guarantee future results; adverse excursions (MAE) can be large even in winning windows.
Why does Corn (CME) (ZC) follow this seasonal pattern?
This late-summer pattern likely reflects classic commodity supply and demand seasonality. One likely driver is that by July and August, U.S. crop conditions and acreage are better known, so weather risk premiums built earlier in the year often bleed out as traders price in more concrete yield expectations. Analysts also point to shifting demand from ethanol and feed markets, plus hedging flows from producers and end users, which can tilt the order book toward selling pressure as harvest approaches.
What is driving Corn (CME) (ZC) today?
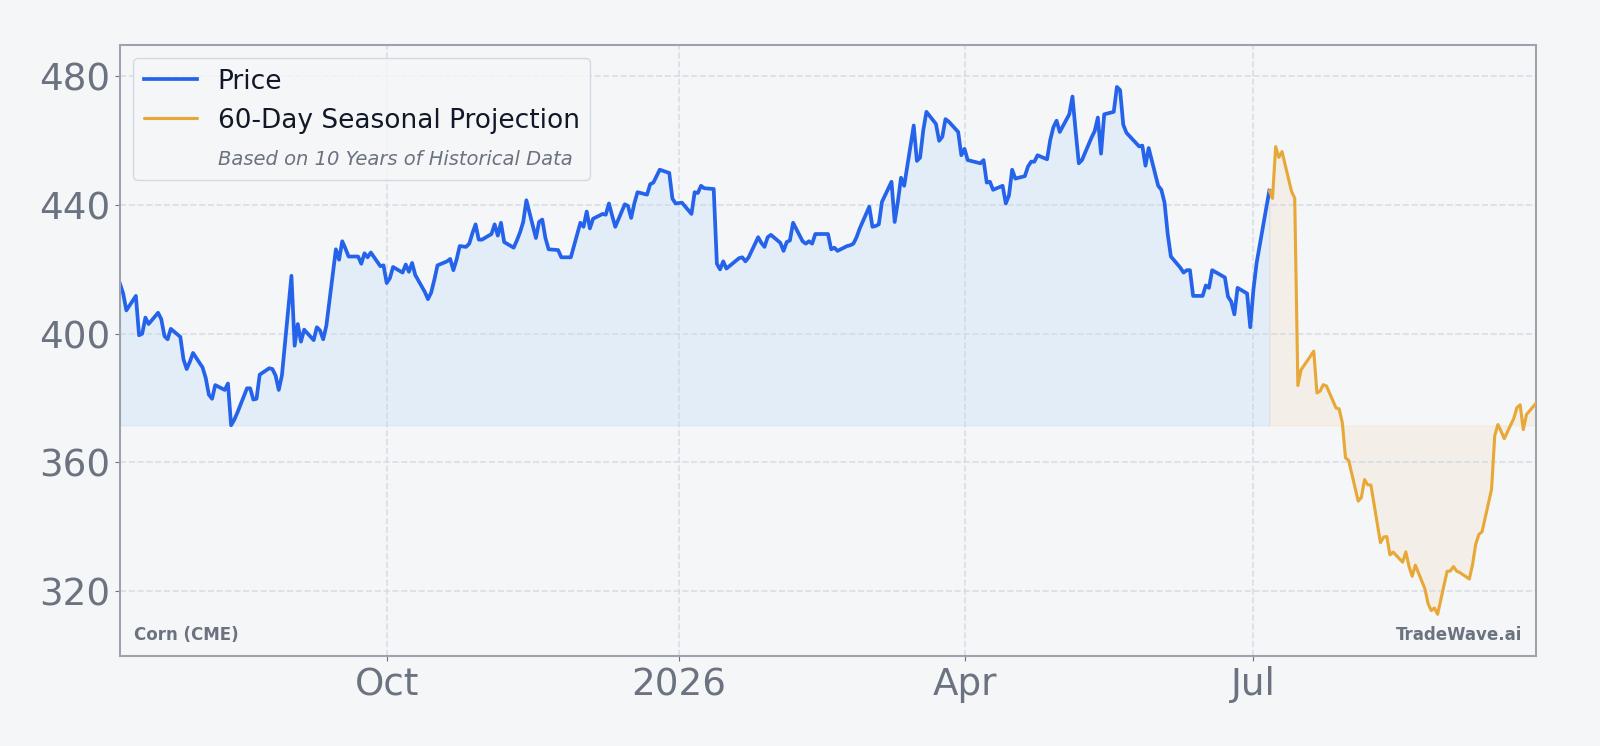
Corn futures are entering this seasonal window from a position of strength. Front-month ZC settled at 459.75 cents per bushel in the prior session, up 19 cents or 4.3% on the day, extending a 7.95% one-month gain and leaving prices about 24.7% above the 52-week low of 368.75 while still below the 52-week high of 481.75. Volume at 42,287 contracts ran well below the 20-day average of 196,528, suggesting the latest pop has not yet drawn in heavy new participation.
The macro backdrop has been tilting against grains for much of the year. In January 2026, the USDA’s World Agricultural Supply and Demand Estimates lifted projected U.S. corn ending stocks to 2.23 billion bushels, roughly 200 million bushels above the prior estimate, reinforcing a comfortable supply cushion that weighed on prices at the time.[1] By Apr 30, improved weather across the U.S. Corn Belt and a retreat in crude oil prices further undercut bullish arguments, as better planting conditions and cheaper energy reduced concerns about tight feed and biofuel markets.[2]
Those same forces still frame the grain sector’s seasonal outlook. Higher ending stocks give the market more room to absorb weather surprises, while the link between corn and oil through ethanol demand means any renewed slide in crude could again pressure ZC. Sector commentary around grains and farm inputs has emphasized how crop supply projections and biofuel/feedstock dynamics are steering price action, with corn sitting at the center of that cross-current.[2]
Positioning has also leaned defensive. Commodity funds were reported as net sellers of corn in late April, a sign that systematic and discretionary managers had been trimming exposure as weather improved and macro support faded.[2] With prices now rebounding into a historically weak seasonal stretch, the key question for traders is whether that selling pressure returns if weather stays cooperative and the USDA’s comfortable stockpile projections hold.
The chart below situates the latest bounce against the past year’s trading range and a 60-day seasonal projection.
What should traders watch in this Corn (CME) seasonal window?
Three things will matter most as this 50-day window opens. First, watch how ZC behaves around the 480-cent area, near the 52-week high; a failure to break that zone and a turn back below the 50-day moving average around 441.54 would be more in line with the historical pattern of late-summer softness. Second, monitor USDA updates on crop conditions and any revisions to the 2.23 billion bushel ending-stocks projection, since surprise downgrades to yield or stocks could blunt the usual seasonal downside.[1]
Third, keep an eye on macro drivers and fund flows. If crude oil resumes its decline and Corn Belt weather stays benign, the combination of cheaper energy and solid supply could reinforce the decade-long tendency for corn to fade in this stretch.[2] A renewed wave of fund selling similar to late April would confirm that larger players are leaning back into the bearish seasonal trend, while a sustained bid from hedgers or end users would signal that this year’s window may diverge from history. For traders, the test over the next seven weeks is whether price action, inventory data and positioning line up with the 9-for-10 record that has defined this July–August pattern.
Sources
About this seasonal analysis
Seasonal pattern data is sourced from TradeWave.ai, which analyzes historical price behavior across annual calendar windows going back up to 30 years. Read the full data methodology or the book The 100-Year Pattern by Afshin Moshrefi (2026 edition). Past performance of seasonal patterns does not guarantee future results. This article is for informational purposes only and does not constitute investment advice.