Neutral Prices, Bearish History: Lean Hogs (HE) Enters 50-Day Midterm Slide Zone
Lean Hogs futures sit in the middle of their 52-week range just as a 50-day midterm-year seasonal window opens that has delivered consistent downside in past cycles.
Price as of Jul 6, 2026: $93.35 (last close).
What is the seasonal pattern for Lean Hogs (HE)?
Lean Hogs has fallen in 10 of 10 midterm-year summer windows during this 50-day pattern, with an average gain of 20.32% in winning short trades.
- 10 for 10 in this window, with short trades averaging 20.32% gains in winning years.
- The 50-day Lean Hogs trading window starts Jul 7 and has been a consistently bearish stretch for prices in midterm election years.
- Percent Profitable is 100%, with 10 winners and 0 losers across the last 10 midterm-year cycles.
- Avg Profit of 20.32% reflects sizeable downside moves in Lean Hogs during this historical seasonality window.
- The TradeWave Ratio of 1.81 signals that price typically travels far in the trade direction within the window, while a Sharpe ratio of 1.63 shows strong risk-adjusted returns for the pattern.
- Intraperiod swings have been large, with some years showing deep adverse moves before the short-side trend reasserted itself.
According to historical data from TradeWave.ai, this midterm-year summer stretch in Lean Hogs has behaved very differently from an average month on the calendar, and the next 50 days sit squarely inside that pattern.
How has Lean Hogs (HE) traded in this midterm-year summer window?
Lean Hogs has dropped in every single midterm-year summer window for the last 10 cycles, with short trades averaging 20.32% gains over the 50-day stretch. The new window starts today with front-month futures around 93.35, roughly in the middle of a 52-week band that runs from 77.35 to 110.025. That combination of a neutral starting point and a historically one-sided pattern gives hog traders a very different playbook from the usual summer chop.
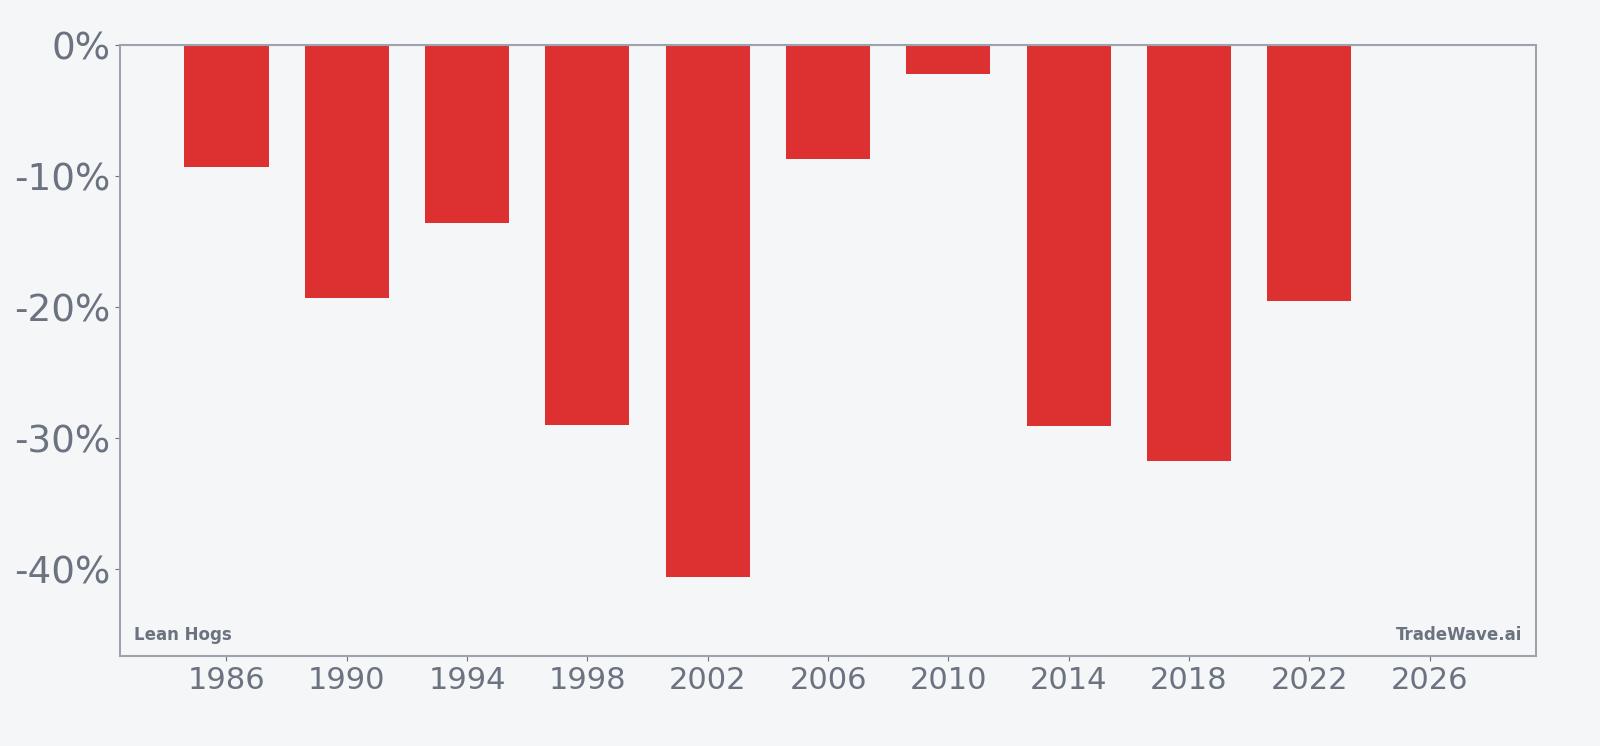
Because this pattern is grouped by the presidential election cycle, it only looks at midterm election years, not a simple run of consecutive calendar years. That matters for hogs because midterm summers often coincide with shifting farm policy debates, budget wrangling and trade headlines that can hit livestock demand and feed costs at the same time.
Across the last 10 midterm election years, every iteration of this 50-day window has seen Lean Hogs finish lower, which is a winning outcome for the short-side trade direction. The average profit of 20.32% reflects sizeable declines from entry to exit, while the median profit of 19.43% shows that the typical year has not been an outlier-driven story. Add it up and the cumulative return for the pattern is 507%, with an annualized return of 19.77% for traders who only engaged during this specific slice of the calendar.
The per-year table shows how broad-based that weakness has been. In 2002, for example, Lean Hogs fell 40.58% from an entry near 54.90 to an exit around 32.62, with the worst intraperiod drawdown from entry reaching about 40.71% before the window closed. In 2014, the contract slid 29.1% from roughly 131.80 to 93.45, again delivering a strong result for shorts even as the maximum adverse move from entry was about 31.37% at one point in the window.
Year-by-year net returns and intraperiod swings show how far Lean Hogs has tended to move in this window.
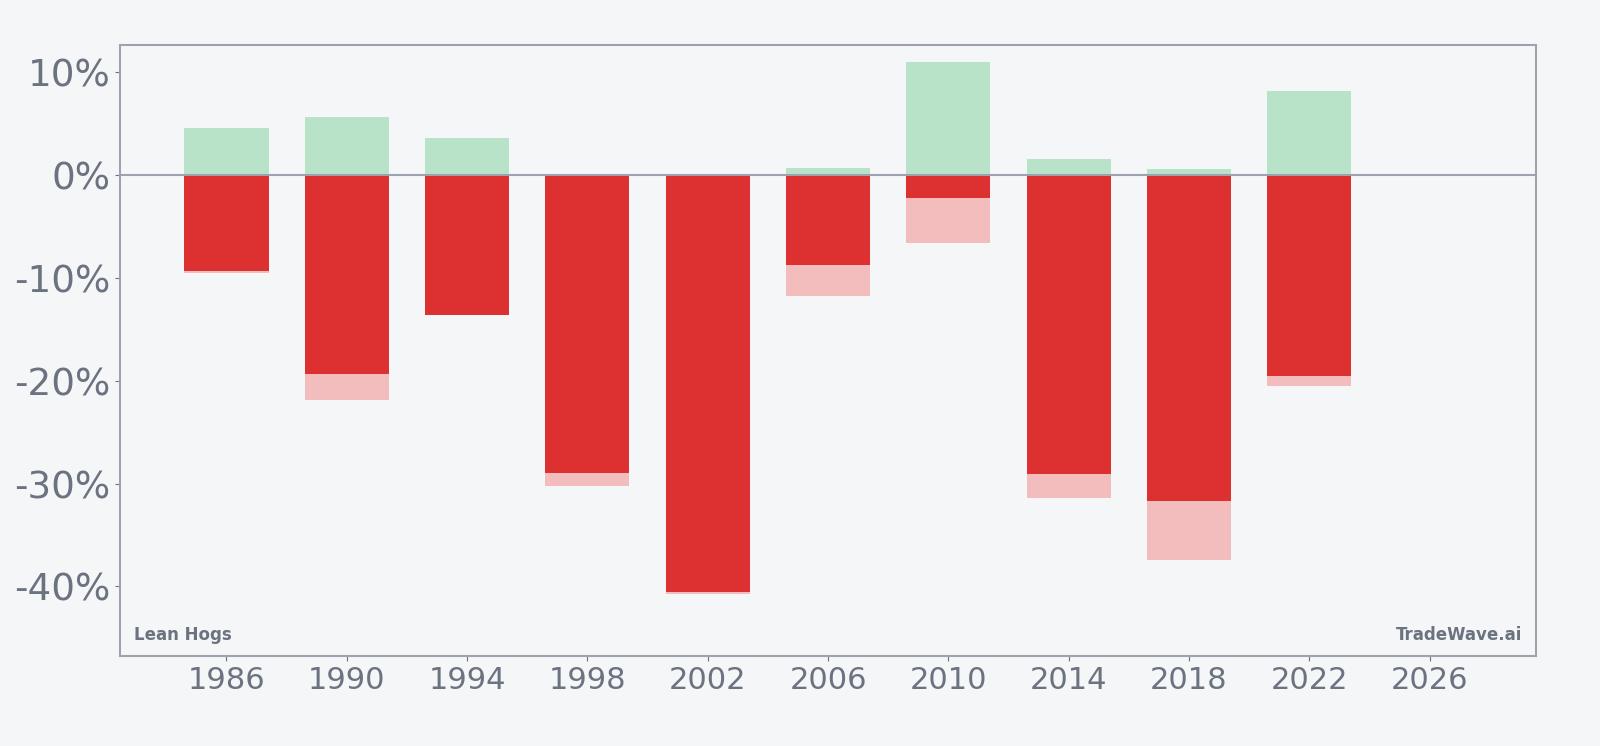
The maximum favorable move in many years has been large, which is what you would expect in a pattern that has delivered double-digit percentage declines in most cycles. At the same time, the maximum adverse move has also been meaningful in several years, with 2010 standing out as a choppier case where Lean Hogs rallied more than 11% at one point before finishing the window only 2.26% lower from entry. The Sharpe ratio of 1.63 suggests that, taken as a package, the end-of-window outcomes have been strong relative to volatility, but the intraperiod path has not been a straight line.
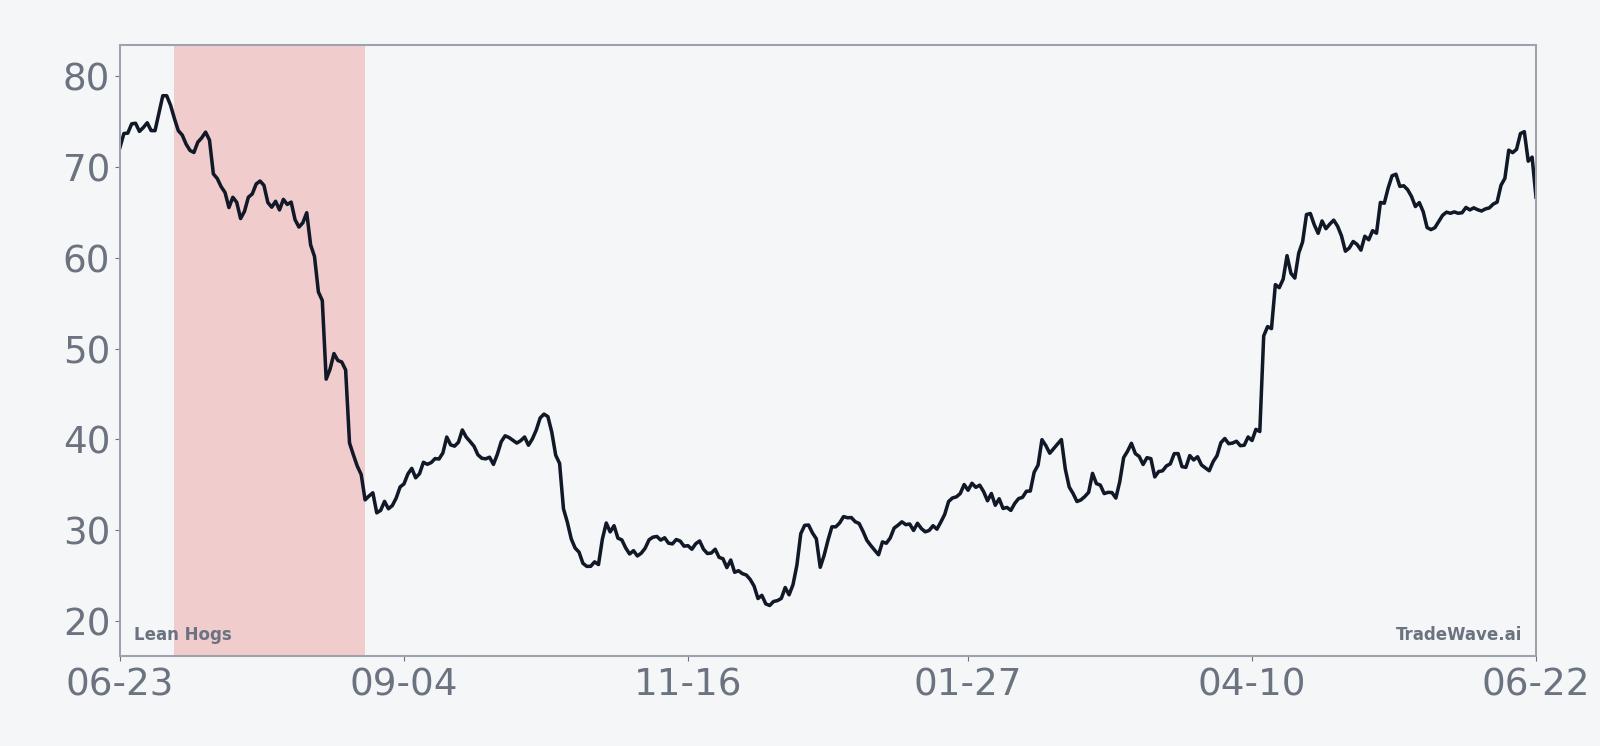
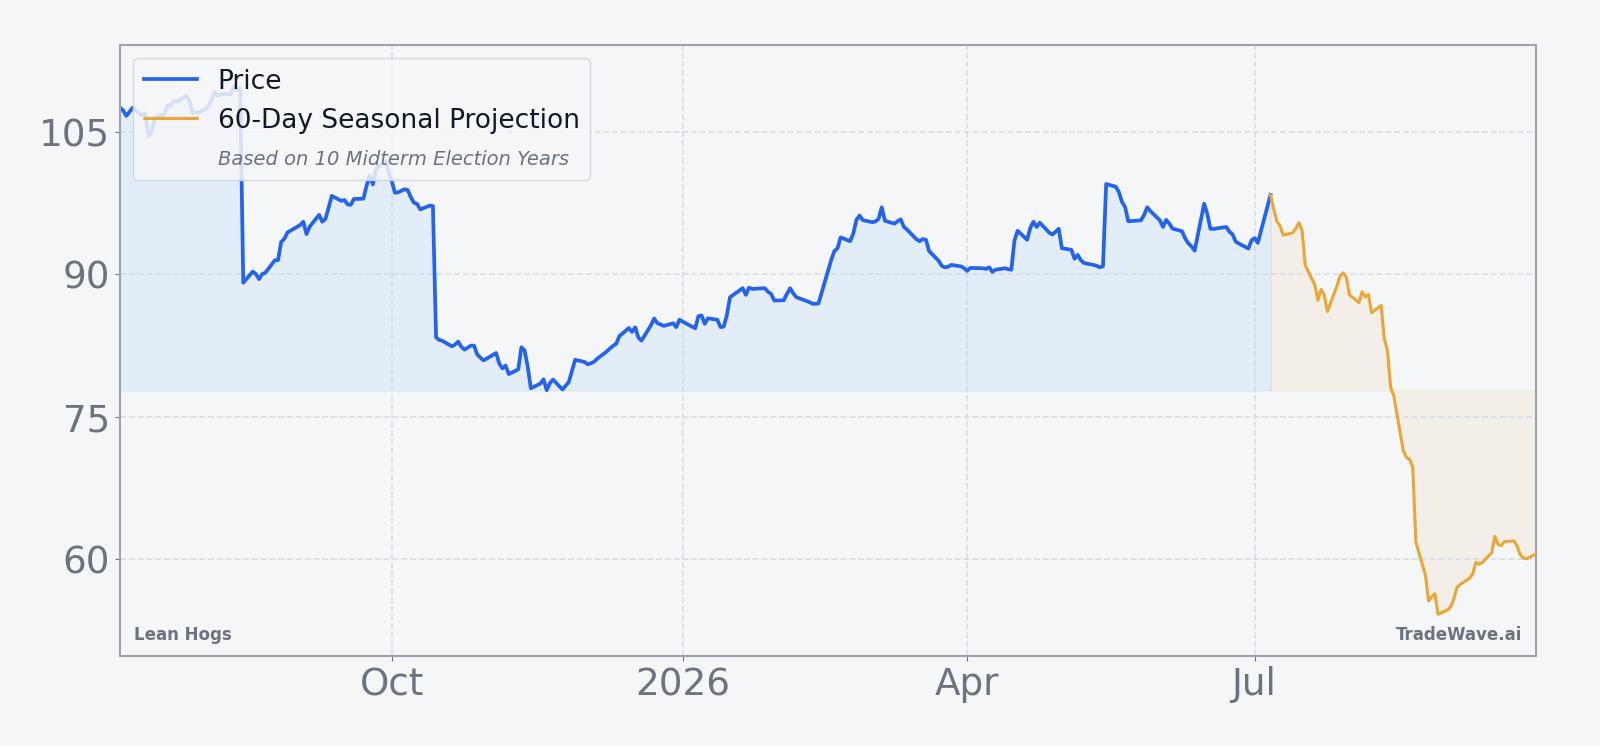
The trend chart shows that the typical pattern is not an immediate collapse. Prices often hold or even firm slightly in the early days of the window before the downtrend accelerates into the back half of the 50-day stretch. That timing nuance matters for traders who are watching for confirmation from spot price action rather than leaning solely on the calendar.
History does not guarantee future results; adverse excursions can be large even in winning windows, and short trades in Lean Hogs carry their own liquidity and gap risks.
Why does Lean Hogs (HE) follow this seasonal pattern?
One likely driver is commodity supply and demand seasonality in the hog complex, where summer slaughter schedules, heat stress and feed cost dynamics often collide with shifting consumer demand for pork. Analysts also point to the midterm election year policy calendar, when farm bill debates, trade negotiations and biofuel mandates can inject extra uncertainty into livestock margins. This pattern may reflect hedging flows from producers and packers who routinely adjust coverage during this stretch, reinforcing the historical tendency for prices to soften.
What is driving Lean Hogs (HE) today?
Front-month Lean Hogs futures settled at 93.35 in the prior session, with the contract about 15.1% below its 52-week high of 110.025 and roughly 20.7% above the 52-week low of 77.35. That leaves prices in a mid-range zone rather than stretched at either extreme as the new seasonal window opens, and recent one-month performance of 3.41% suggests a modest upward drift into the start of the pattern rather than a sharp selloff or squeeze.
The chart below situates the latest move in its recent multi-month context alongside a 60-day seasonal projection.
Volume has been relatively contained, with 20-day average turnover around 11,039 contracts, which is consistent with a market that is not yet in panic mode. The 50-day simple moving average near 94.34 sits just above the latest close, hinting at a slight loss of momentum after the early-summer bounce. For hog producers, packers and speculative funds, that backdrop means the seasonal pattern is kicking in from a relatively balanced starting point rather than from an already oversold or overbought extreme.
What should traders watch in this Lean Hogs seasonal window?
First, watch how Lean Hogs behaves around the 94 area, which is close to the 50-day moving average and a natural pivot for short-term trend followers. A decisive break below that level early in the window would line up with the historical pattern of weakness building as the days progress, while a sustained push back above the mid-90s would signal that this cycle is starting on a firmer footing than usual.
Second, monitor intraday swings for signs that the typical path is unfolding. In prior midterm-year summers, some of the biggest short-side gains came after sharp countertrend rallies that shook out weak hands before the downtrend resumed. If this year follows that script, traders may see spikes of 5% to 10% against the trade direction inside the window before the broader move asserts itself.
Third, keep an eye on the broader livestock and grain complex for clues about feed costs and protein demand. Corn and soybean price shifts can quickly alter hog margin expectations, which in turn influence how aggressively producers hedge and how much speculative capital leans into or away from the seasonal pattern. Any surprise policy headlines on trade, animal health or farm support programs during this midterm election year could also amplify moves.
Finally, the clean 10-for-10 record in this window makes this cycle a useful test of how durable election-cycle seasonality is in a market that has become more financialized over time. If Lean Hogs starts to diverge meaningfully from the historical downtrend, especially by holding above the mid-90s and pushing back toward the 100 level, that would be an early sign that structural changes in demand, supply management or speculative participation are reshaping what has been one of the more reliable seasonal stretches on the livestock calendar.
Sources
About this seasonal analysis
Seasonal pattern data is sourced from TradeWave.ai, which analyzes historical price behavior across annual calendar windows going back up to 30 years. Read the full data methodology or the book The 100-Year Pattern by Afshin Moshrefi (2026 edition). Past performance of seasonal patterns does not guarantee future results. This article is for informational purposes only and does not constitute investment advice.