Improved Weather, Strong Exports Fail to Lift Corn (CME) (ZC) Ahead of Bearish July-August Stretch
Corn (CME) futures are surging off recent lows just days before a historically bearish 50-day window that has often rewarded short positions and punished late bulls.
Price as of Jul 2, 2026: $440.75 (last close).

What is the seasonal pattern for Corn (CME) (ZC)?
Corn (CME) has fallen in 9 of 10 years during this 50-day July–August window for short positions, with an average gain of 10.93% in winning years.
- 9 for 10 in this window, with short trades averaging 10.93% gains in winning years and a 10% average across all years.
- The 50-day seasonal window starts Jul 9 and has historically favored a bearish, short-side bias in Corn (CME) futures.
- Percent Profitable sits at 90%, with 9 winning short years and just 1 losing year across the past decade.
- Avg Profit reflects winners only at 10.93%, while Avg Profit - All, which includes the lone losing year, still comes in at 10%.
- The TradeWave Ratio of 2.11 suggests price has typically traveled meaningfully in the trade direction within the window, even when volatility picked up.
- A Sharpe ratio of 1.61 for this pattern points to historically strong risk-adjusted returns for traders aligned with the seasonal trend.
According to historical data from TradeWave.ai, this mid-summer stretch in corn has behaved very differently from an average month on the calendar, and the next iteration is about to start.
How has Corn (CME) (ZC) traded in this July–August window?
Corn (CME) has delivered profitable short trades in 9 of the past 10 years during the 50-day window that begins on Jul 9, with winning years averaging 10.93% gains and a 10% average across all years. Futures settled at 440.75 cents per bushel in the prior session, up 4.7% on the day and sitting between a 52-week low of 368.75 and a high of 481.75 as traders weigh supply-heavy fundamentals against a fresh seasonal downswing.
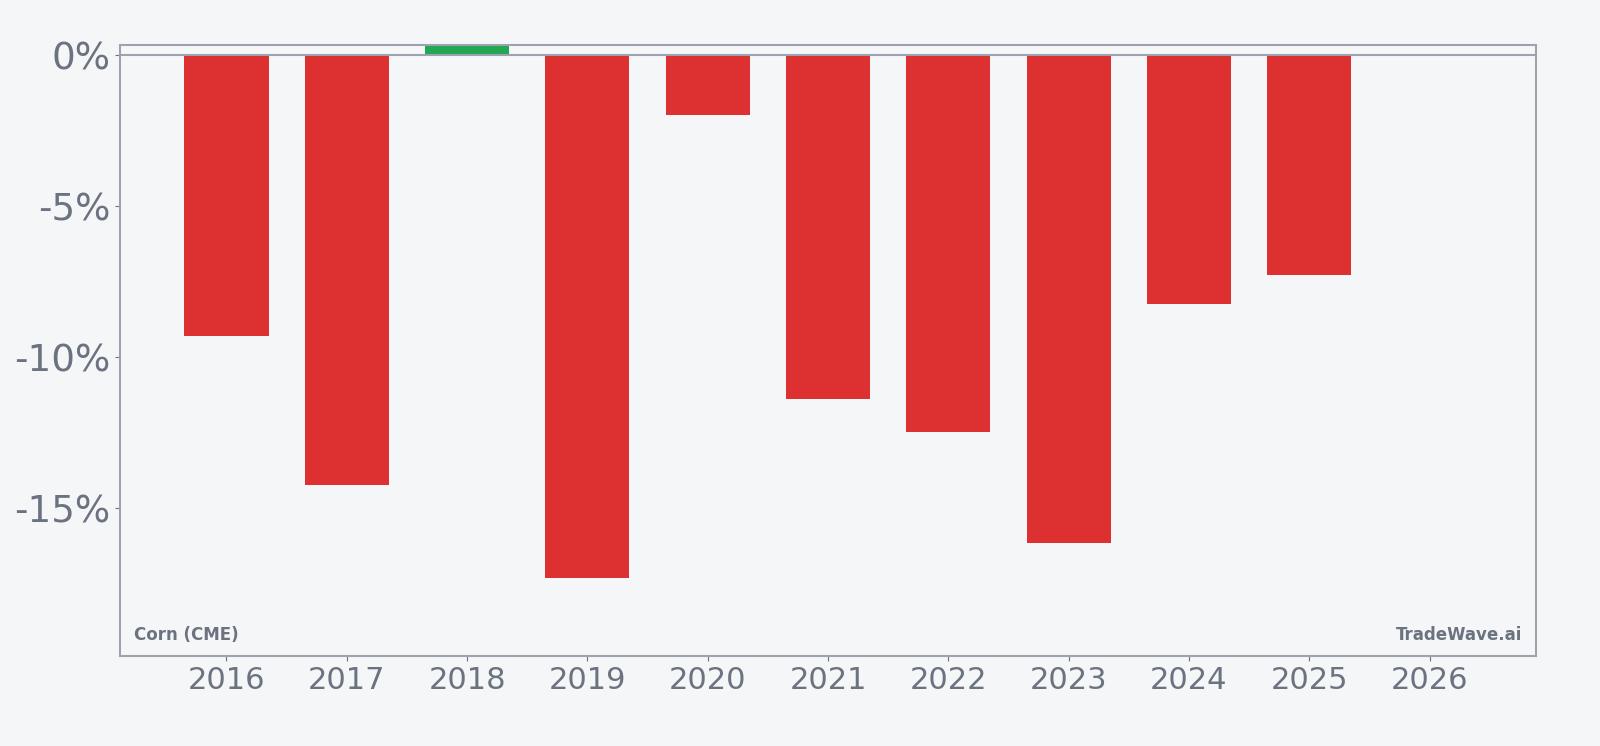
Trade Direction for this pattern is explicitly short, which means the historical “wins” are years when corn futures finished the window lower than they started. Across the last decade, only 2018 posted a small losing outcome for shorts, with a 0.29% net rise in prices, while years like 2019 and 2017 saw double-digit declines of 17.31% and 14.23% respectively for the underlying contract.
The average winner gain of 10.93% and the 10% Avg Profit - All show that even after including the lone losing year, the seasonal bias has been meaningfully bearish for corn prices in this stretch. Median Profit of 10.35% lines up closely with the average, which suggests the pattern is not being driven by a single outlier year but by a cluster of sizable short-side wins.
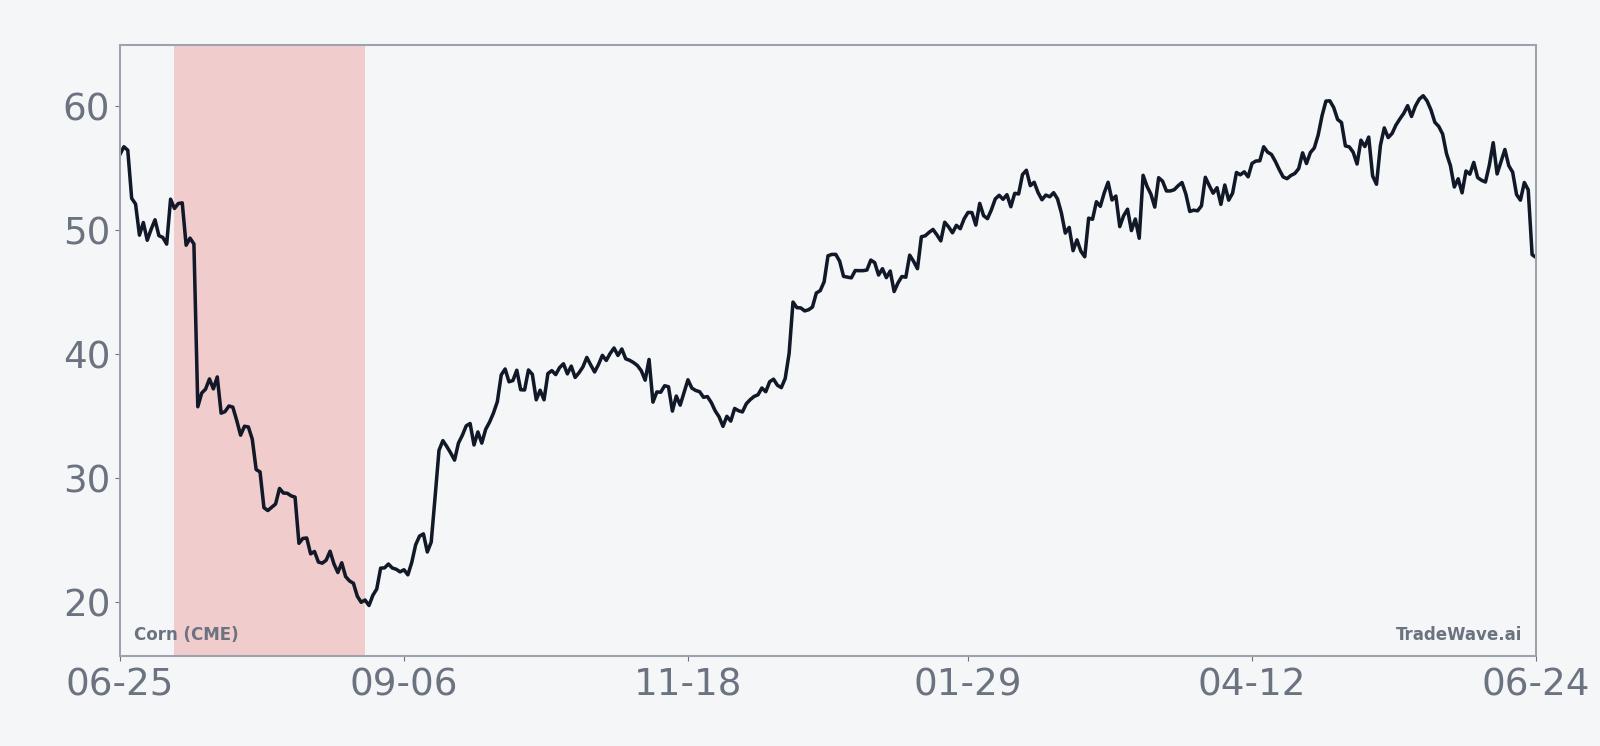
The historical seasonal trend line shows corn often starting the window with a modest drift before accelerating lower into the back half of the 50 days. That shape fits the idea of weather and yield clarity building through mid to late summer, when traders shift from fear of planting and early weather risk toward more confident supply expectations.
Year-by-year bars that combine net results with peak rallies and drawdowns show how far prices have swung inside this window.
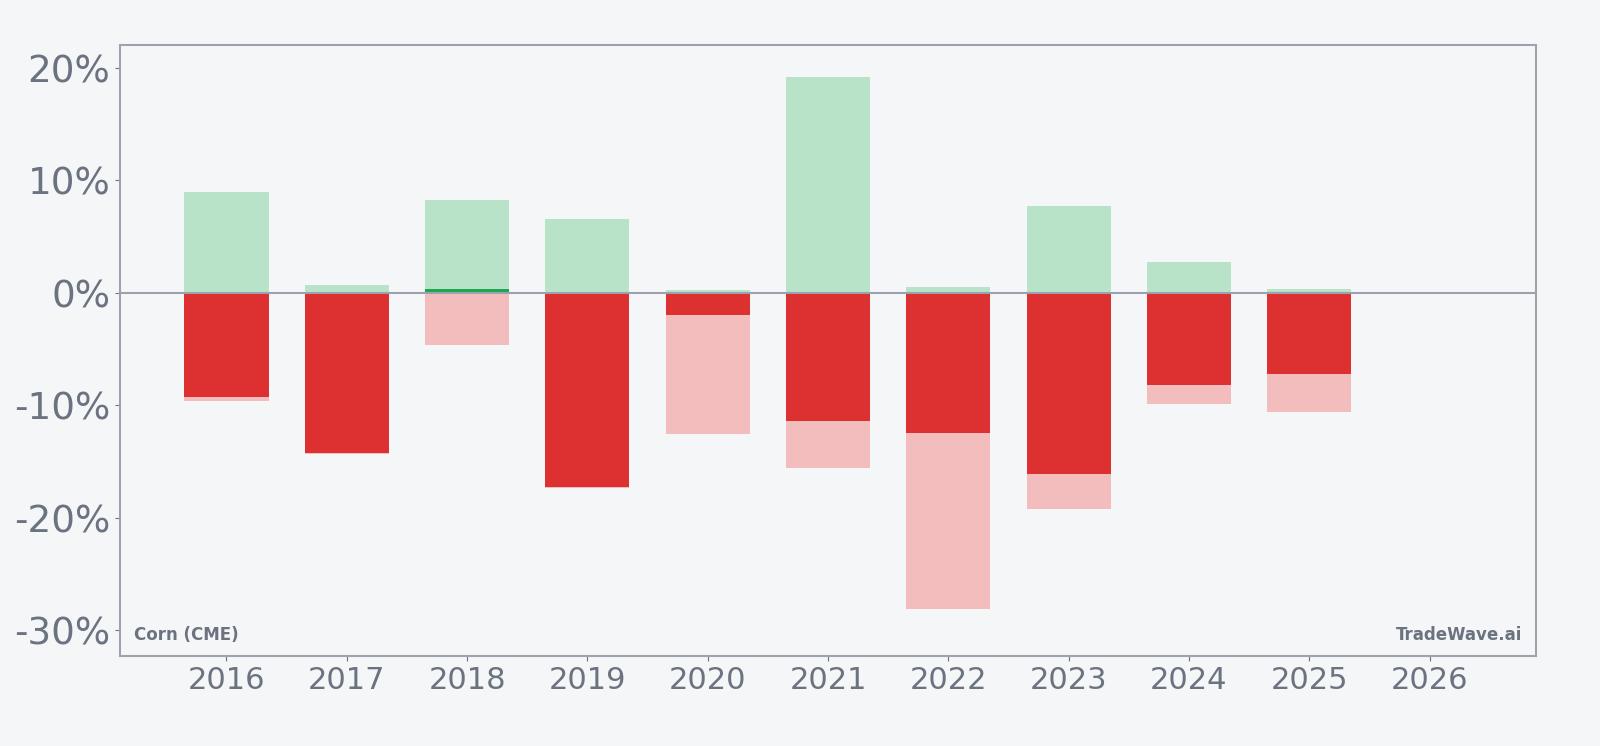
The MFE and MAE profile shows that in strong years for the pattern, shorts have often seen sizeable favorable moves, with maximum favorable excursions such as 19.17% in 2021 and 8.95% in 2016, while adverse swings have also been meaningful, including a worst intraperiod drawdown of 28.13% against shorts in 2022. That mix of large MFE and sizable MAE points to a high-variance window where price can travel far in both directions before settling lower by the close.
Put together, the record is striking: 9 winners, 1 loser, double-digit average gains for shorts, and a Sharpe ratio of 1.61 across the decade. History does not guarantee a repeat, but this is one of the cleaner bearish seasonal stretches on the corn calendar.
Why does Corn (CME) (ZC) follow this seasonal pattern?
This pattern may reflect classic crop-year dynamics, as mid-summer brings clearer visibility on U.S. acreage, yield potential, and global supply, which often shifts the market from weather risk premiums toward more comfortable stock estimates. Analysts have pointed to large projected plantings and higher ending stocks as reasons why rallies into this period can fade as supply confidence builds.[1] The July–August window also sits ahead of harvest, when logistics and storage plans firm up and hedging flows from producers can lean against prices.
History does not guarantee future results, and adverse excursions within the window can be large even in years that ultimately finish as winners for the seasonal pattern.
What is driving Corn (CME) (ZC) today?
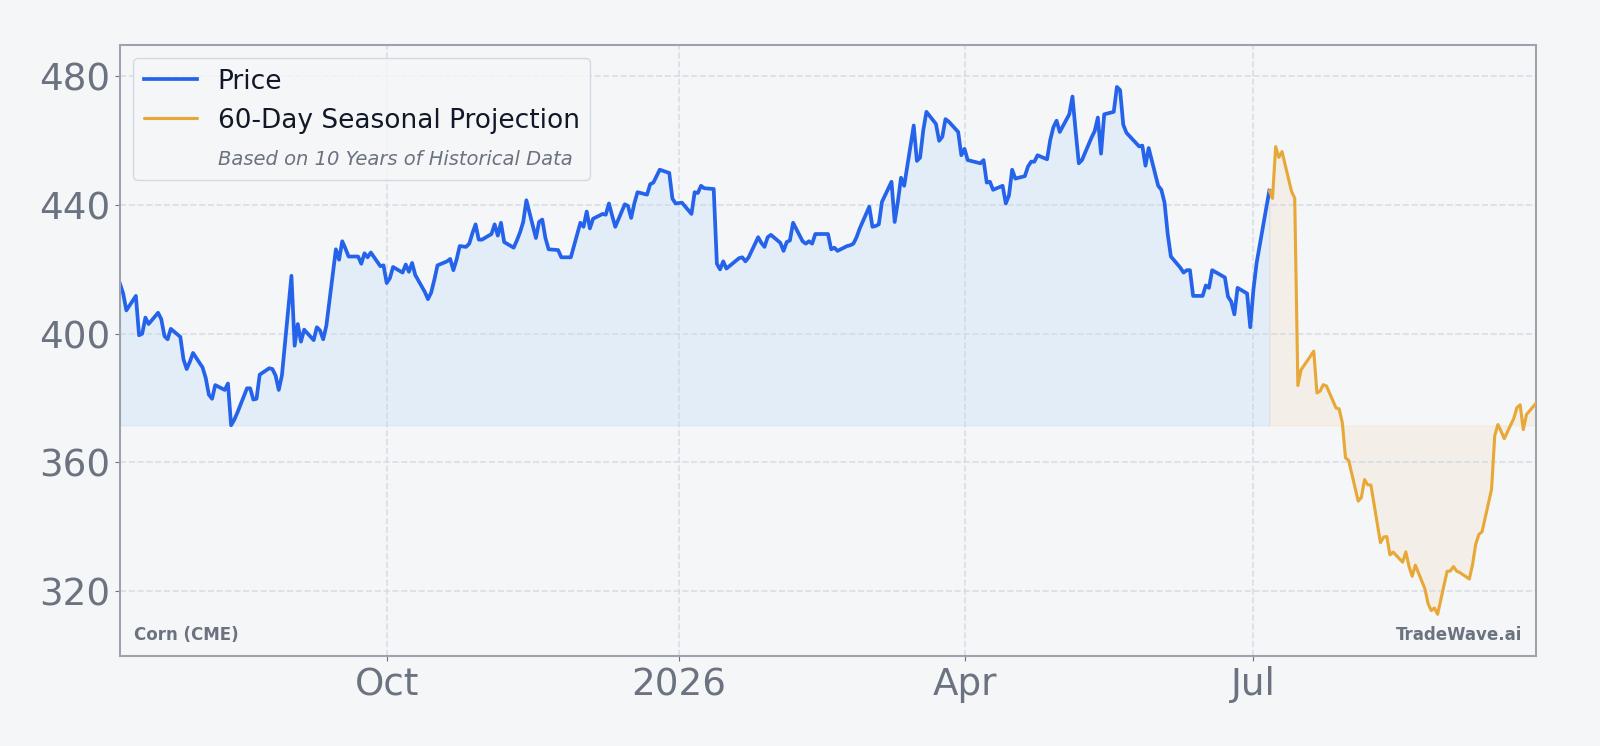
Corn (CME) front-month futures closed at 440.75 cents per bushel in the prior session, up 19.75 cents or 4.7% on the day, leaving the contract about 8.5% below its 52-week high of 481.75 and roughly 19.5% above the 52-week low of 368.75. The bounce comes after months of supply-heavy headlines, including a January USDA report that lifted U.S. ending stocks to 2.23 billion bushels and pressured prices, and a February analyst survey that projected 2026 U.S. corn plantings near 94.9 million acres, reinforcing expectations for ample supply.[1][2]
In April, improved U.S. weather and strong weekly export sales of roughly 1.598 million metric tons of old-crop corn helped ease some near-term demand worries, but the broader backdrop still tilts toward comfortable inventories rather than scarcity.[4] That combination of better export flow and big acreage plans has kept volatility elevated as traders toggle between weather scares and the reality of large potential crops.
The chart below situates the latest move in its recent multi-month context and overlays the upcoming seasonal window.
How do supply, demand, and logistics shape this seasonal window?
On the supply side, the January WASDE’s higher ending stocks and the expectation of nearly 95 million acres planted in 2026 point to a market that is more worried about managing surplus than rationing scarcity.[1][2] Weekly USDA data showing net export sales of about 1.598 million metric tons of old-crop corn in late April confirms that demand is present, but not yet strong enough to erase the cushion implied by those stock numbers.[1]
Logistically, this July–August stretch often coincides with key decisions on storage, forward sales, and hedging as farmers and elevators look ahead to harvest. When stocks are high and acreage is large, those hedging flows can lean into rallies, adding selling pressure that aligns with the historical short-side seasonal pattern. Weather remains a wild card, but improved planting progress and drier near-term forecasts reported in late April suggested fewer immediate threats to yield for this crop year.[4]
What should traders watch as this window opens?
For this year’s iteration of the July–August window, the first watchpoint is how corn behaves around the 440 to 450 band where it just bounced, relative to the 52-week high near 482. Sustained failure to break meaningfully above that resistance as the window opens would be consistent with the historical pattern of rallies fading into mid-summer, while a decisive push through and hold above the high would mark a clear departure from the past decade’s behavior.
Macro-wise, upcoming USDA supply updates and weekly export sales reports will be critical for gauging whether the market continues to lean on the “big crop, big stocks” narrative that has dominated since January.[1][2][4] Traders should track any shift in export momentum or weather-driven yield risk that could tighten the balance sheet and blunt the usual seasonal downside. Add it up: price action around key chart levels, the tone of supply-and-demand data, and how quickly any rallies attract hedging pressure will tell you whether this 9-for-10 short-side window keeps its streak intact or finally breaks.
Sources
About this seasonal analysis
Seasonal pattern data is sourced from TradeWave.ai, which analyzes historical price behavior across annual calendar windows going back up to 30 years. Read the full data methodology or the book The 100-Year Pattern by Afshin Moshrefi (2026 edition). Past performance of seasonal patterns does not guarantee future results. This article is for informational purposes only and does not constitute investment advice.