Seven-of-Eight Midterm Slide: Crude Oil (CL) Shorts Averaged 14.65% in This 115-Day Window
Crude Oil is hovering near $80 as traders head toward a 115-day midterm-election-year seasonal window that has historically favored downside moves and sharp swings.
Price as of Jul 15, 2026: $80.37 (intraday).

What is the seasonal pattern for Crude Oil (CL)?
Crude Oil has fallen in 7 of 8 midterm-election-year windows starting around Jul 31, with an average 14.65% gain in winning years for short positions.
- 7 wins and 1 loss for shorts in this window, with winning years averaging 14.65% moves in the trade direction.
- The upcoming Crude Oil trading window starts on Jul 31 and runs for 115 days across the last 8 midterm election years.
- Percent Profitable is 88%, with 7 winners and 1 loser for the short-side seasonal pattern.
- Avg Profit - All, which includes both winners and losers, is 13%, reflecting only one modestly losing year.
- The worst year in the sample still saw only a small 0.49% average loss for shorts, while several years posted declines of more than 20% in crude prices.
- Intraperiod swings have been large, with historical best and worst excursions showing that even winning short windows can experience sharp rallies before rolling over.
According to historical data from TradeWave.ai, this midterm-election-year stretch has behaved very differently from an average quarter for crude. The next section walks through how that pattern has played out in prior cycles and what it means for the upcoming Jul 31 window.
How has Crude Oil (CL) traded in this midterm-year seasonal window?
In the last eight midterm election years, this 115-day window starting around Jul 31 has favored shorts in Crude Oil, with prices falling in 7 of 8 cycles and a cumulative return of 155% for the strategy. Today CL futures settled at $80.35 per barrel, up 0.7% on the day and sitting about 32.8% below the 52-week high of $119.48, leaving plenty of room on the chart if another late-year downdraft develops.
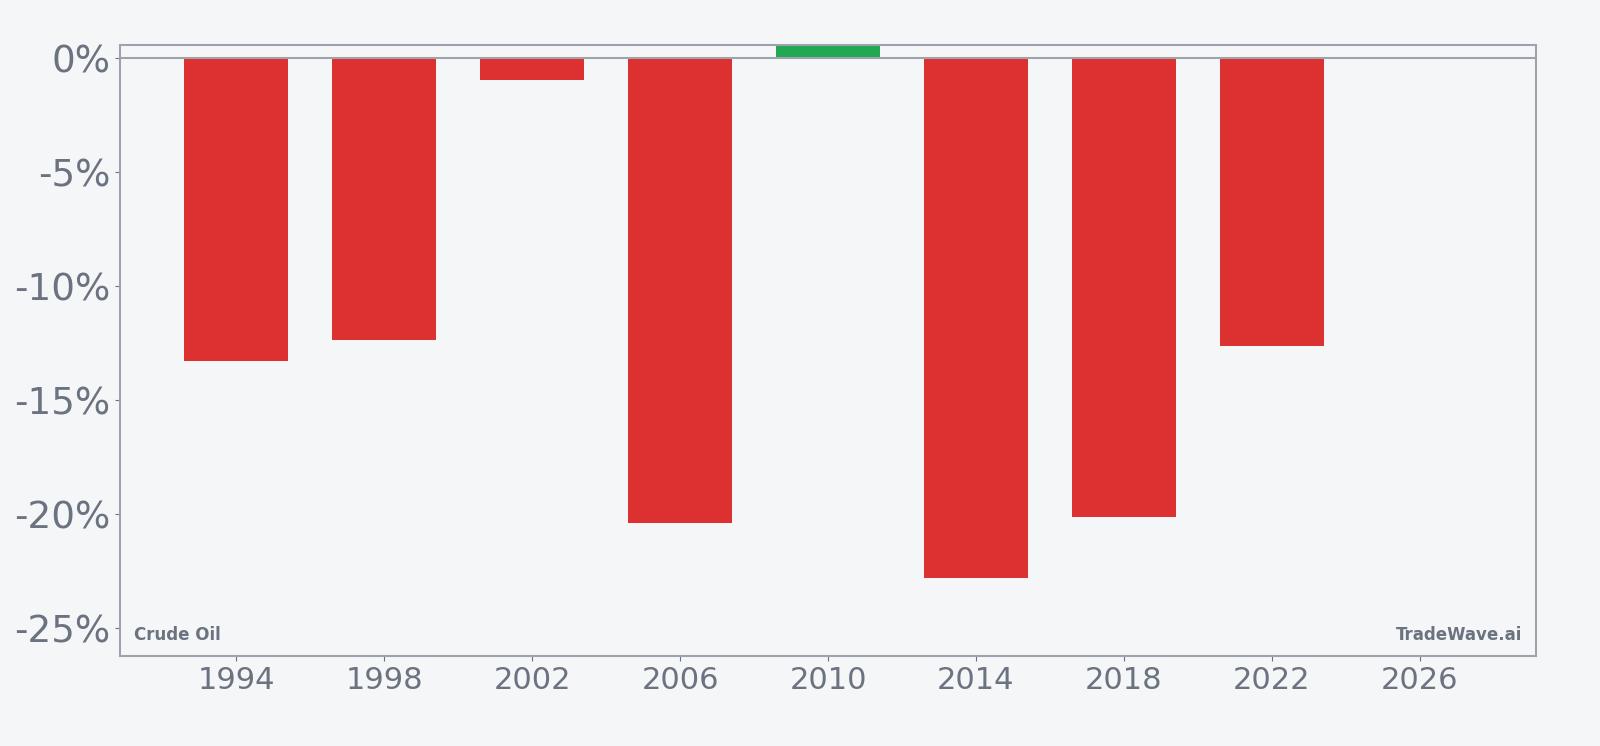
Grouping the data by the presidential election cycle matters here because this window sits in the heart of the midterm election year, a phase that often brings policy uncertainty, shifting expectations for future regulation and, for energy, noisy headlines around supply security and price caps. The pattern phase in this study is “the last 8 midterm election years,” and the calendar phase today is also a midterm election year, so the upcoming Jul 31 window lines up directly with those historical analogs.
Across those eight midterm-year samples, the short-side seasonal strategy shows an Annualized Return of 12.46% and a Sharpe ratio of 1.32, which is unusually strong for a directional commodity pattern. Percent Profitable sits at 88%, with 7 winners and just 1 loser, and the Avg Profit - All of 13% is only slightly below the 14.65% average for winning years, a sign that the lone losing year was relatively mild.
The per-year table shows how this has played out in real cycles. In 2014, a short entered around $98.17 and exited near $75.78, a net move of -22.81% in crude prices as the market rolled over into a deep bear phase. In 2006, the pattern captured a -20.38% decline from $74.40 to $59.24, while 2018 delivered a -20.12% slide from $67.63 to $54.02. Even the weakest outcome for shorts, in 2010, was a small 0.49% loss as crude edged from $81.34 to $81.74 by the end of the window.
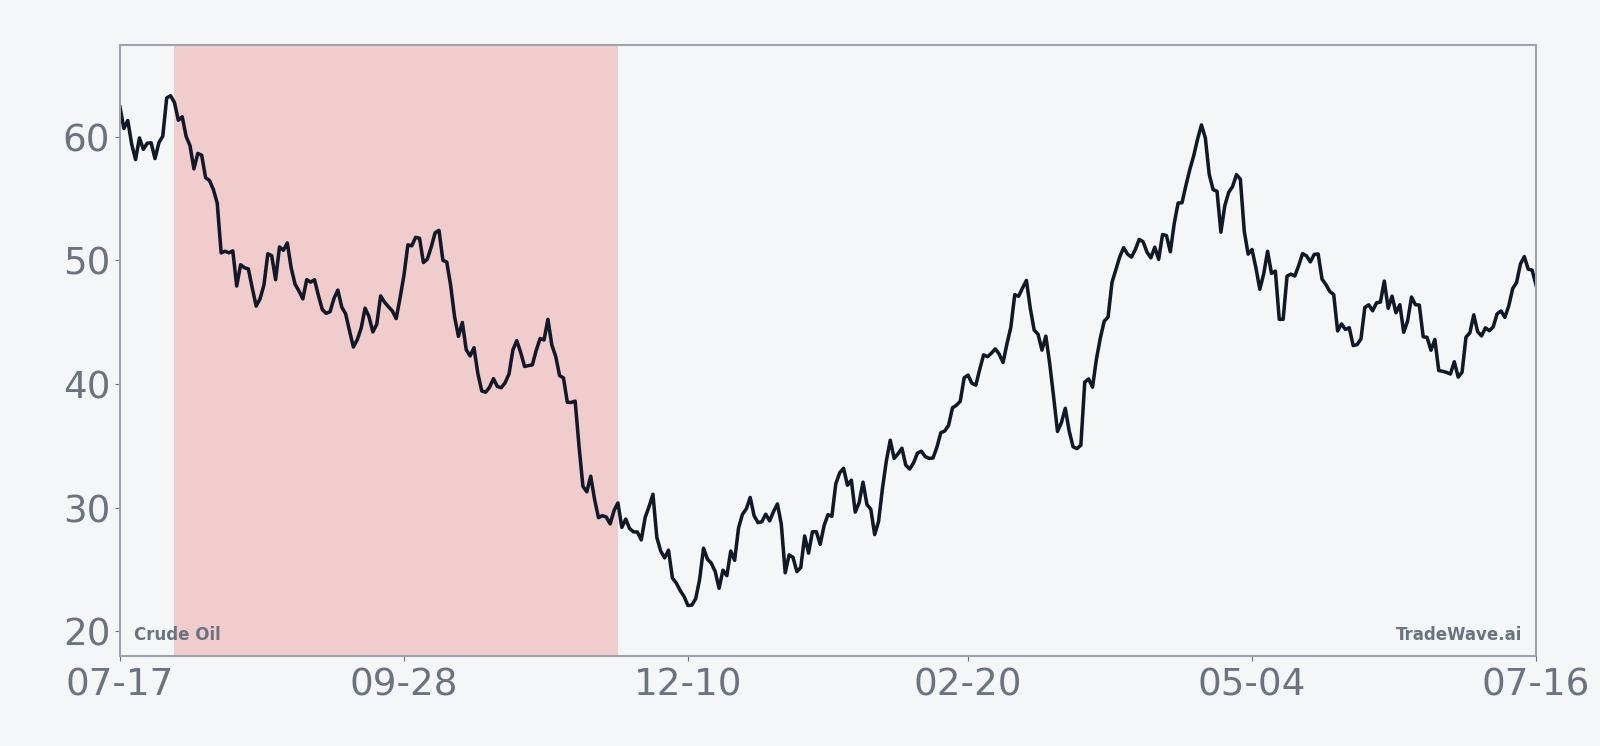
The historical seasonal trend chart shows that, on average, crude tends to hold up early in the window before weakness accelerates later in the period. The typical path slopes gradually lower, with the bulk of the short-side gains accruing in the back half of the 115 days, which lines up with prior episodes where macro or policy shocks hit after summer.
Year-by-year bars with maximum favorable and adverse moves show how deep both rallies and selloffs have run inside this window.
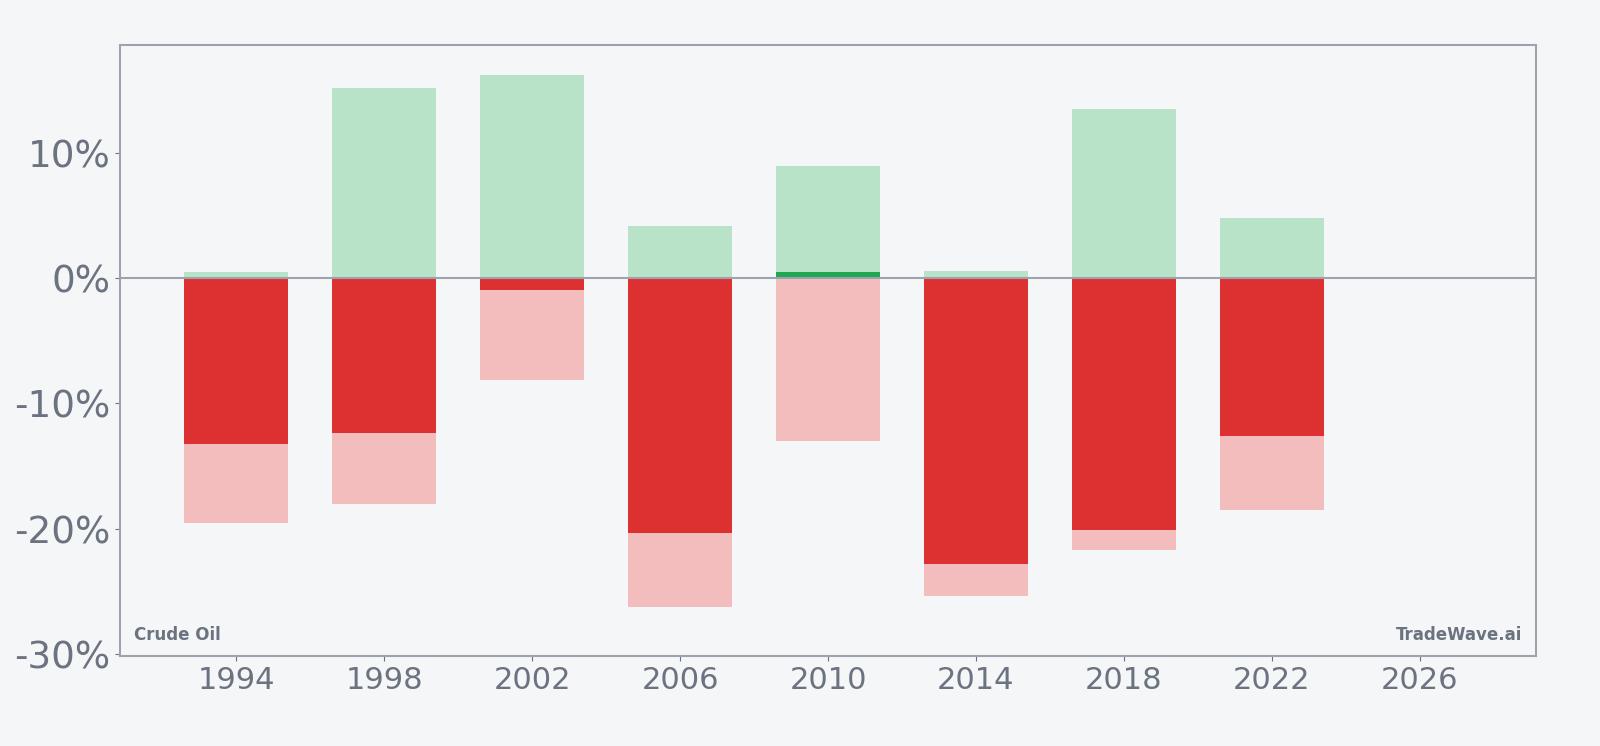
The bars with maximum favorable and adverse excursions underline how volatile this Crude Oil trading window has been. In 1998, for example, the net return for shorts was -12.39% as crude fell from $14.21 to $12.45, but the maximum favorable move reached 15.13% at one point, while the worst drawdown against the trade was -18.02%, showing that rallies and reversals can be violent even in winning years. In 2006 and 2014, maximum adverse excursions of -26.26% and -25.38% respectively highlight how far crude has sometimes squeezed higher before ultimately breaking lower in line with the short-side seasonal bias.
History does not guarantee future results; adverse excursions (MAE) can be large even in winning windows.
Why does Crude Oil (CL) follow this seasonal pattern?
This midterm-year seasonal pattern for crude likely reflects a mix of commodity supply-demand seasonality and the policy calendar. One likely driver is that late summer into autumn often brings clarity on OPEC production plans, hurricane-season disruptions and government responses to gasoline prices, which can all shift expectations for future supply. Analysts have also pointed to midterm-year political noise around sanctions, strategic reserve policy and regulation, which can amplify volatility and, in several of these cycles, coincided with demand scares that pushed prices lower into year-end.
What is driving Crude Oil (CL) today?
Crude Oil futures finished the prior session at $80.35 per barrel, up 0.52 on the day, a 0.7% gain that leaves CL about 32.8% below its 52-week high of $119.48 and well above the 52-week low of $54.98. The contract has slipped roughly 3.41% over the past month, and at current levels it is trading under its 50-day simple moving average of $85.85 on relatively light volume compared with the 20-day average of about 215,000 contracts, a sign that the latest consolidation has come with less participation than the earlier spike.
Macro drivers remain firmly in the foreground. In March 2026, research from a major bank warned that a prolonged closure of the Strait of Hormuz could push crude above $200 per barrel and raise recession risks if flows were not restored quickly, underscoring how sensitive the market is to Middle East chokepoints.[1] Later that month, weekend trading saw WTI futures trade above $102 per barrel after a Friday close near $99.64, reflecting how geopolitical tension can trigger sharp gaps in thin liquidity.[3] Earlier in March 2026, crude dropped about 2% in post-market trading after officials signaled imminent action to reduce price pressure, highlighting the counterweight of potential policy intervention when prices run too hot.[4]
Sector commentary has also stressed the underlying supply-demand backdrop. In January 2026, analysts noted that a supply glut was offsetting Gulf tensions, with concerns about a lingering overhang capping prices in the absence of a clear demand revival.[5] That mix of geopolitical risk on one side and supply overhang on the other helps explain why crude has struggled to hold triple-digit prices for long stretches, even when headlines have been supportive.
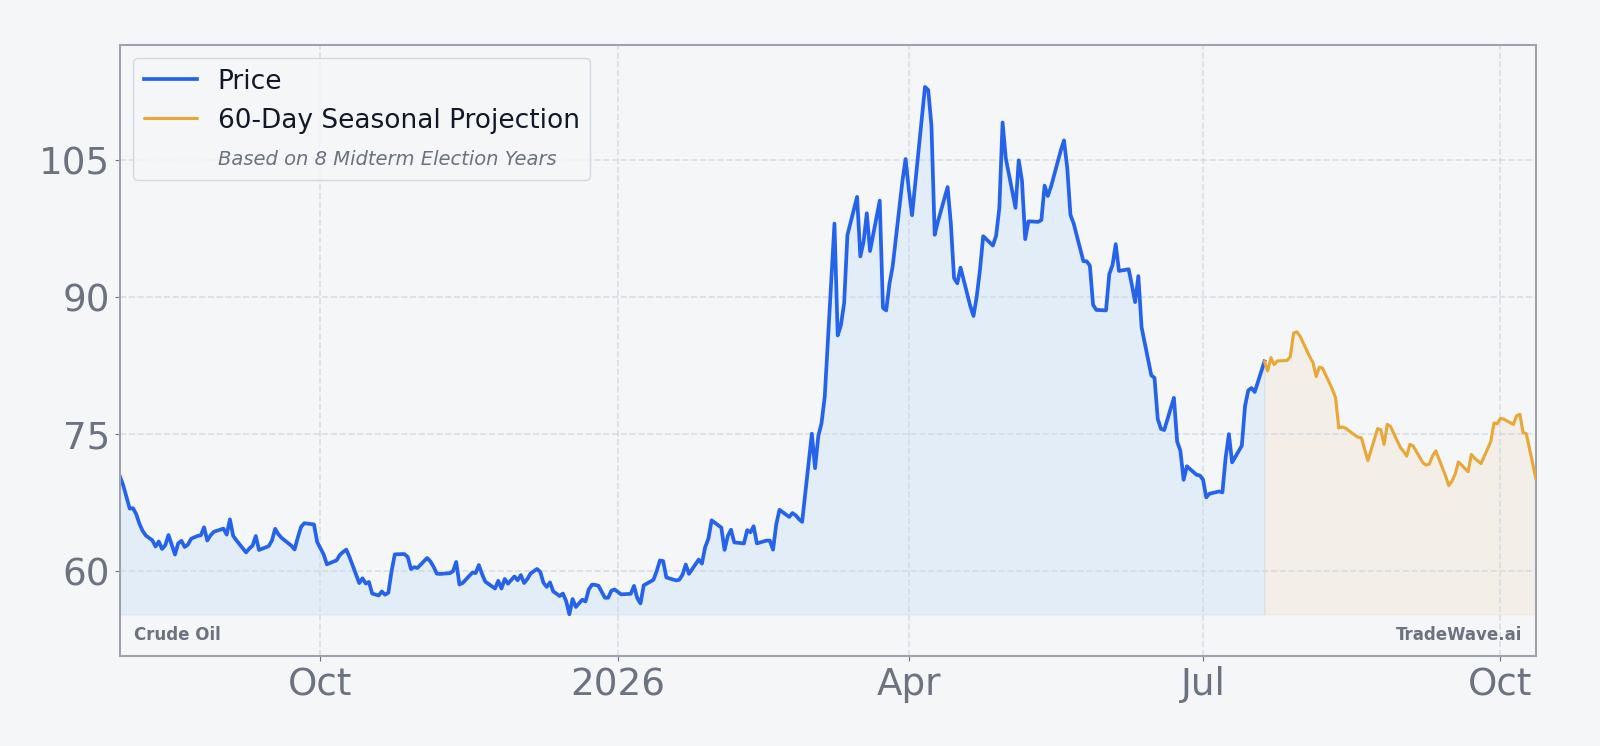
The chart below situates the latest move in its recent multi-month context and overlays a short-term seasonal projection.
What should traders watch as the Jul 31 window approaches?
For this specific midterm-year seasonal window, the first checkpoint is the calendar itself. The pattern does not begin until Jul 31, so price action in the second half of July will set the starting point: a rally back toward the 50-day moving average would give shorts more room to work with, while a slide toward the 52-week low would compress the downside cushion. Inside the window, behavior that tracks the historical template would likely feature choppy trading early on, followed by more decisive weakness later in the 115-day stretch, especially if macro data or policy headlines turn growth-sensitive.
Macro catalysts to watch include any renewed disruption risk around the Strait of Hormuz, fresh commentary on sanctions or strategic reserve policy, and signs that demand is either reaccelerating or stalling into year-end.[1][5] Traders will also be watching whether volume picks up from the current subdued levels as the window opens; a build in participation alongside downside price action would rhyme with prior strong short years, while a low-volume drift could signal a more muted iteration of the pattern. Finally, if crude were to squeeze sharply higher inside the window, the historical MAE profile shows that such rallies have occurred before even in winning short years, so the key tell will be whether those spikes fade and roll over or hold and break the pattern.
Sources
- Seeking Alpha: Trump eyes Iran oil seizure, Kharg Island takeover amid Kuwait attacks and rising crude - report (Mar 30, 2026)
- Seeking Alpha: Crude oil turns lower as Trump officials signal imminent action to reduce price pressure (Mar 6, 2026)
- The Wall Street Journal: Oil Steady as Supply Glut Offsets Gulf Tensions (Jan 2, 2026)
About this seasonal analysis
Seasonal pattern data is sourced from TradeWave.ai, which analyzes historical price behavior across annual calendar windows going back up to 30 years. Read the full data methodology or the book The 100-Year Pattern by Afshin Moshrefi (2026 edition). Past performance of seasonal patterns does not guarantee future results. This article is for informational purposes only and does not constitute investment advice.