Lean Hogs (HE) Has Dropped in 10 of 10 Late-July Windows, Shorts Averaged 16.82%
Lean Hogs futures sit near the top of their 12-month range just as a historically bearish late-July seasonal window for prices approaches, raising the stakes for hog producers and spread traders.
Price as of Jul 14, 2026: $95.25 (last close).
What is the seasonal pattern for Lean Hogs (HE)?
Lean Hogs has fallen in 10 of 10 years during this late-July 24-day window, with an average gain of 16.82% for short positions in winning years.
Key seasonal stats for the upcoming window
- 10 for 10 in this window for short trades, with an average profit of 16.82% in winning years.
- Seasonal window runs from Jul 25 for 24 trading days and has been consistently bearish for Lean Hogs prices.
- Percent Profitable is 100%, with 10 winners and 0 losers across the past decade of this pattern.
- Annualized return for the short setup is 16.66%, with a Sharpe ratio of 2.61 over the 10-year sample.
- TradeWave Ratio of 4.21 signals that price has typically traveled meaningfully in the trade direction within the window.
- Even in winning years, adverse moves inside the window have reached double digits, underscoring the need to respect intraperiod volatility.
According to historical data from TradeWave.ai, this late-July stretch in Lean Hogs has behaved very differently from an average month on the calendar. The next section walks through what that pattern has looked like and how sharp the swings have been inside the window.
How has Lean Hogs (HE) traded in the late-July seasonal window?
Lean Hogs has delivered profits for short positions in every single late-July 24-day window over the past decade, averaging 16.82% gains for those shorts. The next iteration of that window begins on Jul 25, with futures recently settling at 95.25 cents per pound, near the upper end of the past year’s 77.35 to 110.025 range. That combination of elevated prices and a historically weak seasonal stretch for hogs puts a bright spotlight on how packers, producers and macro traders manage risk into late summer.
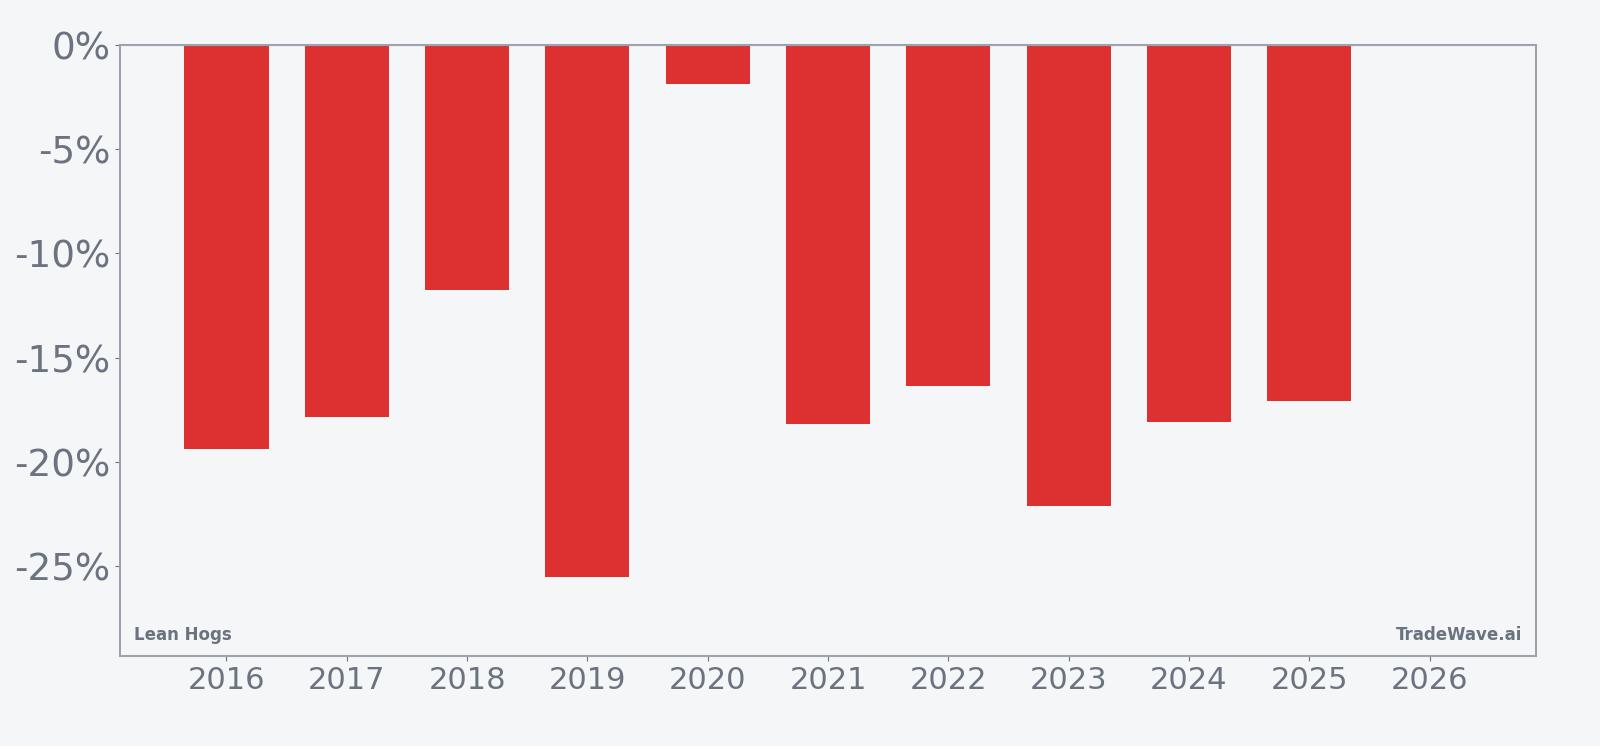
Across the 10-year sample, the short pattern has been remarkably consistent. Net returns for the window range from a modest 1.89% gain for shorts in 2020 to a 25.5% gain in 2019, with most years clustering in the mid- to high-teens. Every year in the sample delivered a negative close-to-close move for Lean Hogs prices during the window, which is why the Percent Profitable metric sits at 100% with 10 winners and 0 losers for the short side.
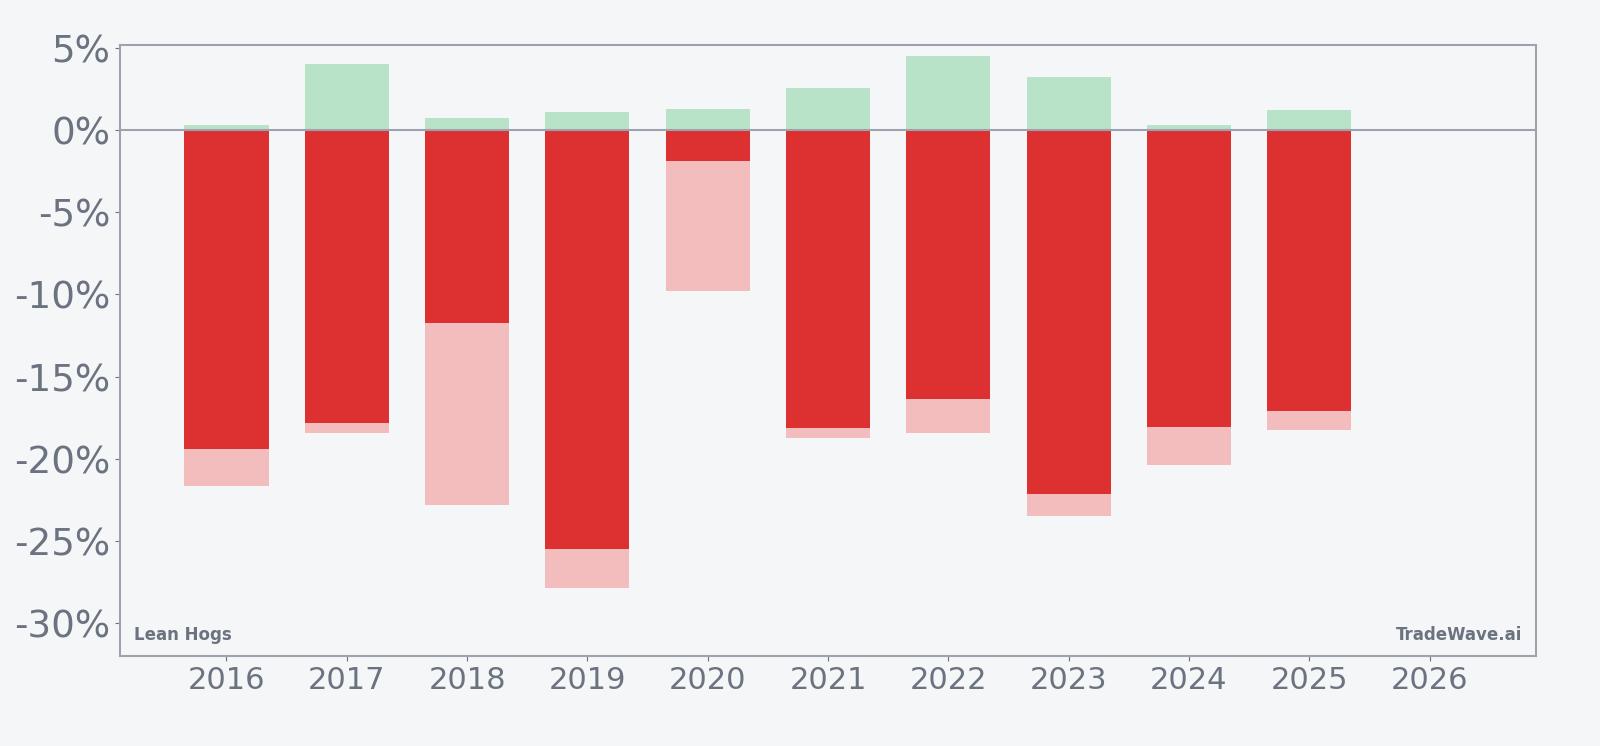
The per-year path data shows that the window has not been a straight line lower for prices. Maximum favorable moves for shorts have typically been in the low single digits, while maximum adverse moves have often stretched into the high teens or low 20s in percentage terms. In 2018, for example, the best point-to-peak move for shorts was only 0.72%, but the worst drawdown from entry reached 22.82% before prices ultimately finished the window lower. That profile speaks to a trade that has historically paid off by the end of the period but has demanded a strong stomach for intraperiod volatility.
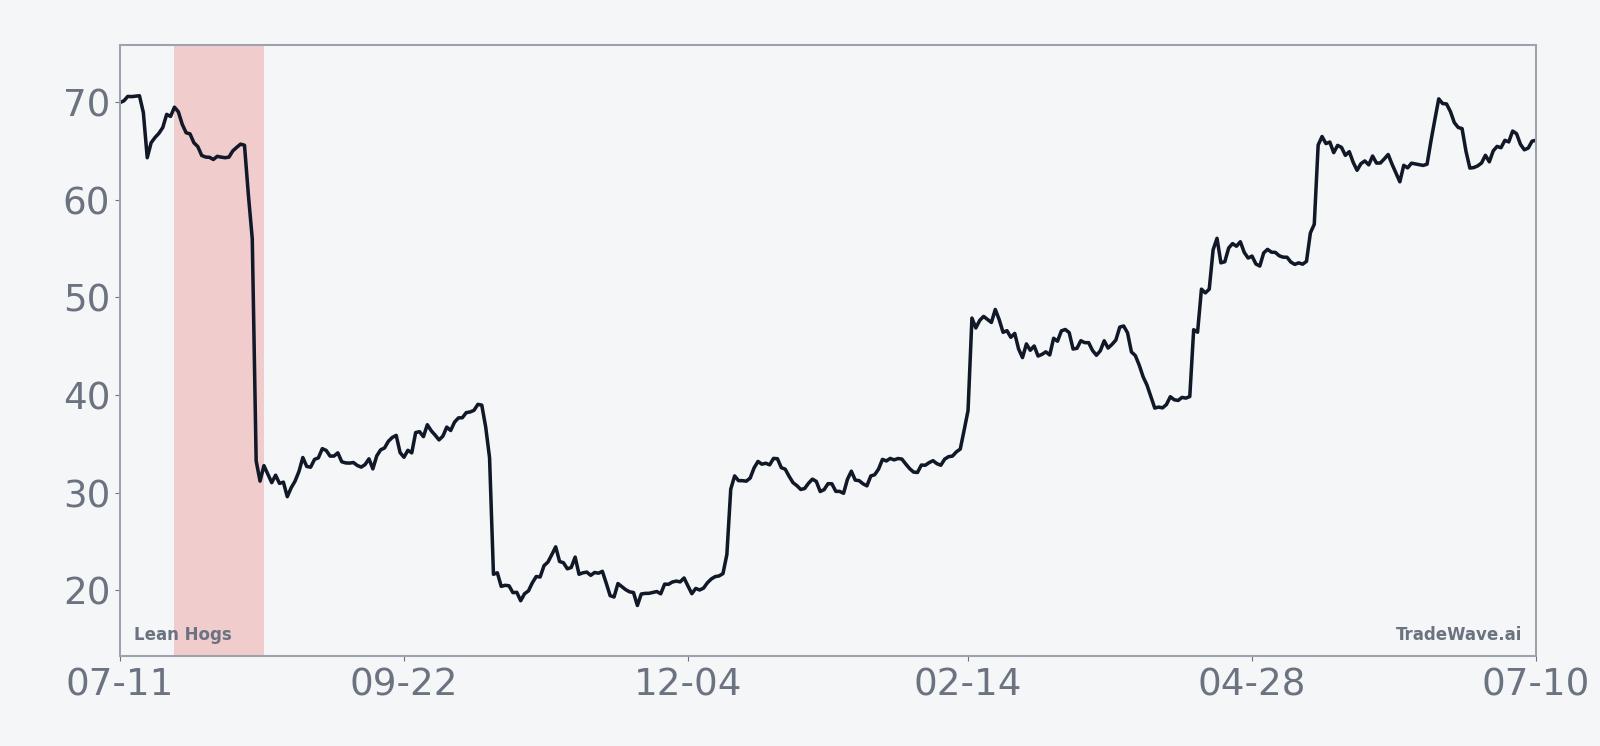
Year-by-year bars with maximum favorable and adverse moves fill in the risk and reward profile behind that smooth average line.
The cumulative return chart for the pattern, which stacks each year’s outcome, shows a steady downward staircase for prices across the decade. There are no flat stretches where the pattern “took a break” for several years. Instead, the short side has added up to a 366% cumulative gain across the 10 windows, with an annualized return of 16.66% and a Sharpe ratio of 2.61 that stands out for a commodity contract known for its volatility.
History does not guarantee future results, and the worst intraperiod drawdowns in this window have been large even in years that ultimately finished as winners for the short side.
Why does Lean Hogs (HE) follow this seasonal pattern?
For Lean Hogs, one likely driver of this late-July seasonal pattern is the supply and demand rhythm around summer slaughter and pork demand. Analysts often point to heavier hog marketings and seasonally softer domestic consumption after the early-summer grilling peak as factors that can pressure prices into late July and August. This pattern may also reflect how packers and producers hedge more aggressively once summer demand is largely priced in, adding selling pressure during this specific stretch of the calendar.
What is driving Lean Hogs (HE) today?
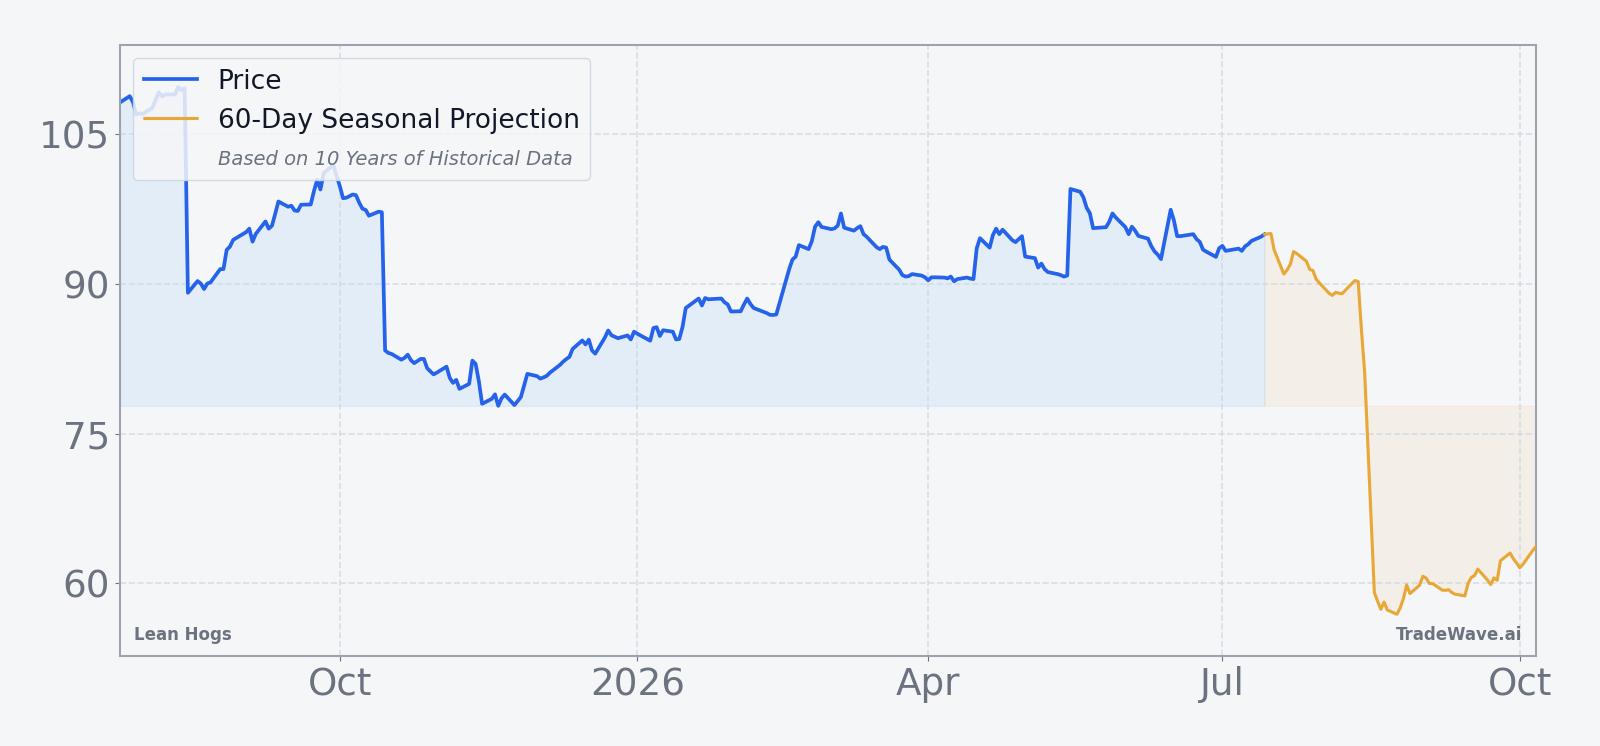
Lean Hogs futures most recently settled at 95.25 cents per pound, with the front-month contract trading in a relatively tight intraday band between 94.875 and 95.25 on Jul 14. That level leaves the market below its 52-week high of 110.025 and above the 52-week low of 77.35, with prices hovering just over the 50-day moving average of 94.24 and on lighter-than-normal volume compared with the 20-day average of 8,481 contracts. In plain terms, hogs are neither at panic lows nor blow-off highs, but they are elevated enough that any seasonal or fundamental shift could matter quickly for margin-sensitive producers and packers.
The chart below situates the latest move in its recent multi-month context, alongside a 60-day seasonal projection.
Macro drivers around yields, the dollar and inflation expectations remain central for livestock markets, but the current Lean Hogs setup is more about micro supply and demand than a single headline. With no major fresh macro or sector-specific catalysts flagged in the latest research, traders are watching the usual summer mix of slaughter weights, carcass yields, export flows and retail pork pricing to gauge whether the market has already priced in peak seasonal demand. The fact that volume is running below its recent 20-day average suggests many participants are waiting for that late-July window to open before committing to larger directional bets.
What should traders watch as the late-July Lean Hogs window opens?
For this specific 24-day window, the first thing to watch is how Lean Hogs behaves as Jul 25 approaches. If prices remain near the upper half of the 77.35 to 110.025 range, the historical pattern has often seen meaningful downside for prices during the window, which has been favorable for short positions. A break below the 50-day moving average with expanding volume would fit that historical script, while a sustained push back toward the 52-week high on strong buying would mark a clear departure from the typical late-July seasonal trend.
Second, keep an eye on slaughter and inventory data as a real-time check on the seasonal story. Heavier-than-expected hog supplies or signs of softer domestic pork demand would align with the historical pattern of price weakness in this window, while tighter supplies or strong export bookings could blunt or even overwhelm the usual seasonal pressure. Because the historical maximum adverse excursions inside the window have been large, traders who lean on the pattern will want to monitor intraday volatility closely rather than assuming a smooth glide path lower for prices.
Finally, watch how positioning and hedging behavior evolve as the window progresses. If commercial hedgers and managed money accounts both lean into the short side early in the period, any countertrend rally could be sharp given the contract’s history of double-digit intraperiod swings. On the other hand, if the market drifts lower on modest volume and open interest, that would look more like a textbook replay of the past decade’s late-July Lean Hogs seasonal pattern. Either way, the next 24 trading days after Jul 25 will offer a clean test of whether this 10-for-10 window can extend its streak.
Sources
About this seasonal analysis
Seasonal pattern data is sourced from TradeWave.ai, which analyzes historical price behavior across annual calendar windows going back up to 30 years. Read the full data methodology or the book The 100-Year Pattern by Afshin Moshrefi (2026 edition). Past performance of seasonal patterns does not guarantee future results. This article is for informational purposes only and does not constitute investment advice.