Crude Oil (CL) Has Dropped in 7 of 8 Midterm Windows Starting Jul. 31, Averaging 13% Downside
Crude Oil is hovering near $68 as it heads toward a 115-day midterm-election-year window that has usually favored lower prices and sharp swings.
Price as of Jul 2, 2026: $67.76 (intraday).
What is the seasonal pattern for Crude Oil (CL)?
Crude Oil has fallen in 7 of 8 midterm-election-year windows starting around Jul. 31, with an average 14.65% gain for winning short trades.
- 7 wins and 1 loss for short trades in this window, with winning years averaging 14.65% moves in the trade direction.
- The upcoming Crude Oil trading window starts Jul. 31 and runs 115 days across the last 8 midterm election years.
- Percent Profitable sits at 88%, with 7 winners and just 1 loser across the historical sample.
- Avg Profit - All, which includes both winners and the lone losing year, is still a strong 13% in favor of the short side.
- Maximum adverse moves have reached more than 25% in some years, showing that even successful short windows can see deep rallies first.
- The TradeWave Ratio of 2.91 points to sizable travel in the trade direction inside the window, paired with a Sharpe ratio of 1.32 on end-of-window results.
According to historical data from TradeWave.ai, this midterm-election-year stretch has behaved very differently from an average quarter for crude, with a clear directional bias and large swings inside the window.
How has Crude Oil (CL) traded in this midterm-year seasonal window?
Crude Oil has declined in 7 of the last 8 midterm-election-year windows that begin around Jul. 31 and run for 115 calendar days, making it a historically bearish stretch for prices. Futures settled at $67.78 in the prior session, down 0.5% on the day and sitting well below the 52-week high of $119.48 as the market grinds through a lower range.
Grouping the data by the presidential election cycle matters here because this window captures the midterm election year, a phase when policy uncertainty, shifting fiscal priorities and demand worries have often collided for energy markets. In this pattern, the calendar today sits in the midterm election year, while the window itself stretches from late July into the heart of the year before the presidential election, when risk appetite in other assets has often improved even as crude has tended to soften.
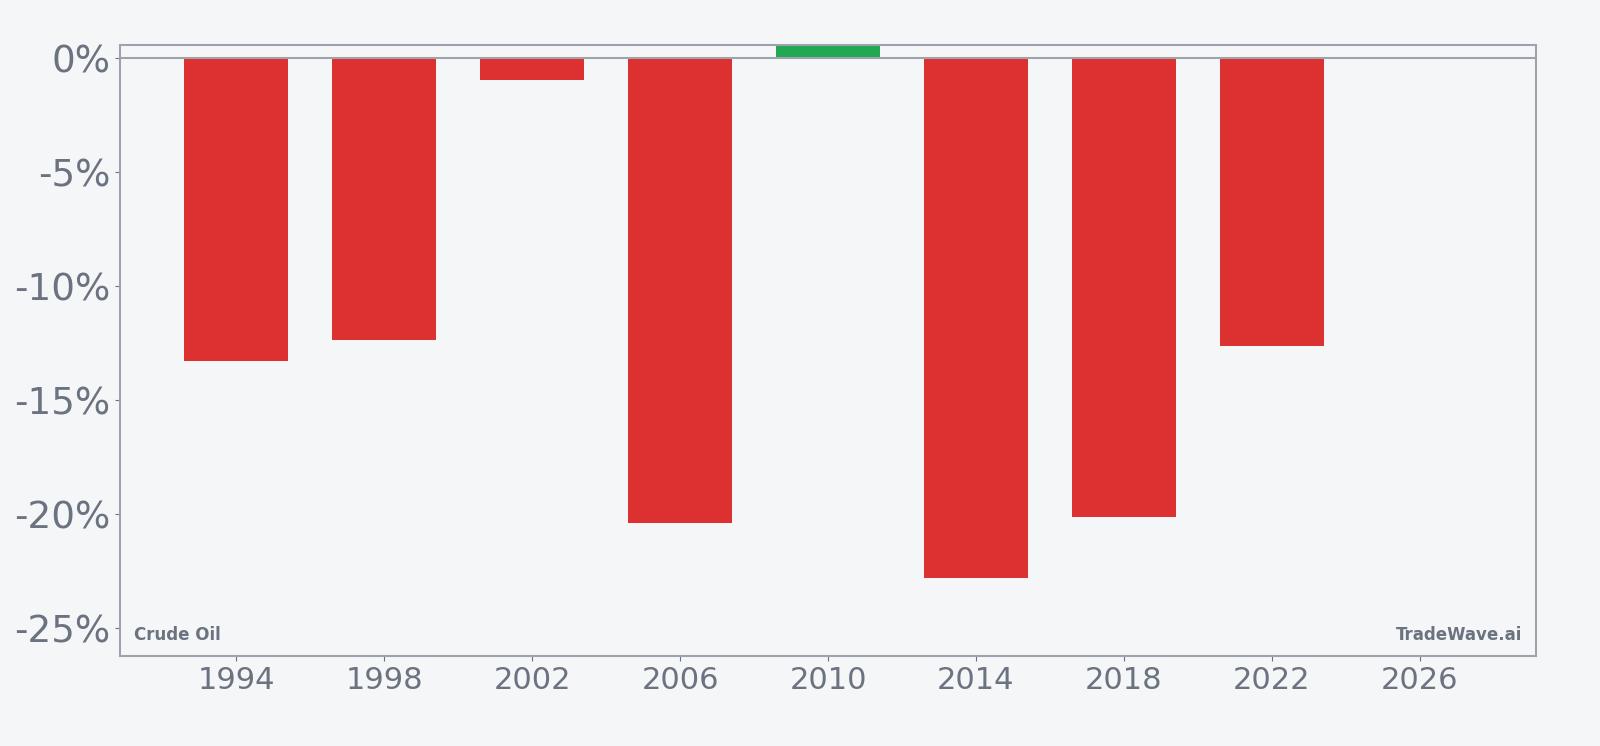
Across the last eight midterm-election-year samples, the short-side seasonal strategy has been profitable 88% of the time, with 7 winners and just 1 losing year. Average profit in winning years is 14.65%, while the all-years average, which includes the lone loss, still comes in at 13% in favor of lower prices by the end of the window. For a short pattern, that means the typical outcome has been a meaningful drift lower in crude over roughly a quarter of trading days.
The per-year table shows how that plays out in practice. In 2014, for example, a short taken at the start of the window would have captured a 22.81% decline by the end, as prices slid from $98.17 to $75.78. The weakest outcome for shorts came in 2010, when crude finished the window up 0.49%, with entry at $81.34 and exit at $81.74, a reminder that even strong seasonal tendencies can produce flat or slightly adverse years.
Intraperiod swings are large. Maximum favorable excursions, the best point-to-peak move in the trade direction, have reached as high as 16.17% in 2002, while maximum adverse excursions, the worst drawdown from entry, have stretched to 26.26% in 2006. That 2006 sample saw crude drop 20.38% by the end of the window, but not before a 4.1% rally against the short first, illustrating how squeezes can precede the larger move lower.
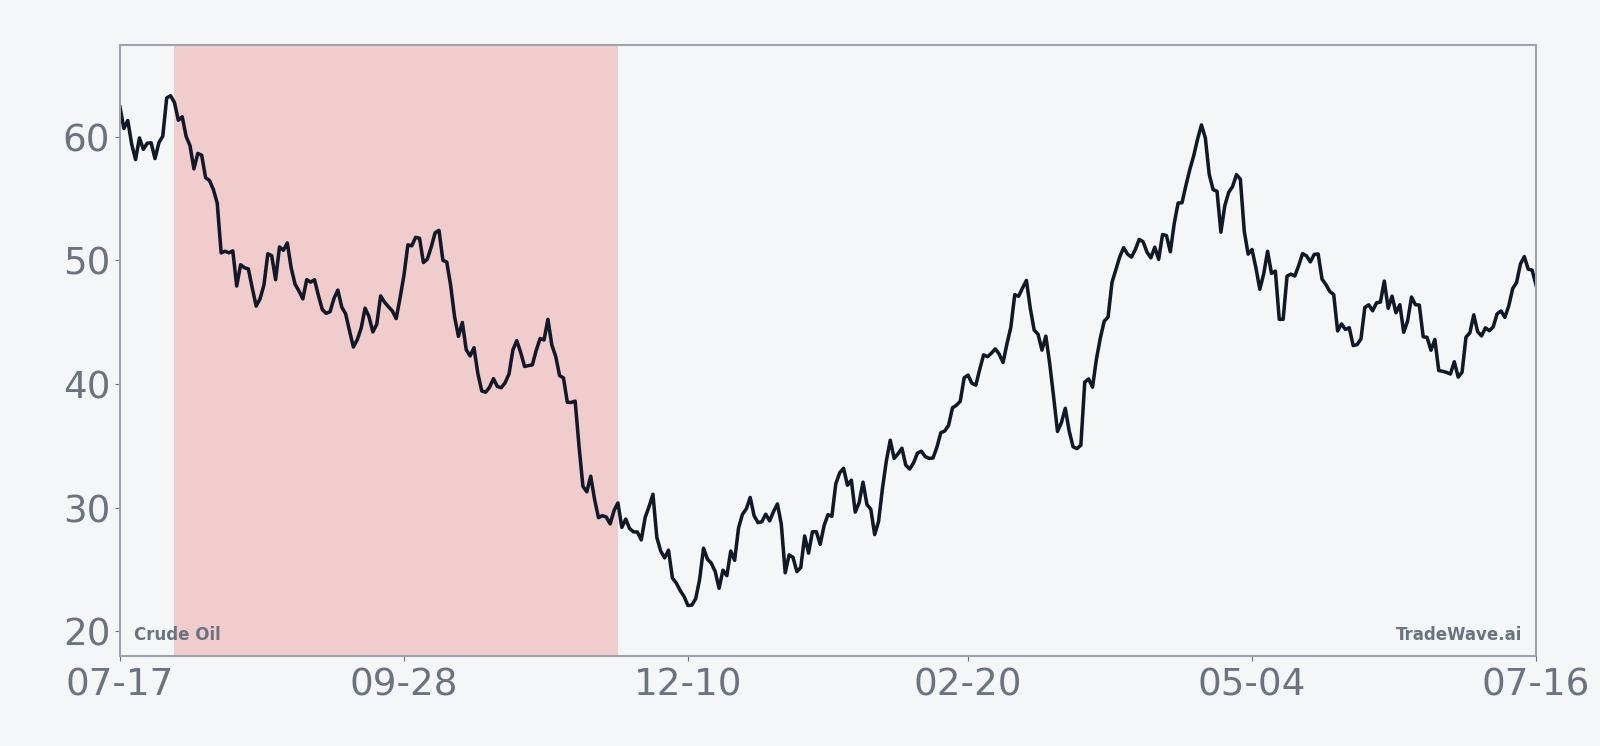
The historical seasonal trend chart for this window shows a fairly consistent downward slope rather than a single crash point. Losses for crude in the stronger short years have tended to build over the life of the 115 days, with some early choppiness followed by a more persistent grind lower into the back half of the window. That profile lines up with the pattern’s 12.46% annualized return and 1.32 Sharpe ratio, which point to a directional edge but not a straight line.
The next chart stacks net results with peak favorable and worst adverse moves to show how far crude has typically swung inside this window.
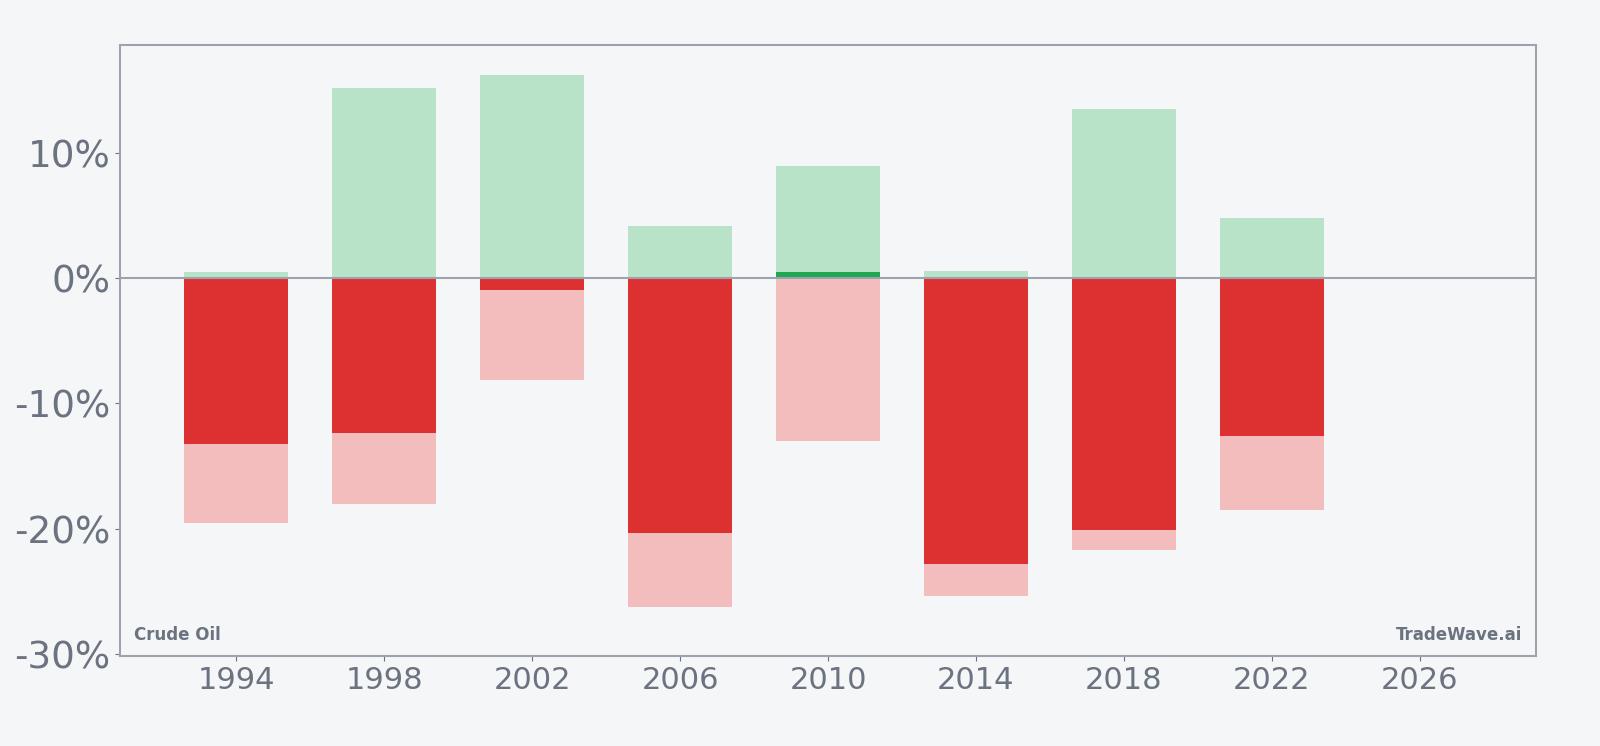
The bars with maximum favorable and adverse excursions underline the trade-off. In strong years like 2014 and 2018, shorts ultimately captured declines of more than 20%, but those same years saw adverse rallies of roughly 25% and 21.72% at some point inside the window. Add it up and you get a pattern where the short side has usually won by the finish, yet the path has often included violent countertrend spikes that would challenge weak hands.
Seven for eight with double-digit average gains in winning short years is a rare record for any commodity window, and it is the single most important takeaway heading into this midterm-year stretch.
Why does Crude Oil (CL) follow this seasonal pattern?
This midterm-year crude pattern may reflect a mix of demand seasonality and policy timing. One likely driver is that late summer into early winter often brings softer demand after the peak driving season, just as governments and central banks reassess growth and inflation, which can weigh on energy expectations. Analysts have also pointed to mid-cycle shifts in fiscal and regulatory policy that can cool risk appetite and leave crude vulnerable to downside repricing when supply is ample.
History does not guarantee future results, and maximum adverse excursions have been large in several years, so even a historically favorable window for shorts can involve sharp rallies and deep drawdowns before the final outcome.
What is driving Crude Oil (CL) today?
Front-month Nymex Crude Oil futures last settled at $67.78, down 0.31 on the day, a 0.5% decline that leaves the contract about 43.3% below its 52-week high of $119.48 and roughly 23.3% above the 52-week low of $54.98. The contract has dropped 24.86% over the past month, slipping well under its 50-day moving average near $91.07 as traders pivot from early-year geopolitical spikes toward a softer demand and supply-heavy backdrop.
In March 2026, weekend trading briefly pushed WTI futures above $102 a barrel, highlighting how quickly geopolitical risk can reprice crude when tensions flare in key shipping lanes.[1] Earlier that month, front-month contracts turned lower after U.S. officials signaled potential action to cool prices, a reminder that policy tools from strategic reserve releases to export waivers can cap rallies when inflation worries resurface.[1] In August 2025, commentary from The Wall Street Journal argued that supply was likely to outpace consumption into 2026, leaving a bias toward range-bound or lower prices absent a clear demand shock, a view that still hangs over the market as inventories remain comfortable.[2]
The chart below situates the latest pullback against the past year’s swings and overlays a short-term seasonal projection.
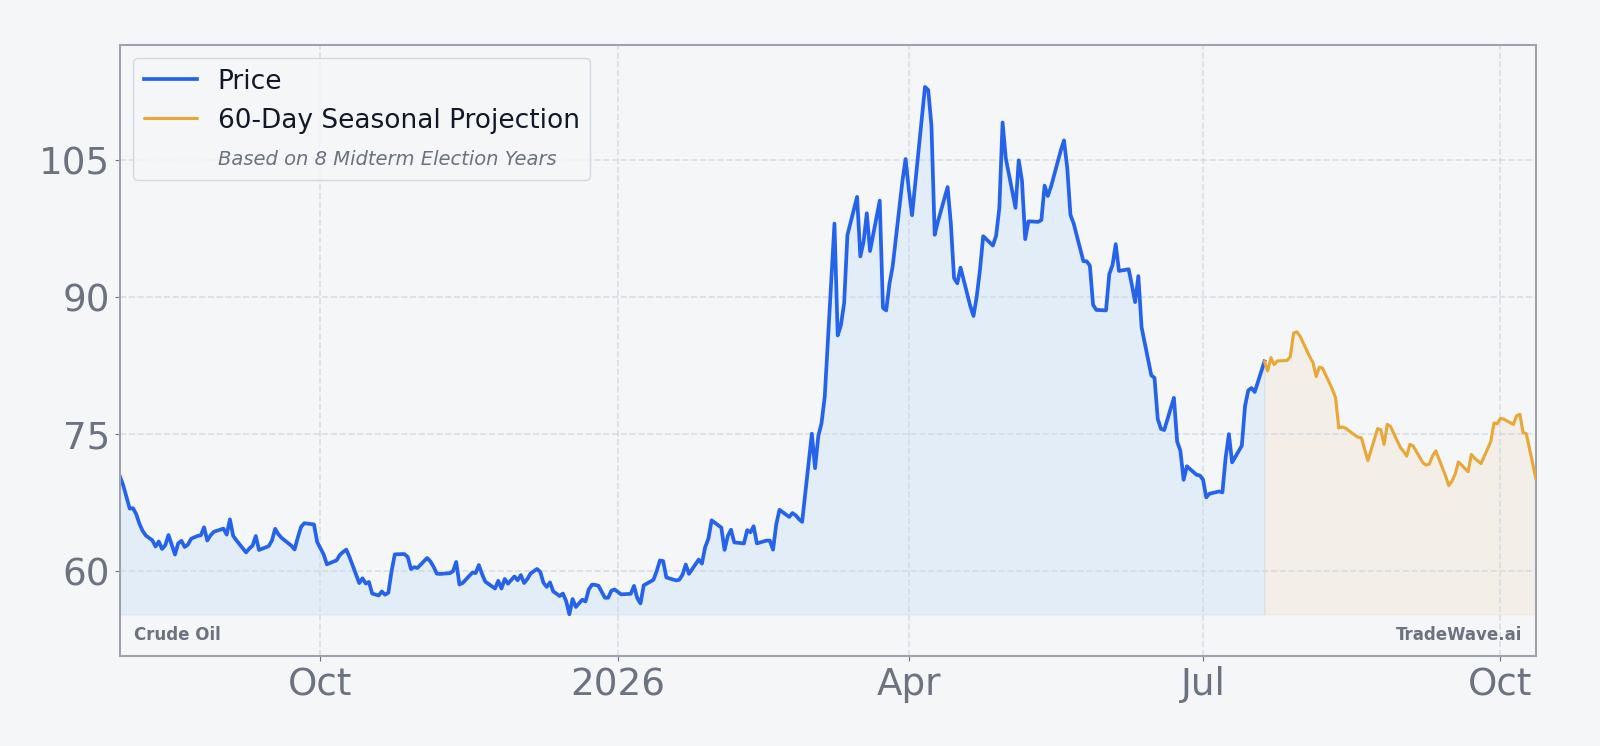
Crude Oil is a key input for inflation expectations, corporate margins and global growth sentiment, so the combination of a sharp one-month slide and an approaching historically bearish seasonal window matters beyond the futures pit. If prices continue to drift lower into late July, the market will be entering a period that has often amplified existing downtrends, with volatility that can spill into energy equities and broader risk assets.
What should traders watch in this upcoming Crude Oil seasonal window?
The first marker is timing. The seasonal window opens on Jul. 31 and runs for 115 calendar days, so positioning and hedging decisions in late July and early August will show how seriously the market is treating the historical pattern. Watch whether rallies toward the low $80s or the 50-day moving average stall quickly, which would echo prior midterm-year windows where countertrend spikes faded before the larger move lower.
Second, keep an eye on macro catalysts that could disrupt or reinforce the pattern. Any renewed escalation in Middle East tensions or credible threat to shipping routes could overwhelm the usual midterm-year softness and produce another upside shock, while confirmation that supply is outpacing demand into 2026 would align with the historical tendency for crude to weaken in this stretch.[2] Inventory data, OPEC+ guidance and signals from major consuming economies on growth and fuel demand will all feed into that tug-of-war.
Finally, behavior inside the window will matter as much as the end result. If crude sees early rallies of 10% to 20% that then reverse into deeper declines, it would rhyme with past years where maximum adverse excursions were large but shorts still finished ahead. If instead prices grind higher and hold those gains, that would mark a clear break from the last eight midterm-election-year samples and signal that the supply-demand balance or policy backdrop has shifted in a more durable way.
Sources
About this seasonal analysis
Seasonal pattern data is sourced from TradeWave.ai, which analyzes historical price behavior across annual calendar windows going back up to 30 years. Read the full data methodology or the book The 100-Year Pattern by Afshin Moshrefi (2026 edition). Past performance of seasonal patterns does not guarantee future results. This article is for informational purposes only and does not constitute investment advice.