7-for-7: Allstate (ALL) Has Gained in Every 81-Day Midterm Window Since 1998
Allstate is heading into an 81-day midterm-election-year seasonal window with a perfect win record, just as shares trade near record highs and volatility picks up.
Price as of Jul 14, 2026: $250.35 (last close).

What is the seasonal pattern for Allstate (ALL)?
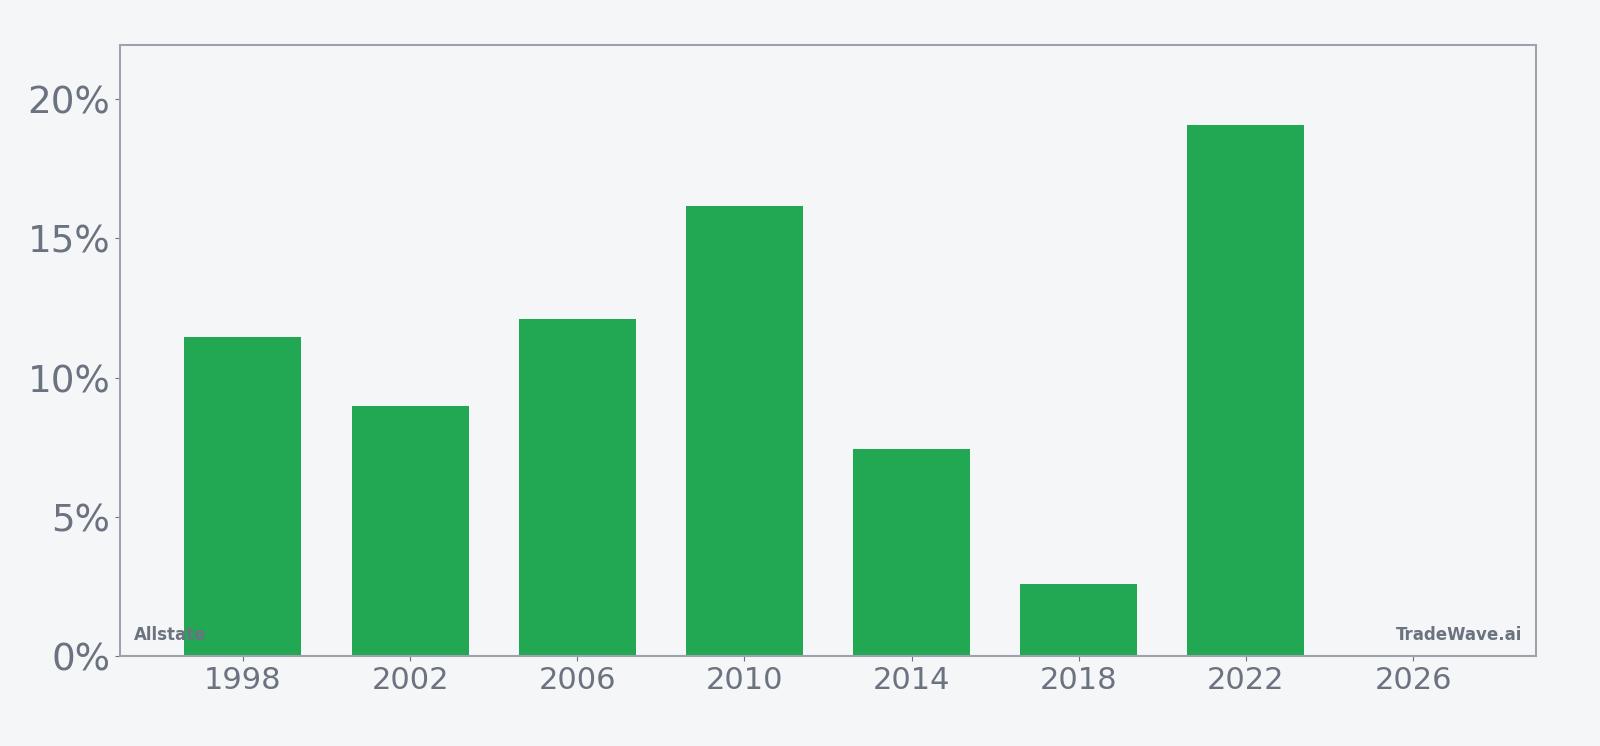
Allstate has risen in 7 of 7 midterm-election-year windows starting around Jul 30, with an average gain of 11.12% in winning years.
- 7 for 7 in this window, with winning years averaging 11.12% gains across an 81-day stretch starting Jul 30.
- Percent Profitable is 100%, with 7 winners and 0 losers across the last seven midterm election years.
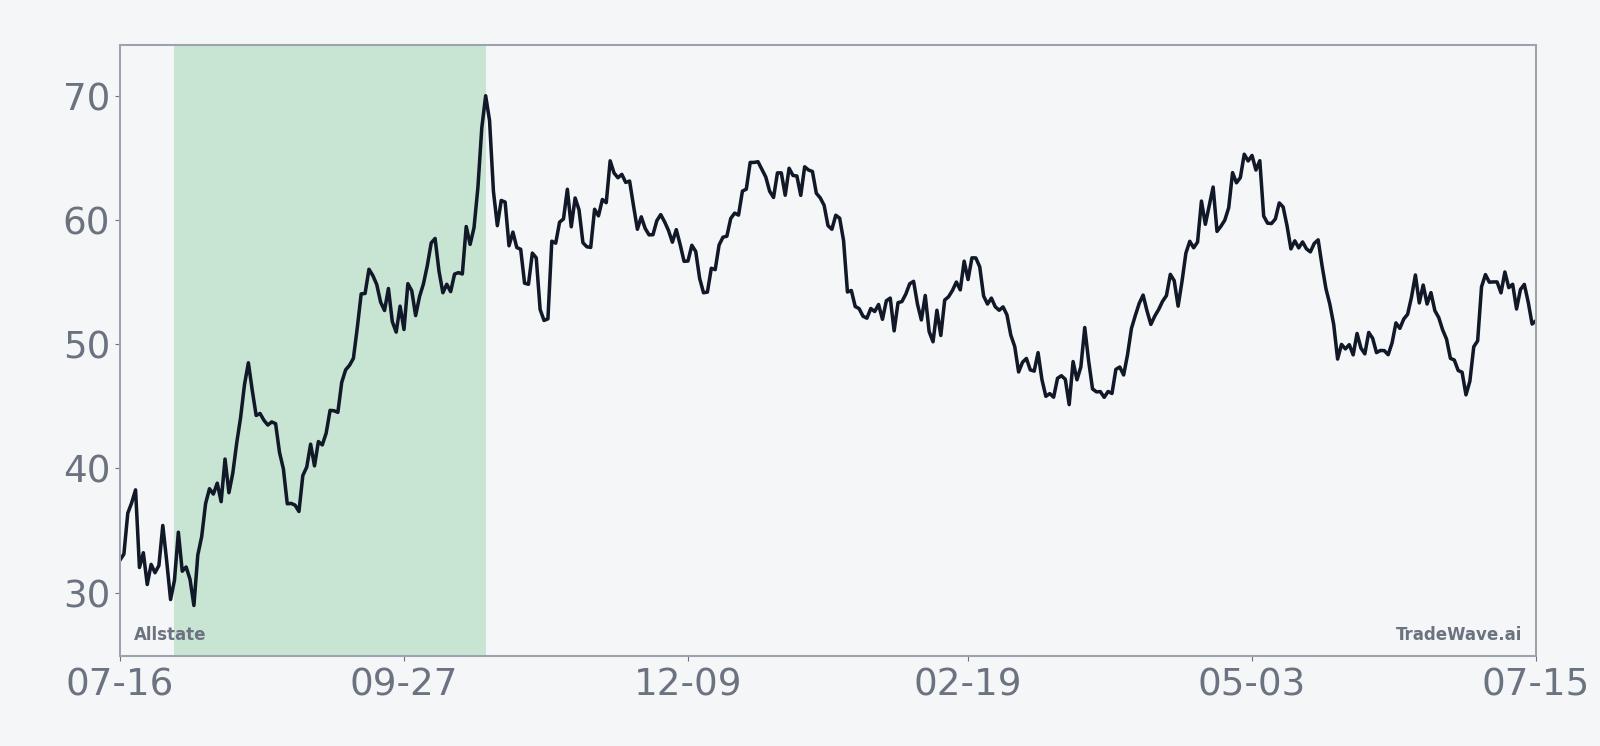
- The upcoming window runs from Jul 30 for 81 trading days, covering late summer into the heart of the midterm election year.
- Trade Direction is long, supported by a Sharpe ratio of 1.87 that signals strong risk-adjusted returns in prior cycles.
- The TradeWave Ratio of 2.98 suggests price has typically traveled meaningfully in the trade direction within the window, not just drifted higher.
- Even in winning years, intraperiod drawdowns have at times been sharp, so timing and risk controls have mattered inside this Allstate trading window.
According to historical data from TradeWave.ai, this midterm-election-year stretch for Allstate behaves very differently from an average quarter on the calendar. The next section unpacks how that pattern has played out in past cycles and what it means as the 2026 window approaches.
How has Allstate (ALL) traded in this midterm-year seasonal window?
Allstate has posted gains in all seven midterm-election-year windows that start around Jul 30 and run for 81 trading days, averaging 11.12% advances with no losing years. Today the stock closed at 250.35, down 2.4% on the session and about 2.8% below its 52-week high of 257.67, after a strong run that has already delivered a 13.0% gain over the past month.
The presidential election cycle matters here because this pattern only looks at the last seven midterm election years, not every calendar year. That focuses the analysis on a phase when policy uncertainty, rate debates and fiscal positioning often push investors toward or away from financials and insurers in a consistent way.
Across those seven midterm-year samples, Allstate’s average gain of 11.12% lines up with a 107% cumulative return for the strategy, which annualizes to 11.0%. The median outcome is similar at 11.46%, a sign that results have clustered around a solid double-digit gain rather than being skewed by a single outlier year.
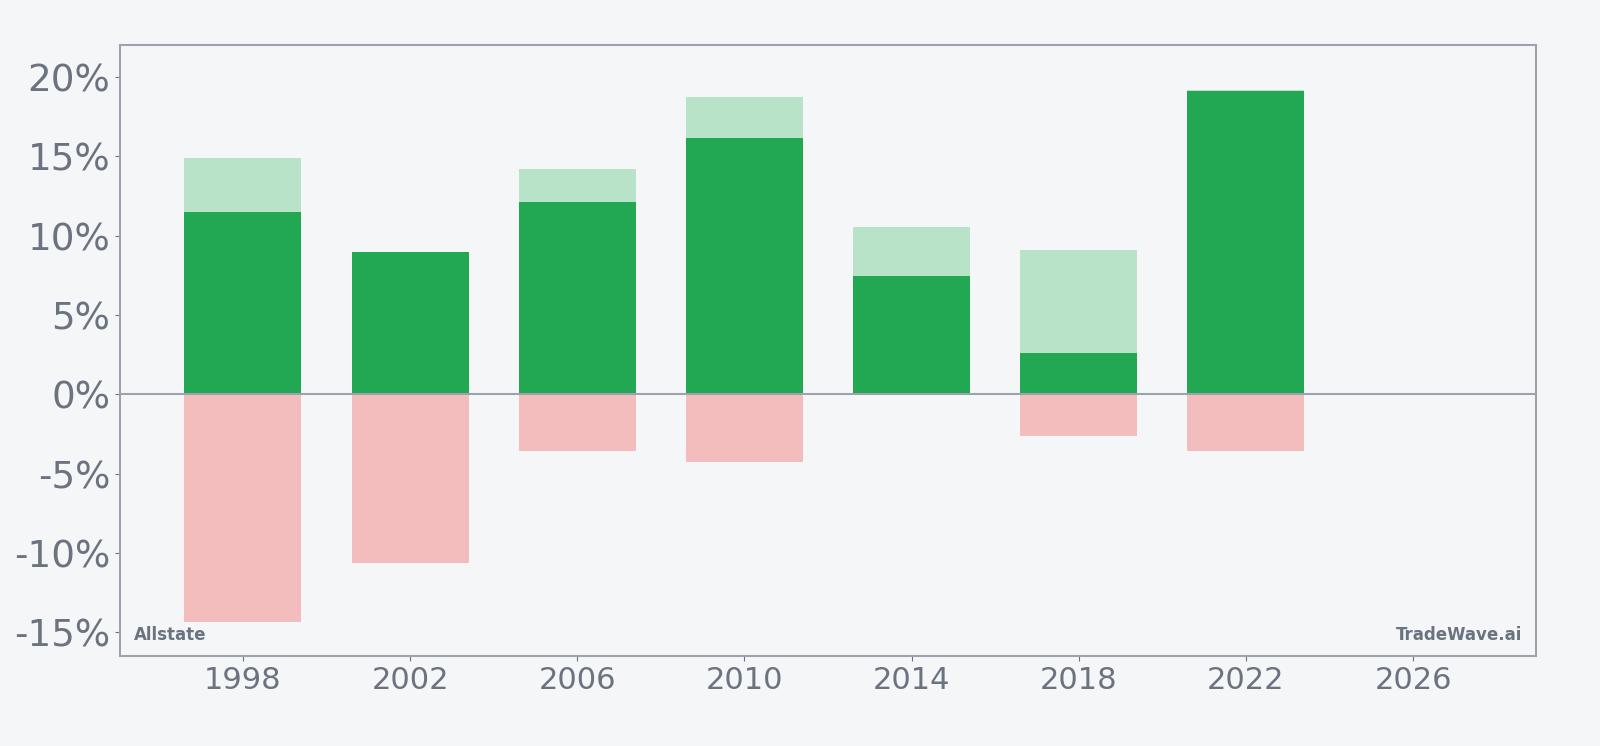
The win-loss record is clean: 7 winners, 0 losers. The weakest year in the sample was 2018, when the stock still finished the window up 2.6% after a choppy stretch that saw a peak run-up of 9.1% and a worst drawdown of 2.64% from the entry. The strongest year was 2022, when Allstate gained 19.08% in the window with a maximum favorable move of 19.15% and only a 3.54% adverse excursion along the way.
The MFE and MAE profile shows that this has been an active trading window, not a sleepy grind. In 1998, for example, the stock finished up 11.46% but at one point had rallied 14.88% from the start of the window while also enduring a 14.36% drawdown from entry before recovering. Other years such as 2006 and 2010 show strong peak run-ups in the mid-teens with more modest single-digit pullbacks.
The Sharpe ratio of 1.87 captures that the end-of-window results have been strong relative to volatility. At the same time, the TradeWave Ratio of 2.98 indicates that intraperiod swings have often been larger than the final net gain, which fits a profile where traders see both tradable pullbacks and rallies inside a generally bullish seasonal trend.
Trend metrics back up the long bias. The pattern’s “Trend Long” score of 76 and “Trend Long1” of 90 show that returns have tended to build in the trade direction rather than whipsawing randomly. In practical terms, prior midterm-year windows have more often rewarded staying with the move than trying to fade every uptick.
A stacked view of net returns with peak rallies and worst drawdowns shows how much room Allstate has historically had to run, and how deep pullbacks have gone, inside this window.
Put it together and the message is simple: seven for seven, with double-digit average gains and enough intraperiod volatility to matter for both investors and traders.
Why does Allstate (ALL) follow this seasonal pattern?
One likely driver is the way the insurance sector lines up its earnings calendar and capital-return decisions with the midyear policy and rate backdrop in midterm election years. Analysts have pointed to insurers as classic beneficiaries of higher-for-longer yields and steady consumer balance sheets, which often become clearer by late summer in these cycles.[1] This pattern may also reflect institutional portfolio repositioning as investors rebalance away from early-year AI leaders into more defensive, cash-generative names like Allstate during the heart of the midterm year.[1]
History does not guarantee future results, and even in a perfect win record window, adverse excursions inside the period can be large enough to challenge unhedged positions.
What is driving Allstate (ALL) today?
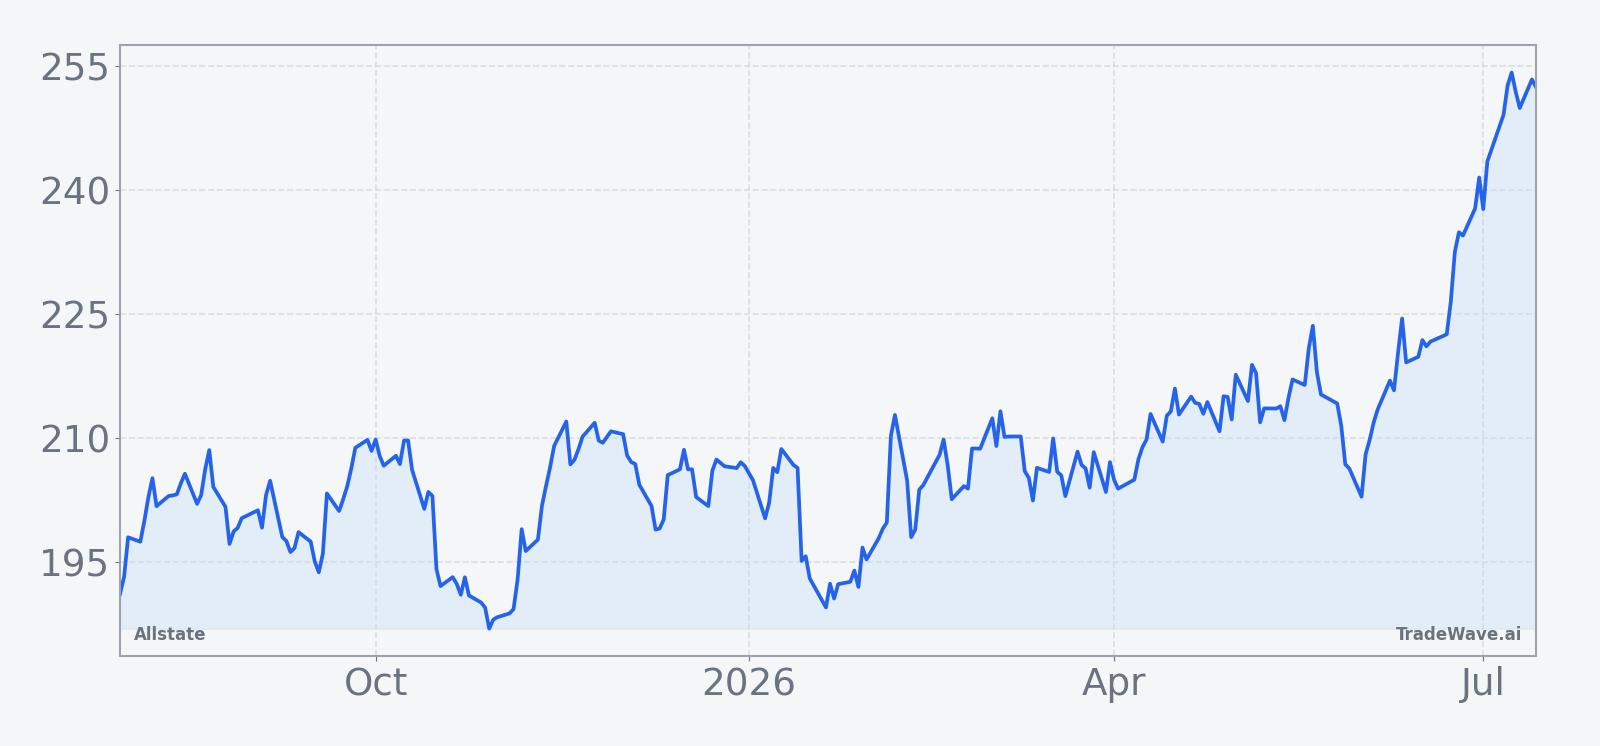
Allstate closed Wednesday at 250.35, down 6.10 points or 2.4% on the day, after trading between 250.06 and 256.09 in a busy session that saw volume of about 1.38 million shares against a 20-day average near 1.95 million. The stock sits roughly 2.8% below its 52-week high of 257.67 and well above its 50-day moving average around 224, underscoring how extended the recent breakout has been.
In May 2026, a CNBC segment highlighted Allstate as an insurance name breaking out of a long consolidation between roughly 190 and 205, with technicians watching the 220 to 222 zone as a key resistance band and the major moving averages as support.[1] That move has since carried the stock to a string of new all-time highs, helped by a business model that pairs steady premium collection with capital returns through dividends and buybacks, including $881 million returned to shareholders in the first quarter of 2026.[1]
That same May discussion noted that Allstate had logged 17 new all-time highs this year, describing the advance as a “steady grind higher” rather than a handful of blowout days.[1] For traders looking at the upcoming seasonal window, that kind of persistent trend behavior matters: it suggests that when Allstate gets into gear, it often does so through repeated incremental highs rather than one-and-done spikes.
The chart below shows how that breakout and grind higher line up with a 60-day seasonal projection into the heart of the midterm-year window.
What should traders watch as this Allstate seasonal window approaches?
The first marker is the calendar itself: the 81-day window begins on Jul 30, right as the midterm election year moves from its early, policy-debate-heavy phase into the stretch where positioning for the pre-election year starts to matter. Historically, that has been when Allstate’s seasonal tailwind has kicked in, with gains often building through late summer and into the fall.
Second, price levels matter. Traders will be watching whether the 50-day moving average near 224 and the prior breakout zone around 220 to 222 continue to act as support if volatility picks up. A pullback that holds those levels while the seasonal window is open would be consistent with prior cycles where Allstate saw meaningful intraperiod drawdowns but still finished the window higher.
Third, behavior relative to the historical pattern will be a tell. If Allstate enters the window and quickly starts printing higher highs with only shallow dips, it would echo stronger years like 2010 and 2022. A sluggish or negative start, especially if accompanied by deeper-than-usual drawdowns, would mark a clear departure from the seven-for-seven record and signal that macro or company-specific forces are overpowering the usual seasonal bias.
Finally, traders who have been tracking the “steady grind higher” profile highlighted in May will want to see whether that character persists or fades.[1] Continued incremental highs on normal volume would fit the historical seasonal trend, while a shift toward sharp, news-driven spikes or heavy-volume reversals could indicate a more crowded, fragile trade heading into the heart of the midterm-year policy calendar.
Sources
About this seasonal analysis
Seasonal pattern data is sourced from TradeWave.ai, which analyzes historical price behavior across annual calendar windows going back up to 30 years. Read the full data methodology or the book The 100-Year Pattern by Afshin Moshrefi (2026 edition). Past performance of seasonal patterns does not guarantee future results. This article is for informational purposes only and does not constitute investment advice.