Crude Oil (CL) Slides as U.S.-Iran Talks Ease Supply Fears Into a Historically Weak Window
Crude Oil is heading into a historically weak late-summer-to-Thanksgiving seasonal window just as futures rebound toward $82 and Middle East supply risk swings between escalation and détente.
Price as of Jul 29, 2026: $82.16 (intraday).

What is the seasonal pattern for Crude Oil (CL)?
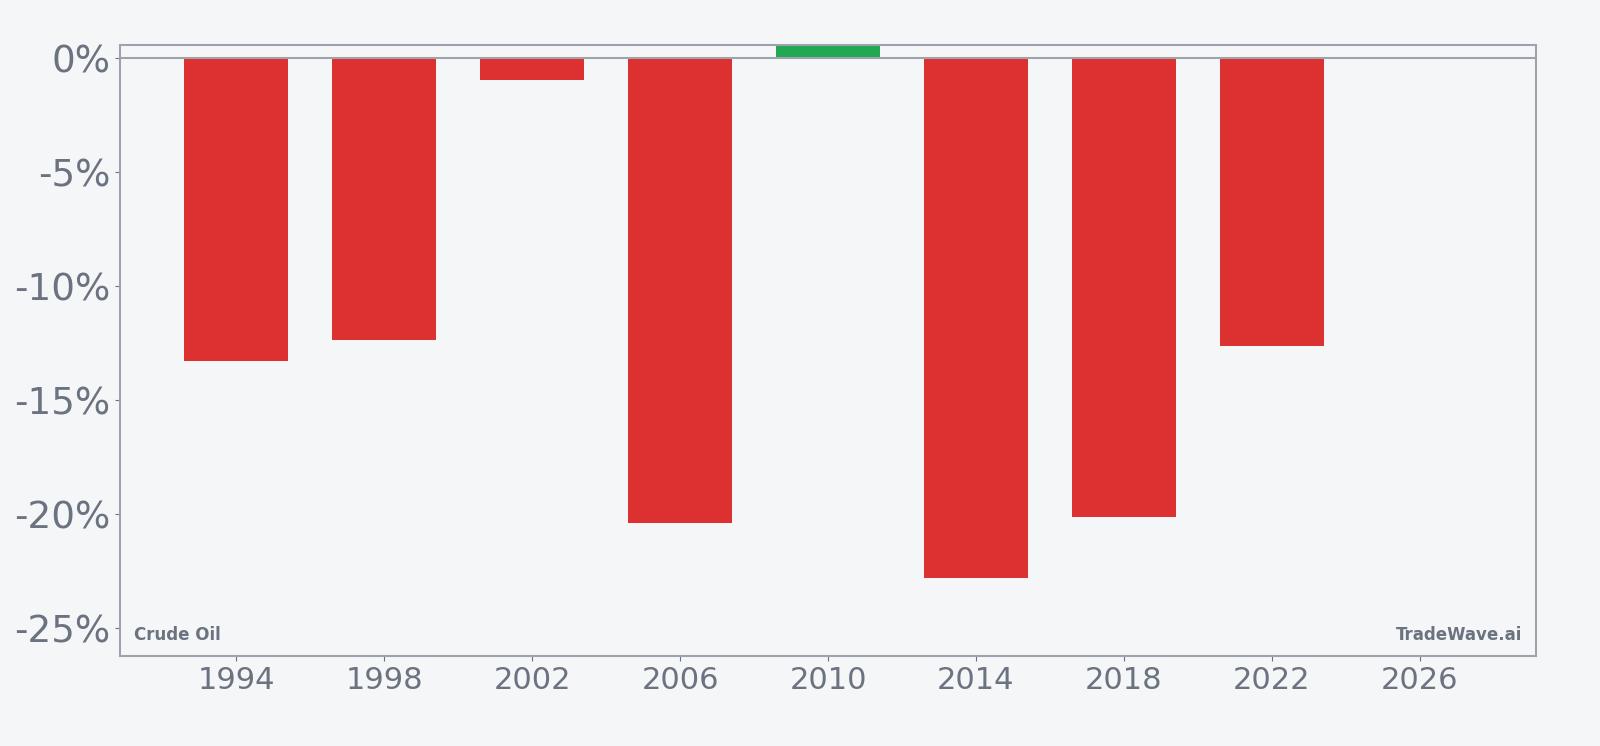
Crude Oil has fallen in 7 of 8 midterm-election-year Jul 31 to Nov 22 windows, with an average 14.65% gain in winning years for the short side.
- 7 for 8 in this window, with shorts averaging 14.65% profit in winning years across the last 8 midterm election cycles.
- Percent Profitable is 88%, with 7 winning short years and just 1 losing year in the sample.
- Including every year, Avg Profit - All is 13%, while the average loss in the lone losing year is a modest -0.49%.
- The 115-day window runs from Jul 31 to Nov 22 and is explicitly a short-direction pattern for Crude Oil.
- The TradeWave Ratio of 2.91 signals that price has typically traveled meaningfully in the short direction within the window, even before final closes.
- Stacking this midterm-year Crude Oil trading window across the sample compounds to a 155% cumulative gain for the short side.
According to historical data from TradeWave.ai, this late-summer-to-Thanksgiving stretch in midterm election years has behaved very differently from an average quarter for crude. The next section walks through how that pattern has played out and why it matters for traders watching CL around the upcoming Jul 31 start date.
How has Crude Oil (CL) traded in the upcoming Jul 31 to Nov 22 window?
Crude Oil has closed lower in 7 of the past 8 midterm-election-year Jul 31 to Nov 22 windows, with shorts posting an average 14.65% gain in winning years. Futures settled at $82.16 in the prior session, up 3.8% on the day and sitting well below the 52-week high of $119.48 but comfortably above the $54.98 low. The combination of a strong historical short-side edge and a market that has already bounced hard from last month’s pullback gives this year’s window extra bite for anyone exposed to energy prices.
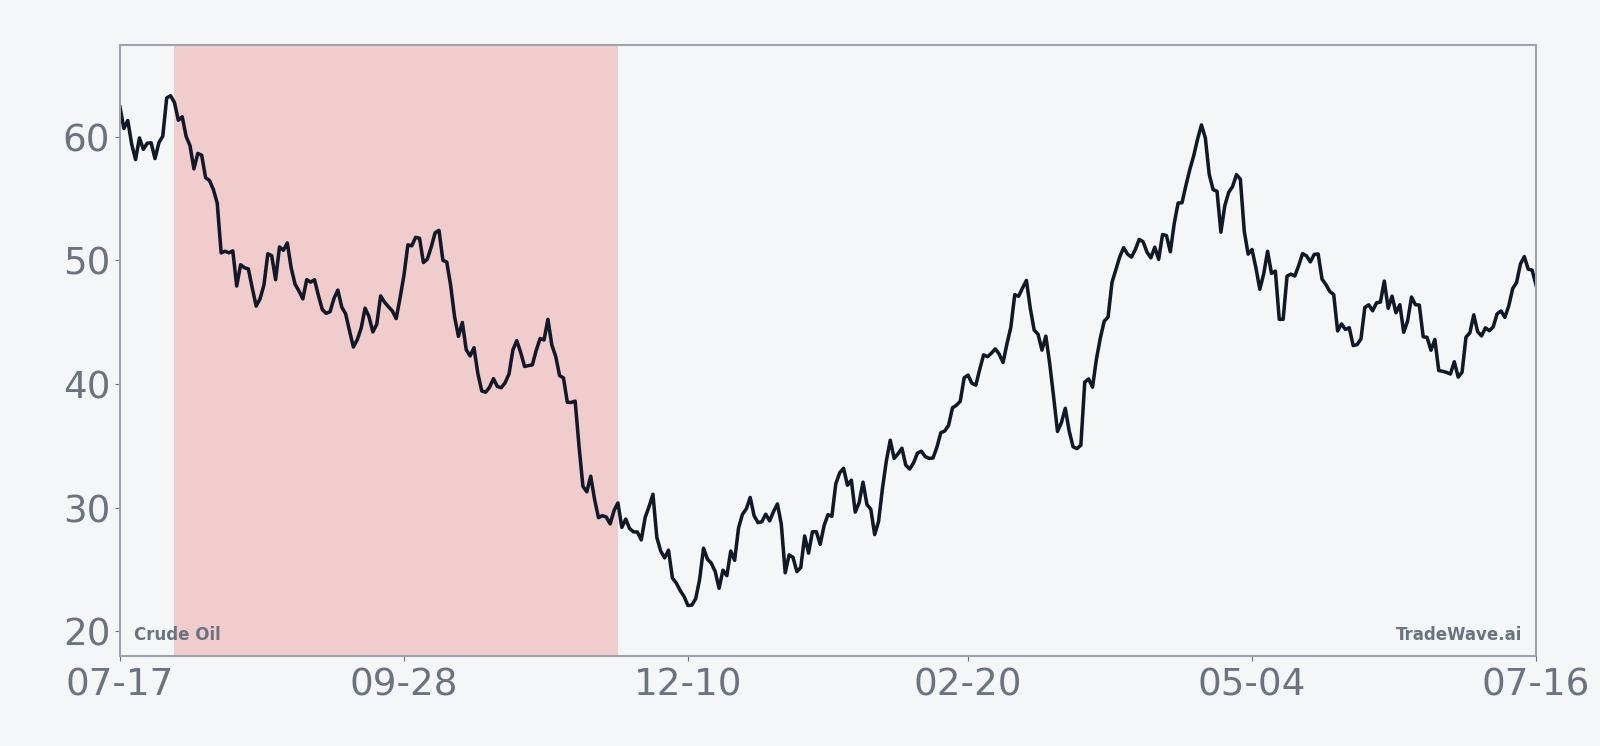
Because this pattern is grouped by the presidential election cycle, it only looks at midterm election years, not every calendar year. That matters for crude because midterm years often coincide with shifting fiscal policy, regulatory resets and geopolitical repositioning that can change the supply-demand balance for energy in ways that differ from typical years.
The trade direction for this window is explicitly short. In 7 of the 8 midterm-election-year samples, selling Crude Oil at the Jul 31 close and covering on Nov 22 would have been profitable, with the average winning year delivering a 14.65% gain for the short side and the all-years average, including the lone loser, still a hefty 13% return. The single losing year saw only a -0.49% loss, which is small compared with the size of the typical winning move.
Looking at individual years shows how this CL seasonal trend has played out. In 2014, for example, a short entered around $98.17 and exited near $75.78, a net move of -22.81% as crude slid into the Thanksgiving period. In 2006, the same window captured a -20.38% decline from roughly $74.40 to $59.24, again rewarding shorts as prices broke lower into the autumn.
The intraperiod swings have been large. In 1994, the best point-to-peak move for shorts, or maximum favorable excursion, was modest at 0.44%, but the worst drawdown from entry, or maximum adverse excursion, reached -19.56% before the trade finished with a -13.28% net return. In 2018, shorts endured a -21.72% worst drawdown at one point but still ended the window with a -20.12% net move in their favor as crude rolled over into year-end.
Across the full sample, the annualized return for this midterm-year window is 12.46%, with a Sharpe ratio of 1.32, which is high for a single 115-day slice of the calendar. The cumulative return from stacking the window across the eight midterm-election-year samples is 155%, underscoring how consistently this particular Crude Oil trading window has rewarded short exposure.
A second view combines yearly net results with the full intraperiod range, highlighting how far CL has typically swung in both directions inside this window.
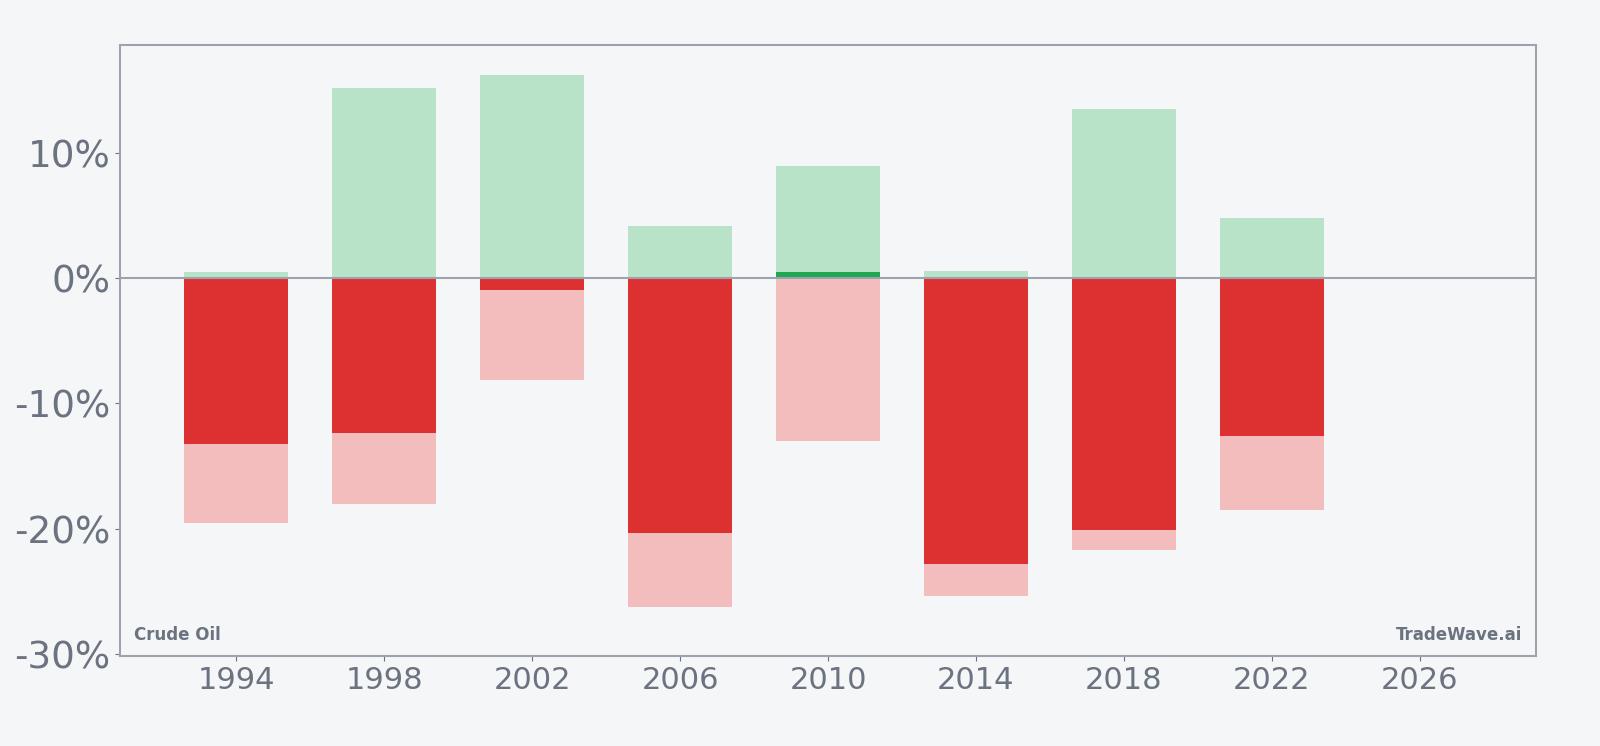
History does not guarantee future results; adverse excursions (MAE) can be large even in winning windows.
Why does Crude Oil (CL) follow this seasonal pattern?
One likely driver is the way global demand and supply expectations reset between late summer and early winter, as refiners shift from peak driving season to heating demand and OPEC decisions come into focus. Analysts have also pointed to midterm-year policy uncertainty, including sanctions, strategic reserve decisions and fiscal debates, which can weigh on growth expectations and crude pricing. This pattern may reflect that combination of softer demand expectations and shifting policy risk that tends to build into the U.S. midterm election season.
What is driving Crude Oil (CL) today?
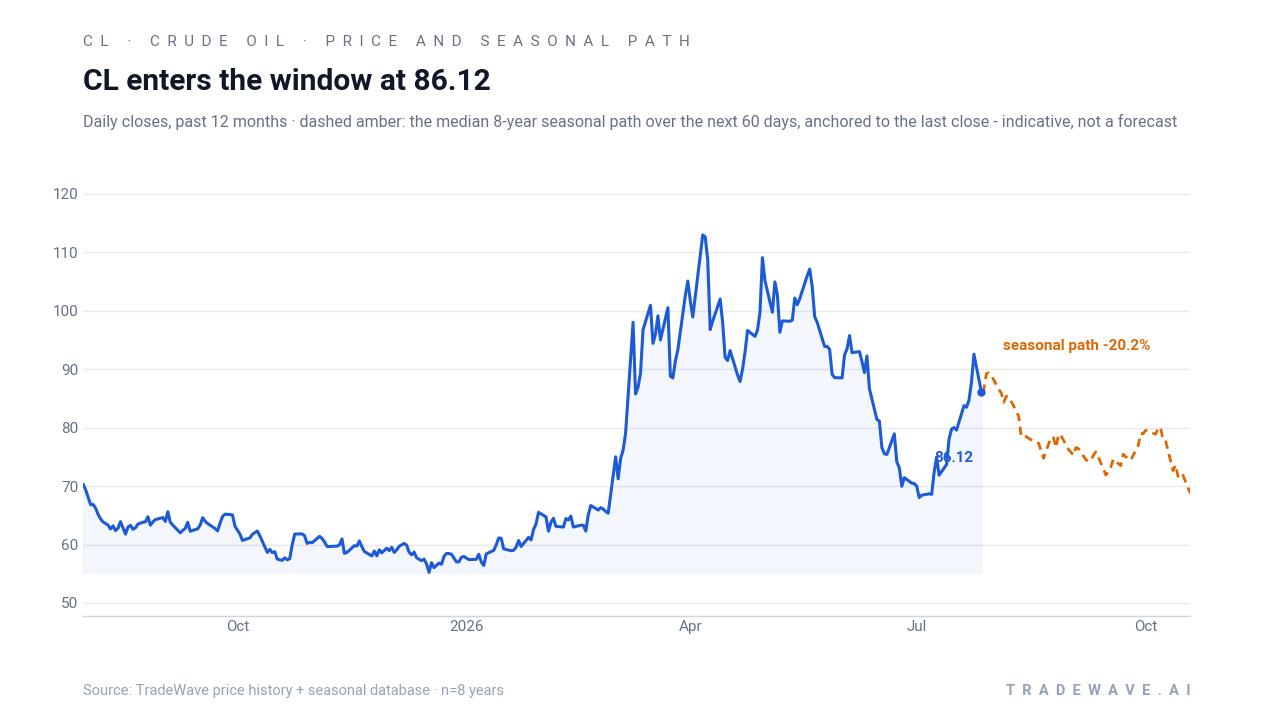
Crude Oil futures settled at $82.16 in the prior session, up 3.8% on the day as prices bounced from last week’s slide and traded near the 50-day moving average around $82.55. The contract remains well below its 52-week high of $119.48 and above the $54.98 low, leaving CL in the middle of a wide range as traders weigh geopolitical risk against signs of easing supply fears.
In late July 2026, reports that U.S. airstrikes on Iran were paused and that there was a potential pathway to talks helped knock more than 5% off crude, as markets dialed back the probability of a major supply disruption in the Strait of Hormuz.[1] Earlier in the year, Bank of America research had warned that a prolonged closure of the Strait could push oil above $200 a barrel and trigger recession risks through demand destruction, underscoring how binary the geopolitical backdrop can be for CL.[1] At the same time, analysts have flagged a persistent supply overhang that has kept prices capped when demand data softens, even against a tense Middle East backdrop.[1]
That mix of geopolitical premium and supply-side cushion is why this particular seasonal window matters. If diplomacy continues to reduce near-term disruption risk while inventories remain comfortable, the historical tendency for crude to drift lower from late July into November in midterm election years could align with the macro narrative. If tensions flare again or demand surprises to the upside, the same window has shown it can deliver sharp rallies inside the broader downtrend, which is exactly what the historical intraperiod ranges capture.
The chart below situates the latest move in its recent multi-month context alongside the median seasonal path for the next 60 days.
What should traders watch in this Crude Oil (CL) seasonal window?
First, the calendar. The 115-day midterm-election-year window begins on Jul 31 and runs through Nov 22, overlapping the heart of the U.S. election campaign and key OPEC and demand data releases. Historically, that stretch has favored shorts in 7 of 8 cycles, with sizable average moves, so how CL behaves in the first few weeks will be an early tell on whether this iteration is tracking the historical pattern.
Second, watch the geopolitical tape around the Strait of Hormuz and U.S.-Iran dynamics. If the recent pause in strikes and talk of potential negotiations holds, the risk premium that helped push crude higher earlier in 2026 could continue to bleed out, which would rhyme with the historical tendency for prices to soften into late autumn.[1] Any renewed disruption or escalation that threatens exports from the Gulf would cut against the seasonal script and could turn this into one of the rare losing years for the short-side pattern.
Third, monitor demand and inventory data as the market transitions from peak driving season toward winter. Weekly U.S. stock reports, refinery runs and global growth indicators will shape whether the supply overhang narrative persists or gives way to a tighter market, which would matter for how far any seasonal downside can run.[1] A pattern-consistent year would likely see rallies sold and lower highs into October and November, while a clear break above recent resistance with tightening fundamentals would be a sign that this midterm-year window is diverging from its usual path.
Sources
About this seasonal analysis
Seasonal pattern data is sourced from TradeWave.ai, which analyzes historical price behavior across annual calendar windows going back up to 30 years. Read the full data methodology or the book The 100-Year Pattern by Afshin Moshrefi (2026 edition). Past performance of seasonal patterns does not guarantee future results. This article is for informational purposes only and does not constitute investment advice.