Lean Hogs (HE) Enters Late-July Stretch With 9-of-10 Record of August Losses
Lean Hogs futures are sliding into a late‑summer stretch that has historically been one of the weakest on the calendar, just as prices trade well below last year’s highs.
Price as of Jul 30, 2026: $83.25 (last close).
What is the seasonal pattern for Lean Hogs (HE)?
Lean Hogs has fallen in 9 of 10 years during the Jul 31 to Aug 17 window, with an average loss of 16.07% in winning years for the short side.
- 9 for 10 in this window, with short trades averaging 16.07% gains in winning years over the past decade.
- The Jul 31 to Aug 17 Lean Hogs seasonal window has been historically bearish, with 90% Percent Profitable for shorts, 9 winners and 1 loser.
- Including every year, Avg Profit - All for the short side is 14%, showing the single losing year has not erased the pattern’s edge.
- The strongest short year in this window saw a 23.99% price drop from late July to mid‑August, while the lone losing year posted a 2.92% rally.
- Intraperiod swings have been large, with several years showing double‑digit adverse moves before prices ultimately rolled over, underscoring the need to respect drawdown risk.
- Stacking this 18‑day Lean Hogs trading window each year would have compounded to a 267% cumulative gain for shorts across the 10‑year sample.
According to historical data from TradeWave.ai, this late‑July to mid‑August stretch in Lean Hogs has behaved very differently from an average month on the calendar. The next section walks through how that pattern has played out across the past decade and what it implies for the current window.
How has Lean Hogs (HE) traded in the late‑July to mid‑August window?
Lean Hogs has closed lower in 9 of the past 10 years between Jul 31 and Aug 17, making this one of the most consistently bearish seasonal windows on the hog calendar for short positions. The new 18‑day stretch opens with the prior session’s close at 83.25, leaving the contract about 24.3% below its 52‑week high of 110.025 and only modestly above the 77.35 low, a soft spot that arrives after a roughly 9.28% slide over the past month.
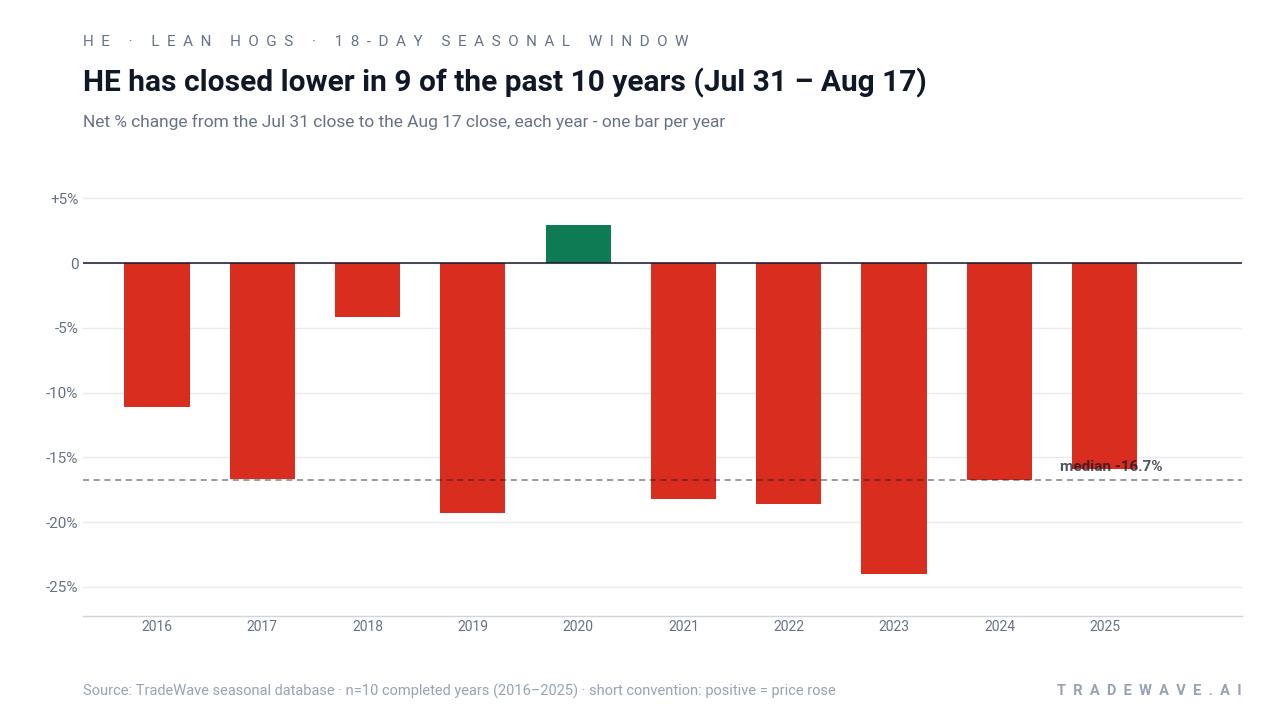
The Trade Direction for this pattern is short, and the numbers line up with that bias. Across the past decade, short exposure in this 18‑day Lean Hogs trading window has produced a 90% Percent Profitable record, with 9 winning years and just 1 losing year. In the winning years, the average gain for shorts has been 16.07%, while including every year in the sample still leaves a robust 14% Avg Profit - All.
The per‑year table shows how consistently the contract has broken lower once this window opens. The sharpest short “win” came in 2023, when Lean Hogs dropped 23.99% from a Jul 31 entry around 104.125 to an Aug 17 exit near 79.15. The only losing year for the short side was 2020, when prices climbed 2.92% over the window, a relatively modest squeeze compared with the double‑digit declines seen in most other years.
Volatility inside the window has been meaningful. Maximum favorable excursions, the best point‑to‑trough moves for shorts, have often pushed beyond the final net return, while maximum adverse excursions have at times been deep. In 2019, for example, the worst intraperiod drawdown from the short entry reached 21.85% before the contract ultimately finished the window down 19.29%, illustrating how quickly Lean Hogs can move against shorts even in a year that ends up strongly profitable for the pattern.
Trend metrics echo the same story. The pattern’s Trend Short score of 80 versus a Trend Long score of 5 suggests that, on average, prices have tended to roll over and stay heavy rather than snap back. A Trend Short1 reading of 10 and Trend Long1 of 69 hint that when bounces do occur, they tend to be shorter‑lived, with the dominant move skewed toward lower closes by the end of the 18 days.
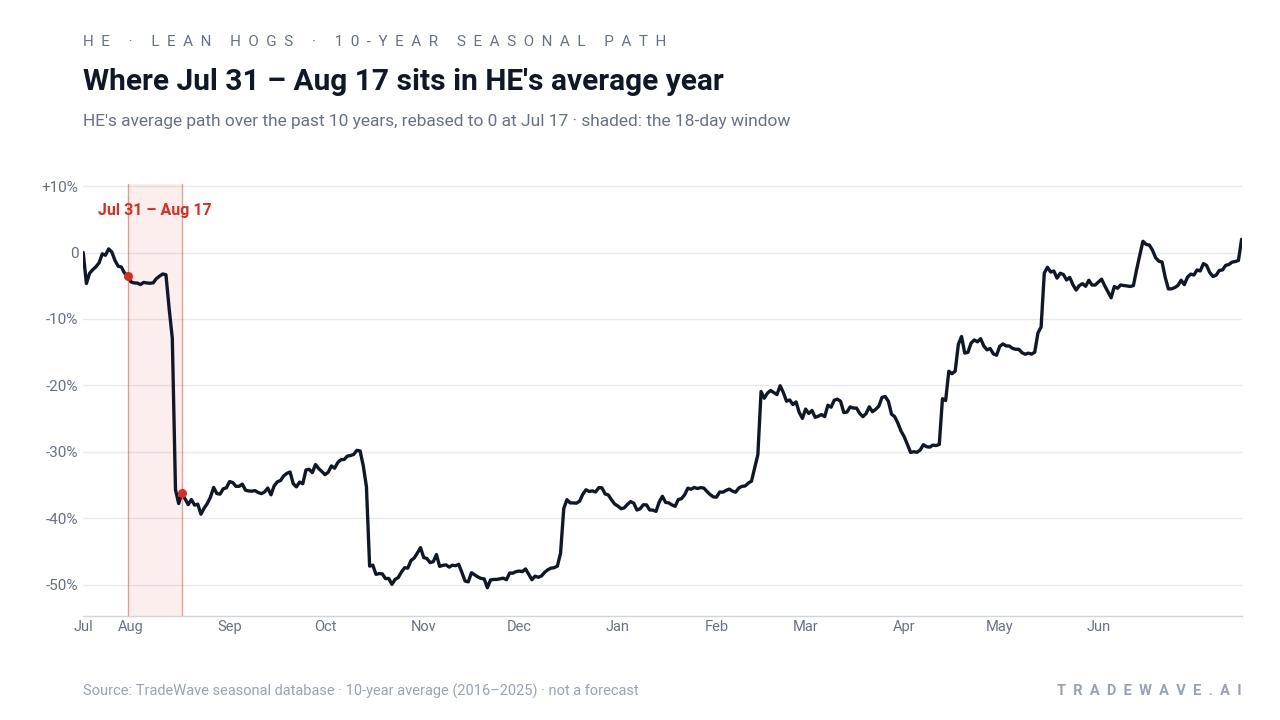
Yearly net and intraperiod swings highlight how often Lean Hogs has broken lower in this window while still delivering sizable counter‑trend rallies along the way.
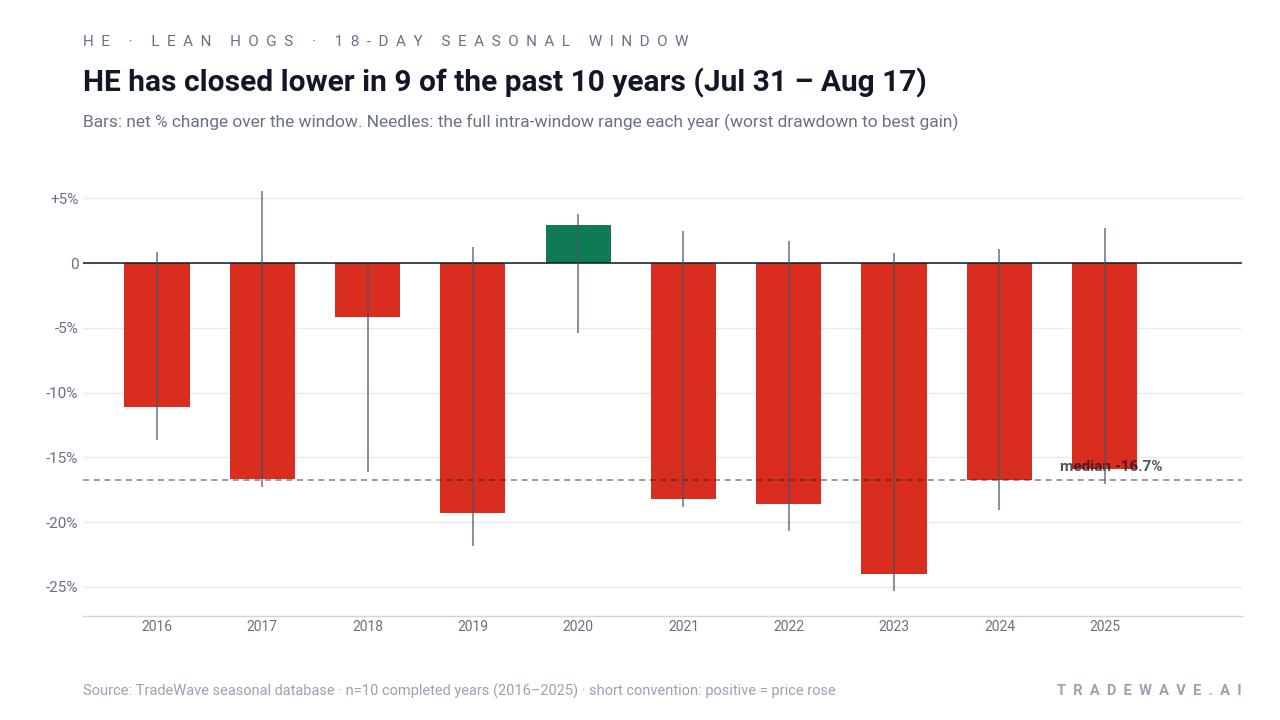
The bars and range chart underline that this is not a gentle drift lower. In several years, the full intraperiod range from worst drawdown to best gain has spanned more than 15%, with both the maximum favorable move for shorts and the maximum adverse move showing up quickly after entry. Large maximum favorable excursions combined with sizable maximum adverse excursions point to a high‑variance window where direction has tended to resolve lower by the close, but the path has rarely been smooth.
The cumulative return profile is equally striking. Compounding the net result of this 18‑day window each year from 2016 through 2025 would have produced a 267% cumulative gain for the short side, a level of consistency that stands out even in the often seasonal world of livestock futures. Nine for ten with triple‑digit cumulative returns is the record this window carries into the current cycle.
History does not guarantee future results; adverse excursions (MAE) can be large even in winning windows.
Why does Lean Hogs (HE) follow this seasonal pattern?
This late‑July to mid‑August weakness in Lean Hogs likely reflects commodity supply and demand seasonality more than technical quirks. One likely driver is the shift from peak summer grilling demand toward expectations for heavier hog supplies into the autumn, which can pressure forward pricing as packers and producers hedge. Analysts also point to seasonal patterns in feed costs and slaughter schedules that tend to loosen margins in this period, encouraging more aggressive selling into the futures curve.
What is driving Lean Hogs (HE) today?
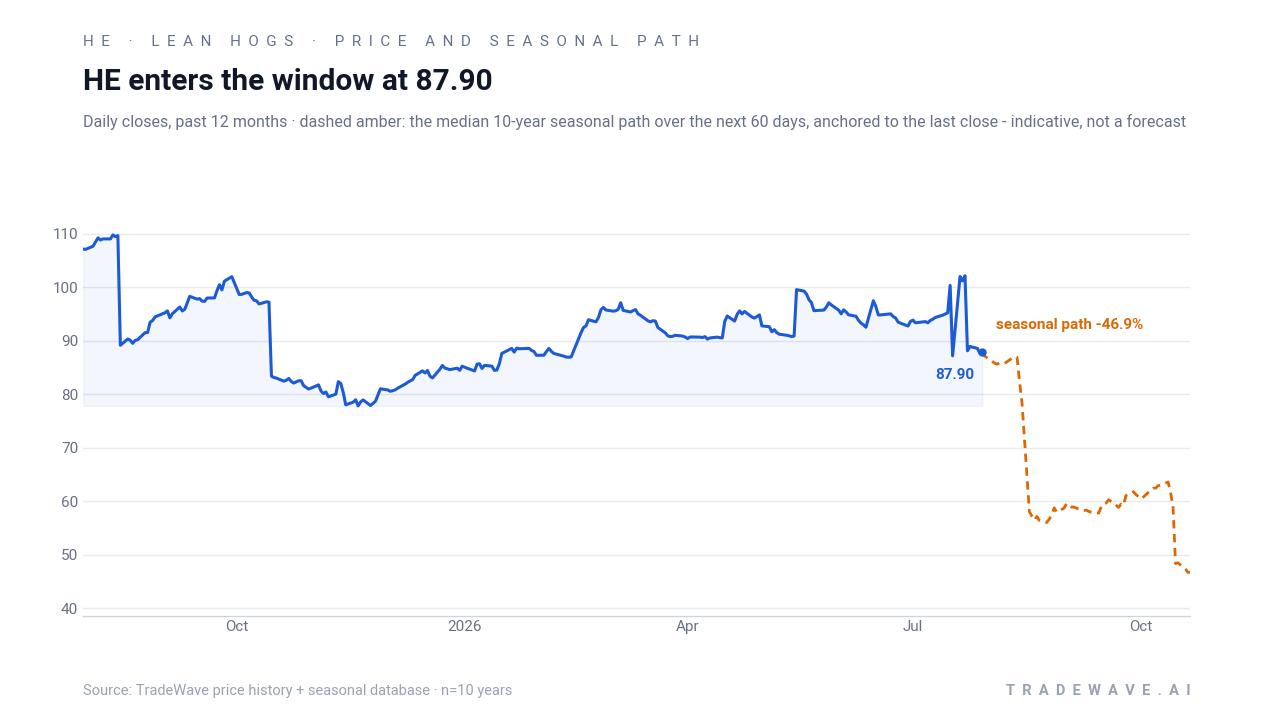
Lean Hogs futures settled at 83.25 in the prior session, leaving the contract well off its 52‑week high of 110.025 and only a few dollars above the 77.35 low, after dropping about 9.28% over the past month. That slide has pulled prices below the 50‑day moving average of 94.496 and comes with front‑month volume of roughly 34,950 contracts, nearly triple the 20‑day average of 12,175, a sign that traders have been actively repositioning around the latest leg lower.
With no single headline catalyst dominating the tape, the move looks more like a grind driven by shifting expectations for hog supplies, carcass weights and downstream pork demand than a discrete shock. The contract’s term structure, positioning and inventory data are quiet in the latest dataset, but the price action itself tells a clear story: Lean Hogs has broken down from the upper end of its 12‑month range and is testing support closer to the mid‑70s, an area that has repeatedly attracted buying interest over the past year.
The chart below situates the latest move in its recent multi‑month context and overlays the median seasonal path for the next 60 days.
What should traders watch in this Lean Hogs seasonal window?
For the next 18 days, the key test is whether Lean Hogs respects or defies its late‑summer seasonal pattern. Historically, this Jul 31 to Aug 17 window has favored the short side, with 9 of 10 years finishing lower and average winning‑year declines north of 16%. The contract is entering the stretch already under pressure and trading below its 50‑day moving average, which means any further weakness would be reinforcing, not reversing, the prevailing trend.
On the macro side, watch how broader risk sentiment and the dollar interact with livestock. A firmer dollar can weigh on U.S. meat exports, while any signs of slowing consumer demand for pork products could amplify seasonal downside. Conversely, a surprise tightening in hog supplies, weather‑related disruptions to production, or a rebound in export bookings could blunt or even flip the usual pattern, especially given how far prices already sit below the 52‑week high.
Technically, the 77 to 80 band that has marked the 52‑week low zone is the obvious line in the sand. A clean break below that area during the window would fit the historical script of sharp late‑summer selloffs, while a firm hold and quick recovery back toward the 90s would be a clear sign that this year is tracking closer to the lone losing year for shorts. Intraday volatility also matters: if the contract continues to show wide ranges with both strong rallies and deep selloffs inside the window, it would echo the historical pattern of large maximum favorable and adverse excursions even when the final close ends up lower.
Add it up and the message is straightforward. Lean Hogs is entering a historically weak seasonal window from a position of existing technical stress, with a decade of data showing that when this stretch breaks, it has often broken hard. Traders will be watching whether price action, volume and any fresh supply‑demand headlines over the next two and a half weeks confirm that script or finally deliver the rare exception.
Sources
About this seasonal analysis
Seasonal pattern data is sourced from TradeWave.ai, which analyzes historical price behavior across annual calendar windows going back up to 30 years. Read the full data methodology or the book The 100-Year Pattern by Afshin Moshrefi (2026 edition). Past performance of seasonal patterns does not guarantee future results. This article is for informational purposes only and does not constitute investment advice.