Silver (SI) Nears August 9-21 Window After Parabolic Run and 6-for-6 Midterm Drops
Silver futures are hovering near $58 after a parabolic multi-year run, just as an August 9–21 window with a flawless bearish track record in midterm election years comes into view.
Price as of Jul 30, 2026: $58.12 (intraday).

What is the seasonal pattern for Silver (SI)?
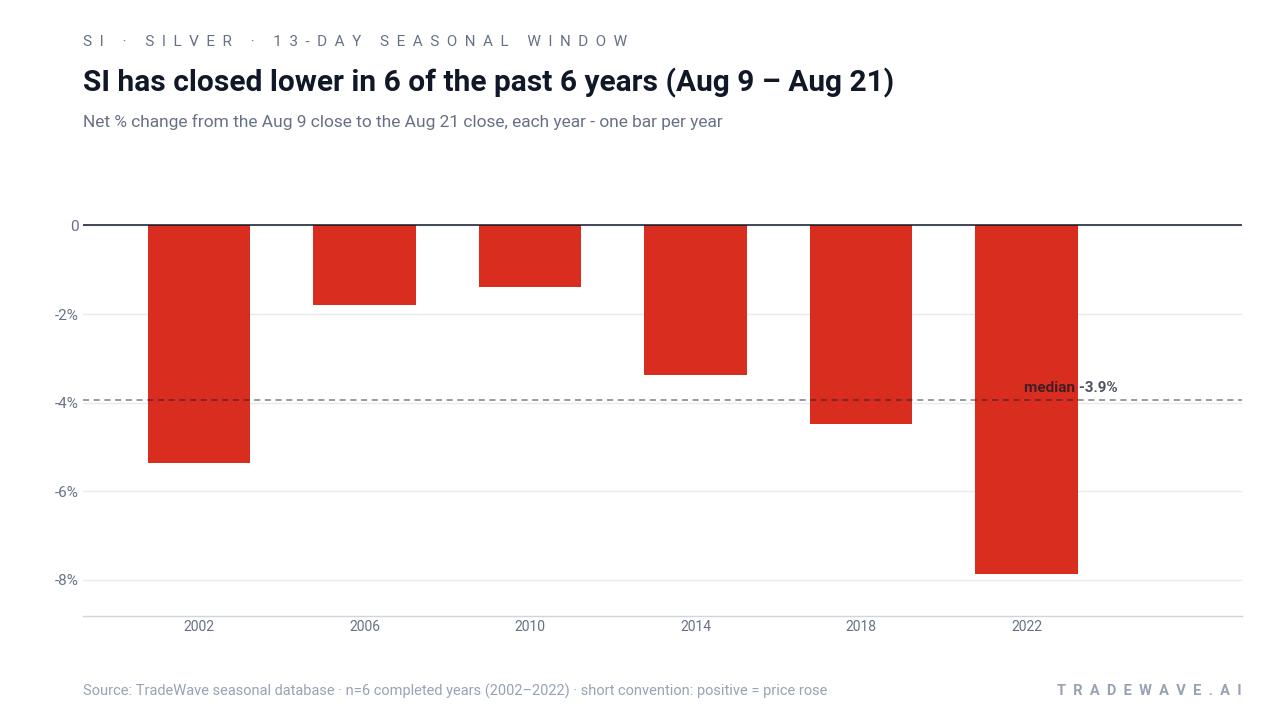
Silver has fallen in 6 of 6 midterm-year August 9–21 windows, with an average 4.04% gain for short positions in winning years.
- 6 for 6 in this window: Silver has closed lower in every August 9–21 stretch across the last 6 midterm election years, with shorts averaging 4.04% gains.
- Trade Direction: short, with 100% Percent Profitable, 6 winners and 0 losers across the sample.
- The window runs 13 calendar days from Aug 9 to Aug 21, grouping only midterm election years rather than consecutive calendar years.
- Average winner profit of 4.04% comes with a TradeWave Ratio of 2.44, meaning price typically travels meaningfully in the trade direction within the window.
- The Sharpe ratio of 1.62 for this pattern signals a historically strong risk-adjusted profile for short setups in this slice of the calendar.
- Individual years have seen adverse moves inside the window before rolling over, so intraperiod drawdowns can still be uncomfortable even when the final outcome favors shorts.
According to historical data from TradeWave.ai, this mid-August stretch has behaved very differently from an average month for Silver in past midterm election years. The next section walks through what that election-cycle seasonality has looked like and how it lines up with today’s backdrop.
How has Silver (SI) traded in the August 9–21 midterm-year window?
Silver has fallen in every August 9–21 window across the last six midterm election years, with short positions averaging a 4.04% gain over just 13 days. Futures settled around $58.14 in the prior session, well below the 52-week high near $121.79 and after a sharp pullback of about 9.35% over the past month, leaving traders to weigh a rare bearish seasonal pocket against a still-elevated long-term trend.
The pattern is built on the last six midterm election years, so it lines up with the same phase of the presidential cycle that markets are in today. Grouping by election year rather than simple calendar years matters for commodities like Silver because policy, fiscal stance and risk appetite often shift in repeatable ways around midterms, affecting safe-haven flows and industrial demand together.
Across the six midterm-year samples from 2002 through 2022, every August 9–21 window finished with Silver lower on a closing basis, consistent with the short trade direction. The weakest year for Silver in this slice was 2022, when the contract fell 7.86% from entry to exit, while the “mildest” decline was 1.39% in 2010, still a winning outcome for shorts. Average winner profit of 4.04% over 13 days, combined with a Sharpe ratio of 1.62, marks this as one of the cleaner bearish seasonal stretches on the Silver calendar.
Intraperiod swings have not been one-way. In 2002, for example, Silver’s best move inside the window was a 1.39% rally from the entry level before it ultimately finished 5.35% lower, while the worst drawdown from entry reached 6.0%. In 2018, the contract barely managed any upside at all, with the best intraperiod gain at negative 0.13% before sliding to a 4.49% net loss and experiencing a 7.2% adverse move from the short seller’s perspective. That mix of modest upside spikes and deeper downside excursions is what the MFE/MAE profile is capturing.
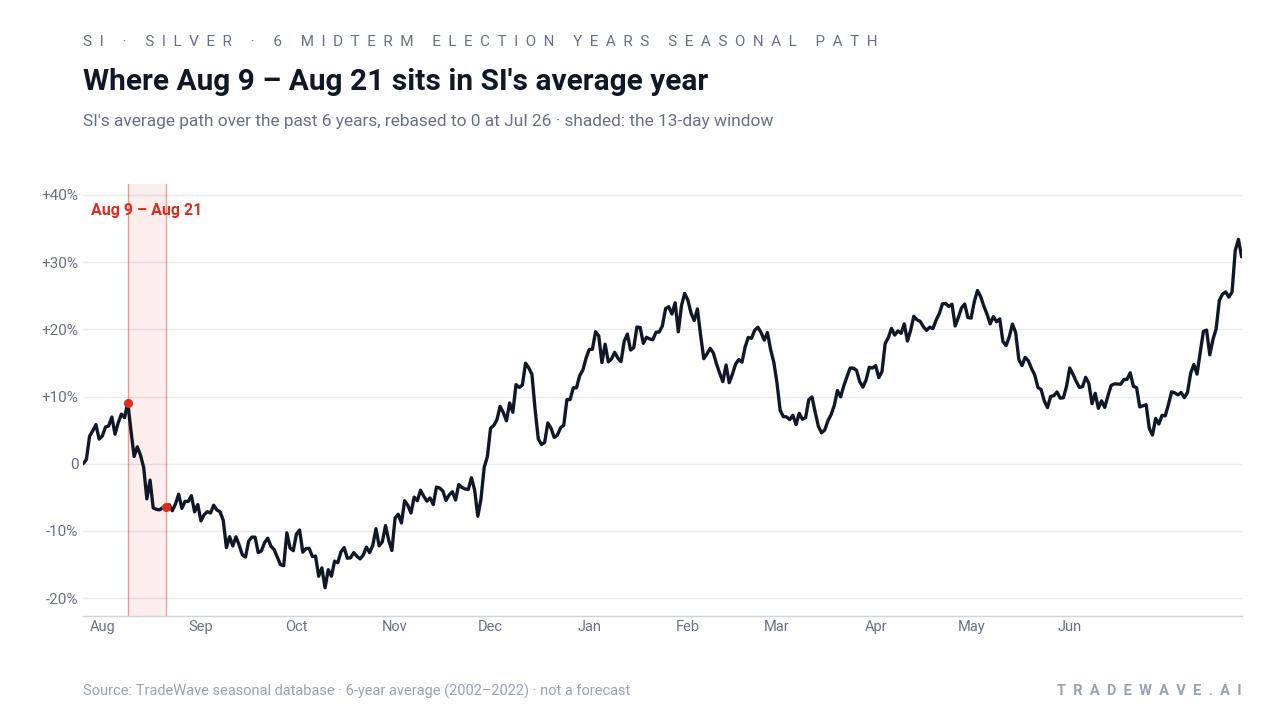
A second view shows how far Silver has typically swung inside the window before settling at its final close.
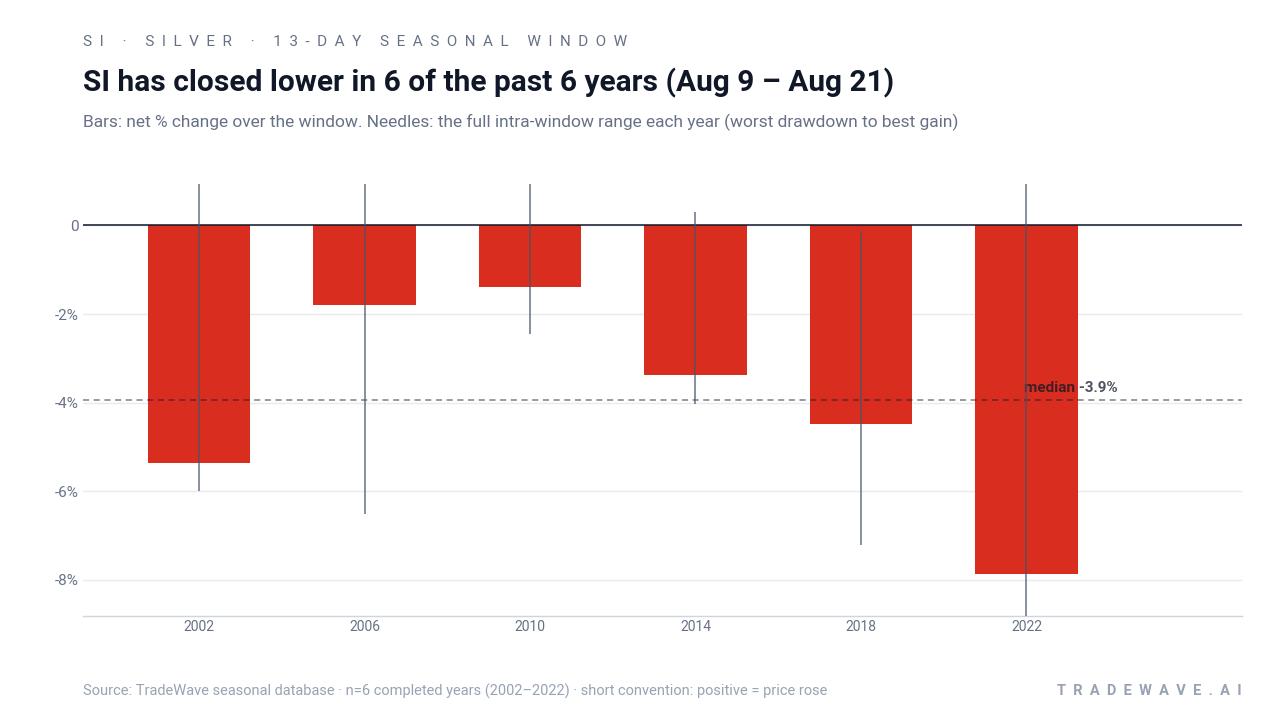
The stacked net/MFE/MAE view makes clear that this is not a quiet drift lower. In several years, Silver first moved against the short by 1% to 2% before rolling over, while the worst drawdowns from the short entry have pushed beyond 6% in 2002, 2006 and 2018. At the same time, the maximum favorable excursions have often extended beyond the final net decline, which is what drives a TradeWave Ratio of 2.44 and signals that intraday and intra-window moves have historically offered more than enough travel in the trade direction for active traders.
Stack the six windows together and the cumulative effect is striking: a 26% compounded gain for the short side across the sample, with no offsetting losing years. Add it up and the message is simple. Six for six, with consistent downside pressure in mid-August midterm years, is a pattern Silver traders cannot ignore.
Why does Silver (SI) follow this seasonal pattern?
This mid-August weakness may reflect a mix of commodity supply and demand seasonality and the policy calendar in midterm election years. One likely driver is that industrial users and investors often front-load hedging and safe-haven buying earlier in the summer, leaving a softer patch as positioning gets trimmed ahead of late-August macro events and fiscal debates. Analysts have also pointed to periodic profit-taking after strong first-half runs in precious metals, which can line up with midterm-year uncertainty and produce the kind of short-friendly pullbacks seen in this window.[8]
History does not guarantee future results, and the intraperiod downside for shorts (MAE) has been large in some years even when the window ultimately finished in their favor.
What is driving Silver (SI) today?
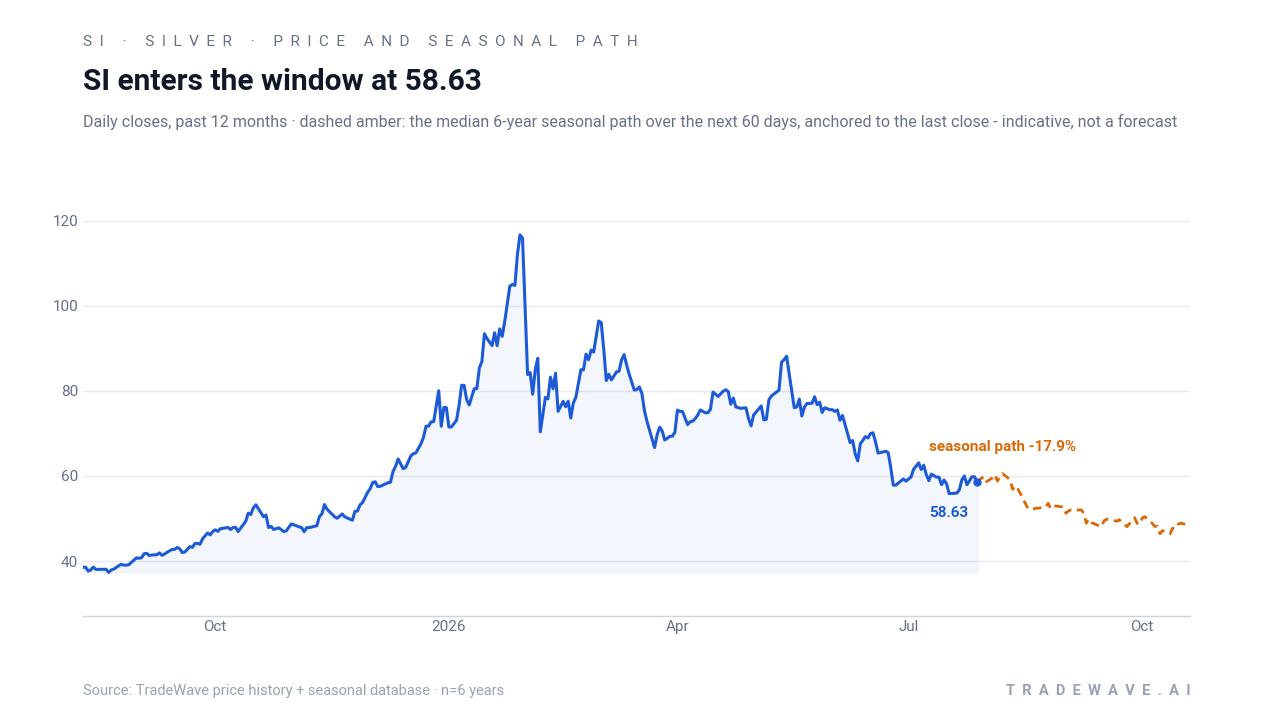
Silver futures ended the prior session at about $58.14, up roughly 1.1% on the day, after a month in which prices slid about 9.35% from recent highs. That pullback comes after Silver and gold set record levels in 2025 and carried strong gains into 2026, helped by tight supply and booming demand from electrification and power infrastructure projects.[10] A fresh technical analysis update on Jul 1, 2026 framed the latest correction as part of a broader bullish structure, arguing that dips have been used as accumulation opportunities rather than the start of a lasting top.[8]
In 2025, coverage highlighted how Silver’s rally was driven by a rare combination of safe-haven flows and industrial demand, with investors treating the metal as both a macro hedge and a play on the energy transition.[6] That dual role has persisted into 2026, with supply constraints across metals markets keeping a floor under prices even as short-term swings have become more violent.[10] The result is a market that can overshoot in both directions, which makes the upcoming August 9–21 seasonal window particularly relevant for traders trying to separate noise from historically meaningful pattern.
The chart below shows Silver’s recent 12-month path alongside a median 60-day seasonal projection for context.
What should traders watch as the August window approaches?
First, the calendar. The seasonal window opens on Aug 9 and runs through Aug 21, so any sharp rallies or breakdowns in the days just before that period will shape how stretched positioning feels going in. Second, levels: with Silver still far below its 52-week high but well above last year’s lows, traders will be watching whether the recent pullback stabilizes around the high-$50s or whether selling pressure resumes into the window.
Third, macro catalysts. Mid-August often brings key data on inflation, growth and central-bank expectations, all of which feed directly into safe-haven demand for precious metals. If those releases trigger another wave of volatility, behavior inside the August 9–21 stretch will show whether this midterm-year pattern of short-friendly declines is still intact or finally breaks. A continuation of the historical script would look like early choppiness followed by renewed downside, while a decisive upside squeeze through the window would mark the first clear failure of this six-for-six record.
Finally, traders should monitor how Silver trades relative to the broader precious-metals complex. In 2025 and into 2026, Silver’s moves have been tightly linked to gold and other metals that benefited from record demand and constrained supply.[10] If the complex weakens together into mid-August, it would align with the historical seasonal trend. If Silver diverges and holds firm while peers soften, that would be an early sign that structural demand from electrification and industrial users is starting to overpower this particular midterm-year pattern.
Sources
- Barchart / Yahoo Finance syndication, "What's Driving the Parabolic Rise in Silver Futures, and How Long Can the Rally Last?", Jan 6, 2026.
- Barchart / Yahoo Finance syndication, "Can Silver’s Price Continue to Rise?", Jan 22, 2026.
- Seeking Alpha, "Silver Accumulation Time As The Correction Comes To An End (Technical Analysis)", Jul 1, 2026.
- Yahoo Finance, "Gold and silver hit records in 2025. They aren't the only metals having a massive year.", Dec 22, 2025.
About this seasonal analysis
Seasonal pattern data is sourced from TradeWave.ai, which analyzes historical price behavior across annual calendar windows going back up to 30 years. Read the full data methodology or the book The 100-Year Pattern by Afshin Moshrefi (2026 edition). Past performance of seasonal patterns does not guarantee future results. This article is for informational purposes only and does not constitute investment advice.