Middle East War Risk Meets a 7-of-8 Losing Midterm Stretch for Crude Oil (CL)
Crude Oil is hovering in the mid-$70s even as an election-cycle seasonal window that has usually seen prices slide approaches, raising the stakes for energy traders into late summer and fall.
Price as of Jul 9, 2026: $74.48 (intraday).

What is the seasonal pattern for Crude Oil (CL)?
Crude Oil has fallen in 7 of 8 midterm-election-year windows starting around Jul 31, with an average 14.65% decline in winning years for the short setup.
- 7 wins and 1 loss for the short side in this 115-day window, with average winning moves of 14.65% lower.
- The upcoming window begins on Jul 31, 2026 and runs for 115 calendar days across the last 8 midterm election years.
- Percent Profitable is 88%, with 7 winners and 1 loser for the historical short pattern.
- Avg Profit in winning years is 14.65%, while Avg Profit - All, including the lone losing year, is still a sizable 13% move lower.
- The TradeWave Ratio of 2.91 signals that price has typically traveled far in the trade direction inside the window, with sizable intraperiod swings.
- Sharpe ratio of 1.32 points to a historically strong risk-adjusted profile for this specific Crude Oil seasonal short window.
According to historical data from TradeWave.ai, this midterm-election stretch in Crude Oil has behaved very differently from an average quarter on the calendar. The next section walks through how that pattern has played out in past cycles and what it could mean for the coming 115-day window.
How has Crude Oil (CL) traded in this midterm-year seasonal window?
Crude Oil has dropped in 7 of the last 8 midterm-election-year windows that start around Jul 31, with short trades averaging 14.65% gains when they work. Futures are changing hands near $74.42 per barrel, well below last year’s spike above $100 and far off the 52-week high near $119, leaving plenty of room on the chart if another midterm slide develops. This combination of a historically bearish CL seasonal trend and a still-elevated absolute price level is why the upcoming 115-day window is on macro traders’ radar.
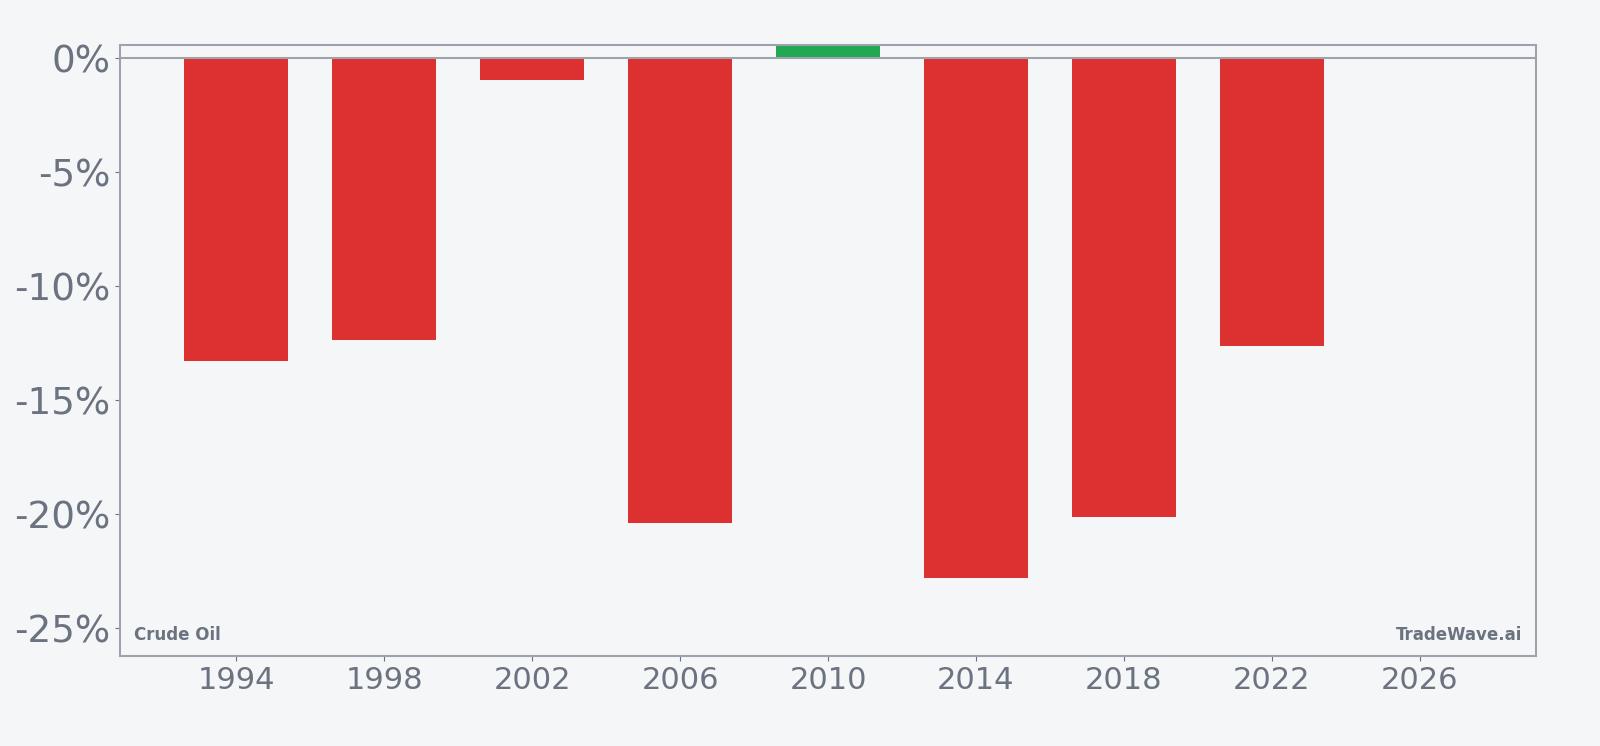
Grouping the data by the presidential election cycle matters here because energy policy, sanctions, and fiscal priorities often shift in the midterm election year, which can alter supply expectations and risk appetite in ways that repeat from cycle to cycle. In this case, the pattern phase covers the last 8 midterm election years, while the calendar is also in a midterm year, with the upcoming window bridging into the year before the presidential election when policy and growth expectations typically reset.
The trade direction for this pattern is explicitly short, and the historical record lines up with that bias. Across the last 8 midterm-election-year windows starting around Jul 31 and lasting 115 calendar days, 7 produced net declines in Crude Oil, while only 1 ended higher. Percent Profitable for the short side is 88%, with 7 winners and 1 loser, and the all-years average move is a 13% drop, which is large for a multi-month futures window.
Average profit in winning years is 14.65%, meaning that when the short pattern has worked, CL has typically fallen by mid-teens percentages from entry to exit. The median profit is 12.95%, so the typical winning year is not just a small drift lower but a meaningful slide. Including the lone losing year trims the Avg Profit - All to 13%, which still points to a historically strong bearish seasonal tendency for this Crude Oil trading window.
The per-year table shows how that has played out in specific cycles. In 2014, for example, a short entered near $98.17 and exited around $75.78, a net return of about -22.81% for spot prices and a strong year for the short setup. In 2006, the pattern captured a similar move, with CL dropping from roughly $74.40 to $59.24, a -20.38% net change over the window. Even the softer years, such as 2002 with a -0.96% net move, still leaned in favor of the short direction.
Intraperiod swings have been significant. Maximum favorable excursions, which measure the best point-to-peak move in the trade direction during the window, have ranged from about 4% to more than 16% in individual years. Maximum adverse excursions, the worst drawdowns from entry, have at times been deep, with several years showing CL moving more than 18% against the short before ultimately finishing lower. That mix of large MFE and sizable MAE underscores that this is a high-variance seasonal regime rather than a gentle glide path.
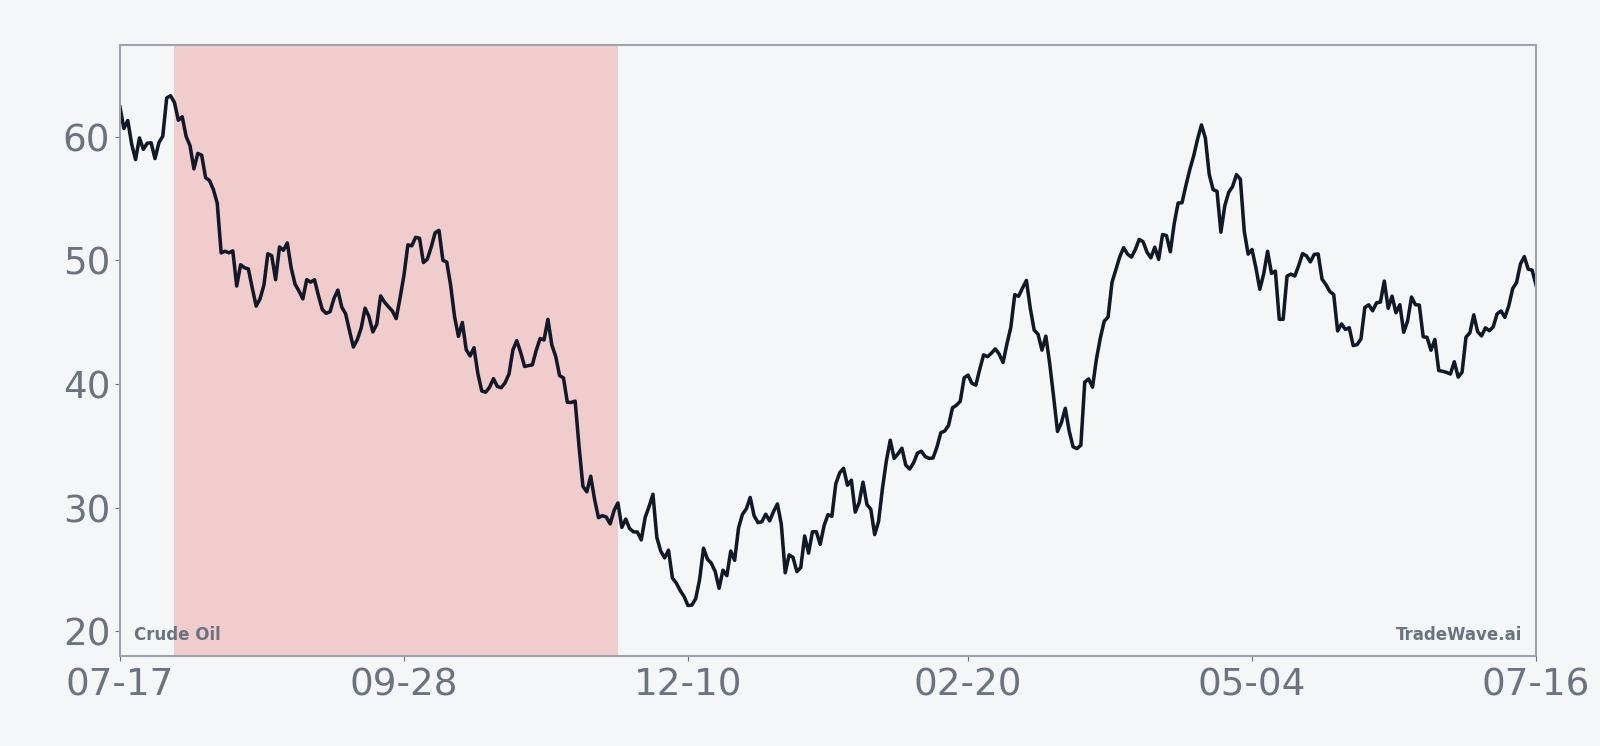
The historical seasonal trend chart suggests that much of the downside in this window has tended to build gradually rather than in a single shock. The average path shows CL often holding up early in the window before pressure increases later in the period, which aligns with past episodes where macro or policy catalysts emerged deeper into the fall.
A closer look at yearly net returns alongside best and worst intraperiod moves shows how often CL has swung hard before settling lower.
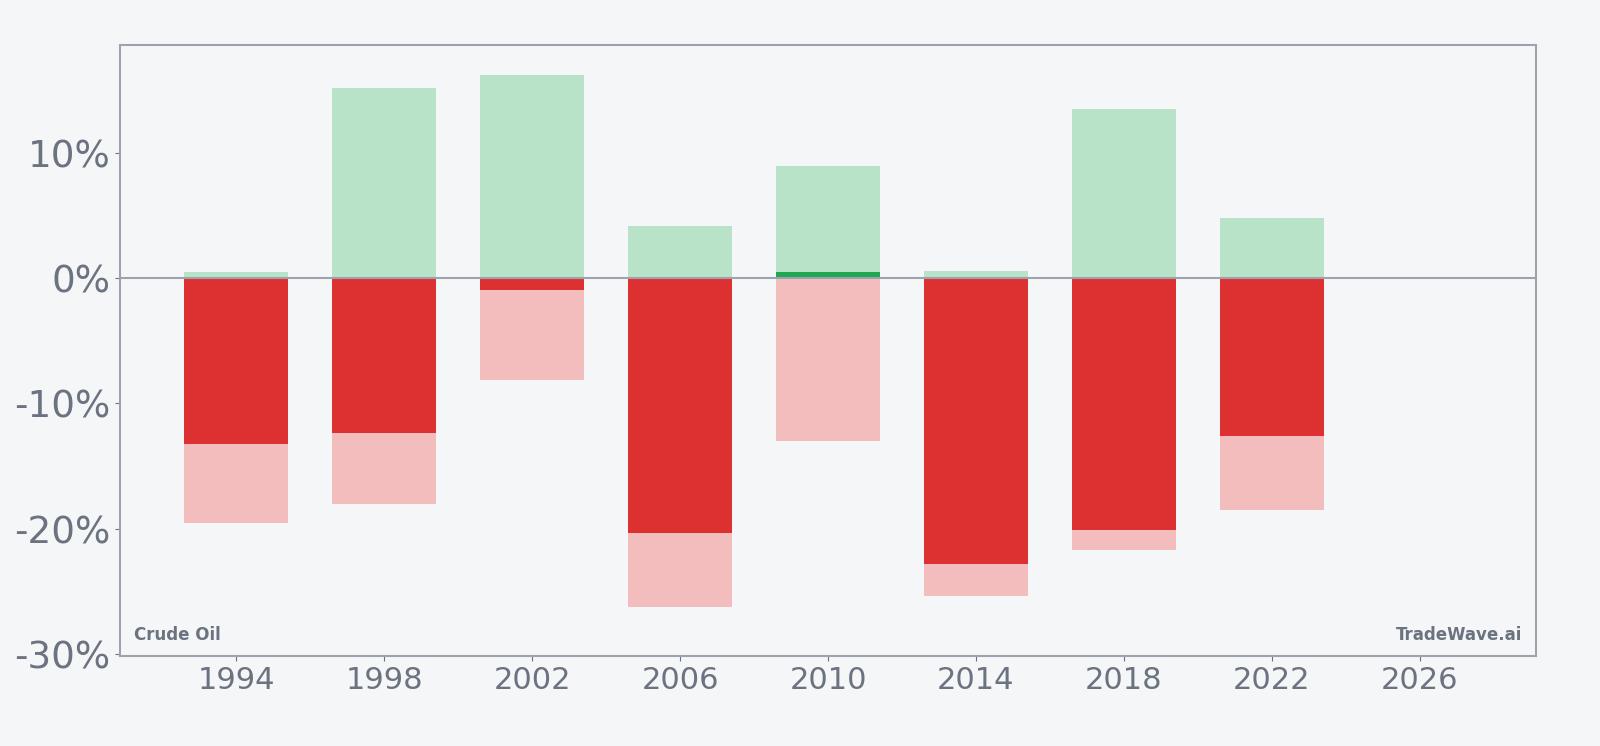
The stacked net, maximum favorable excursion, and maximum adverse excursion bars make the volatility profile clear: even in strong winning years for the short, CL has often staged double-digit rallies inside the window before rolling over, while losing years show sharp squeezes that punished shorts. The TradeWave Ratio of 2.91 captures how far price has typically traveled in the trade direction within the window, independent of the final close, reinforcing that this is a period where moves tend to be extended once they get going.
History does not guarantee future results; adverse excursions (MAE) can be large even in winning windows.
Why does Crude Oil (CL) follow this seasonal pattern?
This midterm-year Crude Oil seasonal pattern may reflect a mix of commodity supply and demand seasonality and the policy calendar. One likely driver is that late summer and autumn often bring clarity on OPEC production plans, sanctions policy, and global growth, which can trigger repricing after earlier-year optimism. Analysts have also pointed to demand softness after the peak driving season and to mid-cycle fiscal and regulatory shifts that can weigh on energy prices in the back half of the midterm election year.
What is driving Crude Oil (CL) today?
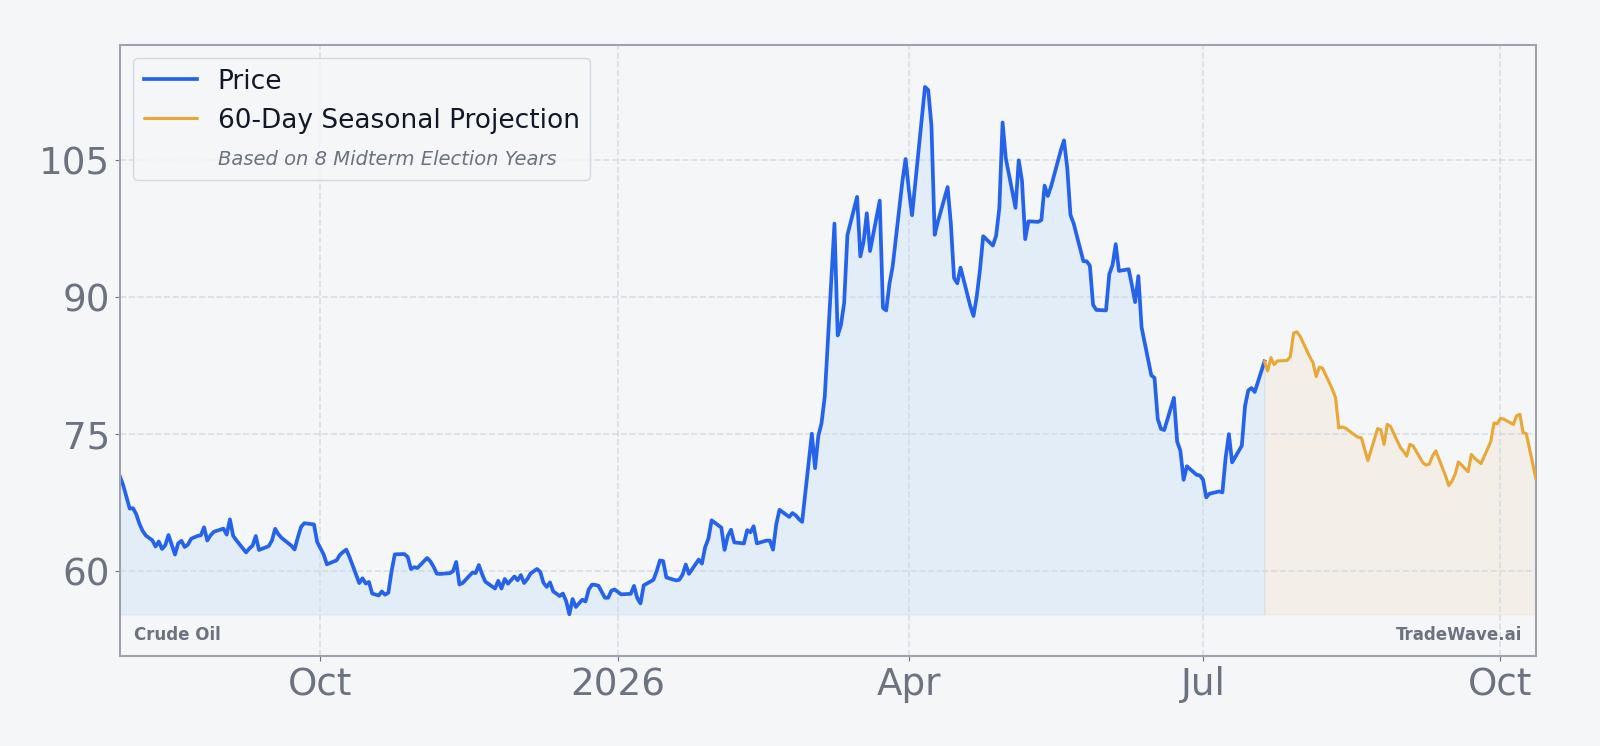
Crude Oil futures settled the prior session at $74.42 per barrel, down about 0.5% on the day, leaving the contract roughly 37.7% below its 52-week high of $119.48 and still comfortably above the 52-week low near $54.98. The one-month return sits at -21.8%, a sharp pullback that has dragged prices below the 50-day moving average around $88.33 and comes against a backdrop of shifting views on supply gluts and geopolitical risk.
In early 2026, some analysts framed the market as stuck between a supply overhang and intermittent geopolitical scares. On Jan 2, 2026, a Wall Street Journal report highlighted commentary from Phillip Nova pointing to a likely $55 to $65 per barrel range in the first quarter, citing a dominant supply-demand imbalance that kept prices capped absent a demand revival.[2] By late March 2026, another article described WTI futures trading above $100 in weekend markets as traders reacted to Middle East tensions and the risk of disruptions around the Strait of Hormuz, underscoring how quickly the narrative can flip from glut to scarcity when shipping lanes look vulnerable.[1]
Those earlier episodes show how CL can swing from fears of demand destruction to panic over supply shortages in a matter of weeks. In Nov 2025, for example, JPMorgan analysts warned that Brent could fall into the $30s by 2027 without substantial production cuts, even as they projected an average of $57 per barrel that year, a reminder that long-term forecasts can sit far below spot when the market is tight.[3] For traders heading into the new seasonal window, the key question is whether the current mid-$70s level reflects a stable compromise between those forces or just a pause before the next policy or geopolitical shock.
The chart below situates the latest move in its recent multi-month context and overlays a short-term seasonal projection.
What should traders watch as this Crude Oil seasonal window approaches?
First, the calendar: the 115-day window begins on Jul 31, 2026 and runs deep into the autumn, overlapping the back half of the midterm election year and the early transition toward the year before the presidential election. Historically, that has been a period when policy headlines around sanctions, strategic reserves, and OPEC coordination have clustered, often coinciding with the downside bias seen in the CL seasonal trend.
Second, price levels: traders will be watching whether CL can reclaim the 50-day moving average near $88 or whether rallies stall in the low $80s. A failure to sustain moves back above that band as the window opens would be more consistent with prior midterm-year patterns that saw strength fade before deeper declines. Conversely, a decisive break higher that holds through the first half of the window would look more like the lone losing year in the sample, when shorts were squeezed.
Third, macro catalysts: any renewed escalation in the Middle East, especially scenarios that threaten shipping through the Strait of Hormuz, could overwhelm the historical pattern by injecting a supply shock into the window.[1] On the other side, signs that producers are slow to cut output or that demand is softening into year-end, similar to the supply-glut concerns flagged in early 2026, would align more closely with the historical tendency for CL to drift or break lower in this stretch.[2]
Finally, volatility itself is a signal. The historical record shows that even winning short years often featured double-digit rallies before rolling over, so traders will be monitoring whether intraperiod spikes look like squeezes within a broader downtrend or the start of a regime change. If CL repeatedly fails at resistance and resumes lower within the window, that behavior would echo the 7-for-8 track record of this midterm-year pattern. If instead the market shrugs off drawdowns and grinds higher, it would be an early sign that this cycle may be breaking from the usual script.
Sources
About this seasonal analysis
Seasonal pattern data is sourced from TradeWave.ai, which analyzes historical price behavior across annual calendar windows going back up to 30 years. Read the full data methodology or the book The 100-Year Pattern by Afshin Moshrefi (2026 edition). Past performance of seasonal patterns does not guarantee future results. This article is for informational purposes only and does not constitute investment advice.