This Aug 7-14 Window Has Delivered 5% Average Short Profits in Lean Hogs (HE) Over 15 Years
Lean Hogs futures sit closer to the bottom of their 52-week range just as an Aug 7–14 window that has often leaned lower over the past 15 years comes back into focus.
Price as of Aug 5, 2026: $83.08 (last close).
What is the seasonal pattern for Lean Hogs (HE)?
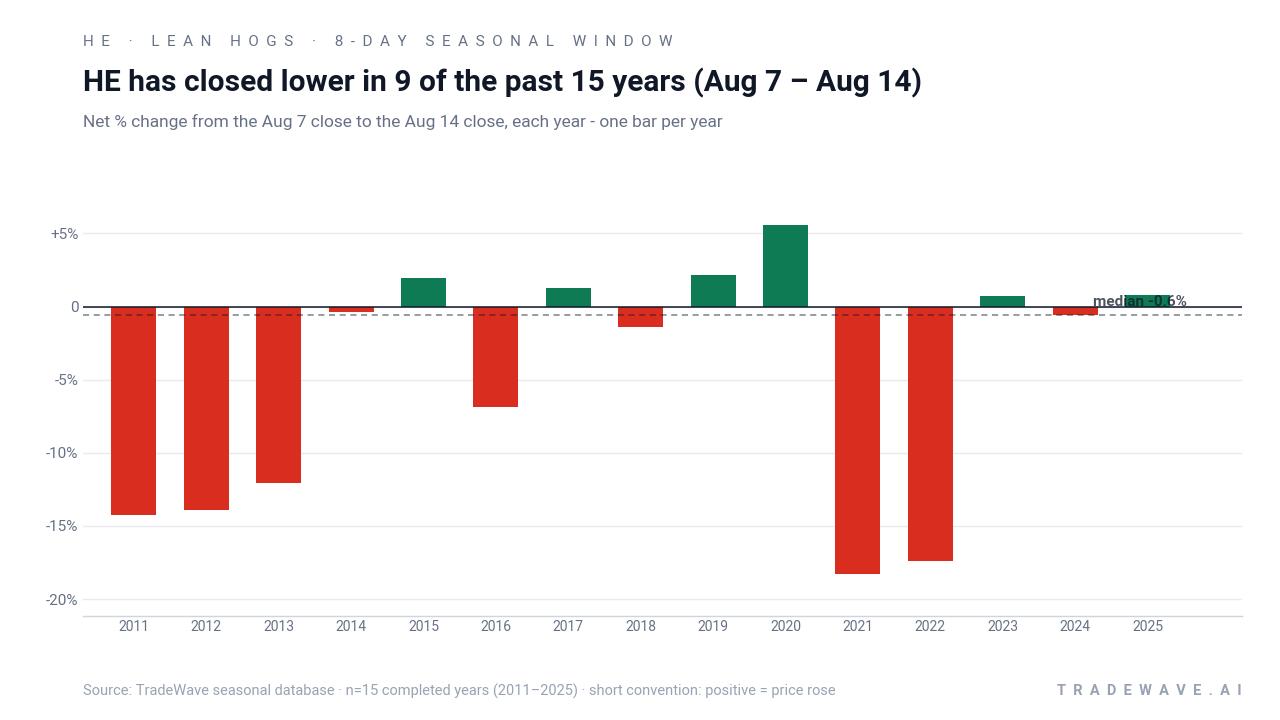
Lean Hogs has fallen in 9 of the past 15 years during the Aug 7–14 window, with an average 9.45% gain in winning years for the short-side pattern.
- 9 for 15 in this window on the short side, with winning years averaging 9.45% moves in the trade direction.
- The Aug 7–14 Lean Hogs trading window has a 60% Percent Profitable record for shorts, with 9 winners and 6 losers across 15 years.
- Including all years, the pattern’s Avg Profit - All is 5%, showing that losing years have been smaller than the strongest downside stretches.
- The historical seasonality shows several years with double-digit adverse swings, highlighting meaningful intraperiod drawdown risk even when the short pattern works.
- Stacking this eight-day August window over 15 years compounds to a 95% cumulative return for the short-side strategy.
- Traders watching HE seasonal trend behavior should treat this as a historically weak and often volatile slice of the calendar rather than a quiet summer lull.
According to historical data from TradeWave.ai, this early August stretch in Lean Hogs has behaved differently from an average summer week, with a clear short-side bias that shows up repeatedly in the long-term record.
How has Lean Hogs (HE) traded in the Aug 7–14 seasonal window?
From Aug 7 through Aug 14, Lean Hogs has historically been a soft spot, with the short-side pattern profitable in 9 of the past 15 years and a 5% average move when you include every year in the sample. The next iteration of that eight-day window begins on Aug 7, 2026, with front-month futures recently closing at 83.075, leaving the contract about 24.5% below its 52-week high of 110.025 and only modestly above the 52-week low at 77.35. For a market that can swing hard on supply headlines and currency moves, that combination of a weak price backdrop and a historically bearish August slice is a setup traders will not want to ignore.
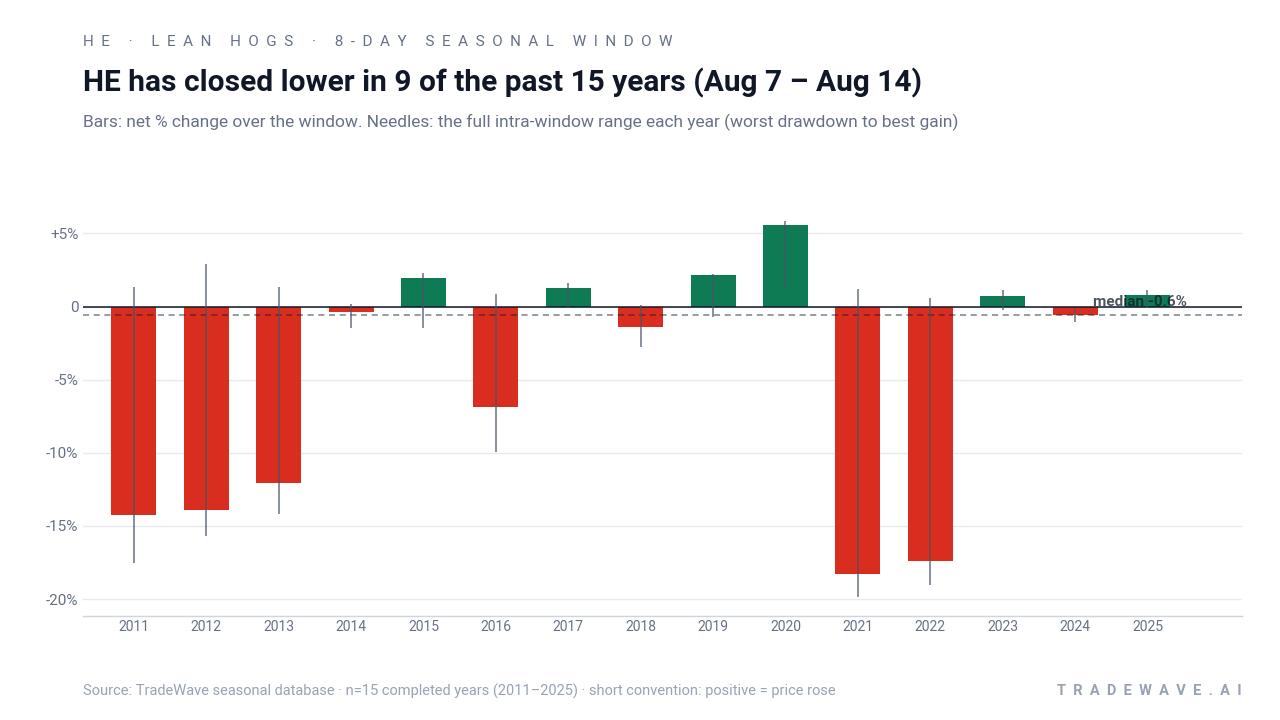
A second view combines yearly net results with the full intraperiod range, capturing both best rallies and worst drawdowns inside the window.
The trade direction for this pattern is explicitly short, so years where Lean Hogs fell over the window count as winners and rallies count as losers. With 60% of years finishing in the short’s favor and a 9.45% average move in those winning years, the historical seasonality has rewarded traders who positioned for weakness more often than not. When every year is included, the 5% Avg Profit - All shows that the losing years have tended to be smaller in magnitude than the best downside stretches, which is why the cumulative return over 15 cycles still stacks up to 95%.
The intraperiod behavior is not gentle. The bars-and-needles chart highlights years like 2021 and 2022, where the worst drawdowns for shorts reached roughly 20% even as the net result over the eight days ultimately favored the trade direction. That is the MAE profile in action: the worst adverse excursion from entry has often been large, meaning shorts have had to sit through sharp squeezes before the pattern reasserted itself. On the flip side, the best favorable excursions, or MFE, show that when the window breaks lower, it can do so quickly and with size.
Looking at individual years underscores the range of outcomes. In 2016, the pattern delivered a strong short-side win with a net return of about 6.86% and a worst drawdown near 9.96% from entry, a reminder that even “good” years have not been smooth. In contrast, 2017 and 2019 were modest losing years for the short, with small positive net returns for Lean Hogs and very limited adverse moves, showing that the window can occasionally pass without fireworks.
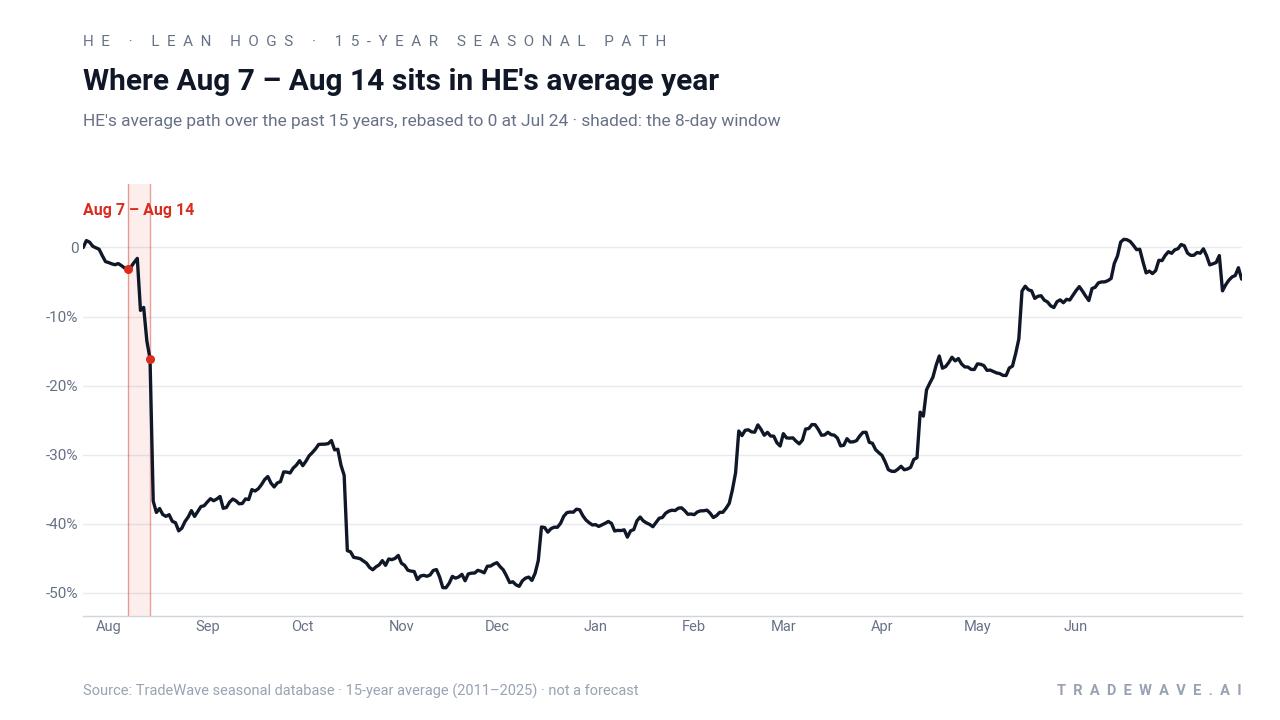
Trend statistics around the window also lean toward weakness. The pattern’s Trend Short reading of 79 versus a Trend Long reading of 4 suggests that in the broader context around Aug 7–14, down days have dominated up days in the historical sample. That aligns with the visual seasonal trend chart, where the shaded window sits in a sagging section of the average year rather than in a recovery phase.
Add it up and the message is straightforward. This is not a perfect pattern, but over 15 years the Aug 7–14 window has more often rewarded traders positioned for Lean Hogs to soften, and the strongest years have been strong enough to outweigh the occasional countertrend pop.
History does not guarantee future results; adverse excursions (MAE) can be large even in winning windows, and traders can face sharp squeezes before any seasonal tendency plays out.
Why does Lean Hogs (HE) follow this seasonal pattern?
This early August weakness in Lean Hogs likely reflects commodity supply and demand seasonality more than technical quirks. One likely driver is the flow of information around summer hog weights, slaughter schedules, and export demand, which can shift packer margins and prompt hedging activity in this narrow window. Analysts also point to currency moves and feed-cost dynamics around mid-summer that can change producer behavior, creating a recurring pocket of pressure in the futures curve.
What is driving Lean Hogs (HE) today?
Lean Hogs front-month futures last settled at 83.075, leaving the contract well below its 50-day moving average of 93.438 and roughly 7.4% above the 52-week low at 77.35. The one-month return sits at about -9.74%, a reminder that the market has already been under pressure into this seasonal window rather than rallying into it. Volume over the past 20 sessions has averaged 16,201 contracts, with the latest session at 21,958, suggesting participation has picked up as prices probe the lower end of the recent range.
The chart below situates the latest move in its recent multi-month context alongside the median 15-year seasonal path.
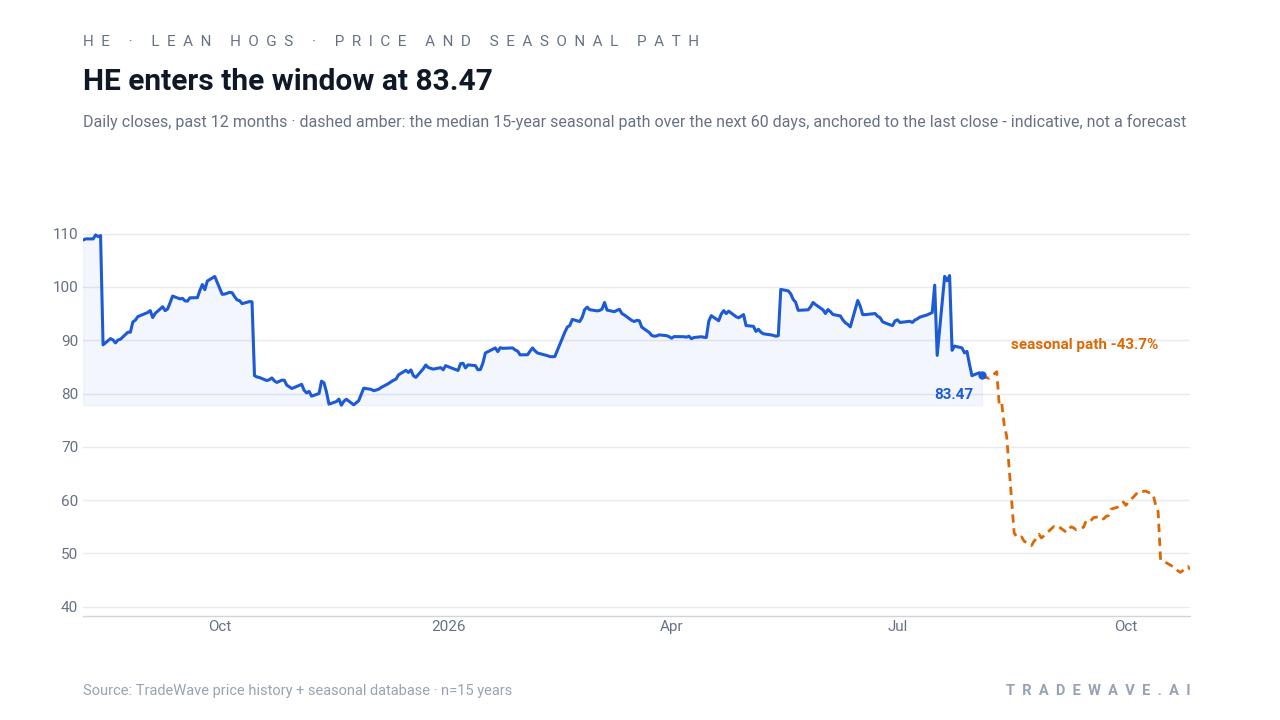
Macro drivers around this contract remain the usual mix of protein demand, feed costs, and currency moves, but the key near-term story is positioning into a historically weak slice of the calendar. With prices already under pressure and the seasonal pattern pointing to a window that has often favored additional downside, traders in the hog complex will be watching closely to see whether this year follows the historical script or breaks it.
What should traders watch in the upcoming Lean Hogs window?
For the Aug 7–14 Lean Hogs seasonal window, the first thing to watch is how the contract behaves around the 80–85 band that has defined the lower part of the recent range. A decisive break below the 52-week low at 77.35 during the window would be consistent with the historical short-side bias, especially if it comes on rising volume. Conversely, a firm bounce back toward the 50-day moving average near 93.438 would mark this as one of the pattern’s losing years for shorts and signal that current supply and demand forces are overpowering the usual August softness.
Second, monitor intraday volatility and the size of swings relative to the eight-day history. Years like 2016, 2021, and 2022 show that the maximum adverse excursion for shorts can be large even when the final result favors the pattern, so sharp rallies inside the window do not automatically invalidate the historical tendency. What matters is where Lean Hogs closes on or around Aug 14 and whether the contract spends more time pressing lows or testing resistance.
Finally, keep an eye on fundamental headlines around slaughter numbers, export sales, and feed costs, which often cluster in mid-summer and can amplify or mute the seasonal effect. If those catalysts line up with the historical pattern, the Aug 7–14 stretch can deliver outsized moves in a short span. If they cut the other way, this could be one of the years where the seasonal script gets rewritten.
Sources
About this seasonal analysis
Seasonal pattern data is sourced from TradeWave.ai, which analyzes historical price behavior across annual calendar windows going back up to 30 years. Read the full data methodology or the book The 100-Year Pattern by Afshin Moshrefi (2026 edition). Past performance of seasonal patterns does not guarantee future results. This article is for informational purposes only and does not constitute investment advice.