Natural Gas (CME) (NG) 8-for-8 Midterm Late-August Slide Has Averaged 5.07% Short Profits
Natural Gas (CME) is hovering near the bottom of its recent range just as it approaches a midterm‑year late‑August window that has historically leaned sharply lower, raising the stakes for traders into early September.
Price as of Aug 6, 2026: $2.67 (intraday).
What is the seasonal pattern for Natural Gas (CME) (NG)?
Natural Gas (CME) has fallen in 8 of 8 midterm‑year late‑August windows during this 16‑day stretch, with an average 5.07% gain for short positions in winning years.
- 8 for 8 in this window, with short trades averaging 5.07% profit across the last eight midterm election years.
- The 16‑day Natural Gas (CME) trading window runs from Aug 19 to Sep 3 in the midterm election year.
- Percent Profitable is 100%, with 8 winners and 0 losers for the short seasonal setup.
- Average profit of 5.07% reflects consistent downside closes for NG during this late‑August seasonal pattern.
- Intraperiod swings have been wide, with both strong favorable moves for shorts and notable adverse bounces before the window closes.
- The pattern aligns with the midterm‑year phase of the presidential election cycle, when policy and demand uncertainty often keep gas markets volatile.
According to historical data from TradeWave.ai, this late‑August stretch in midterm election years has behaved very differently from an average month on the natural gas calendar, and the next iteration is less than two weeks away.
How has Natural Gas (CME) (NG) traded in the upcoming late‑August window?
Natural Gas (CME) has closed lower in every single late‑August window across the last eight midterm election years, with short positions averaging a 5.07% gain over the 16‑day stretch. The next window runs from Aug 19 to Sep 3, with front‑month NG futures last trading at 2.673, far below the 52‑week high of 7.827 and only about 7.6% above the 52‑week low of 2.483. That combination of a historically bearish seasonal pattern and a contract already pinned near the bottom of its one‑year range gives this year’s setup an unusually asymmetric feel for energy traders.
Grouping the data by the presidential election cycle matters here because this pattern only looks at the last eight midterm election years, a phase that often brings shifting policy expectations, budget debates and regulatory noise that can ripple through energy demand and hedging behavior. In this framework, 2026 is the midterm election year, and this August 19 to September 3 slice captures how NG has tended to behave at this exact point in prior midterm cycles rather than in generic calendar years.
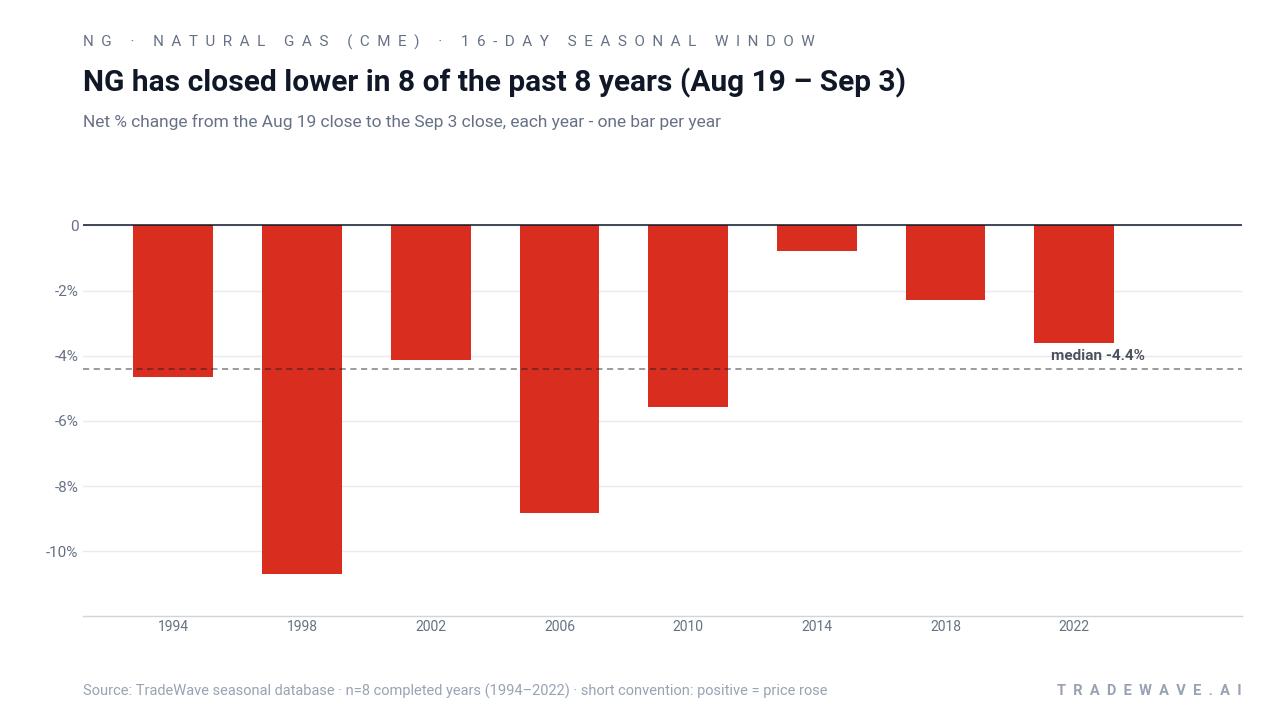
Across the eight completed midterm‑year samples from 1994 through 2022, every single iteration of this Natural Gas (CME) trading window finished with prices below the Aug 19 entry level, consistent with the short trade direction. The strongest year for shorts was 1998, when NG fell 10.69% from entry to exit, while the softest outcome was 2014, which still delivered a 0.77% decline into early September. Average profit of 5.07% and a Sharpe ratio of 1.49 point to a pattern that has been both directional and relatively efficient on a risk‑adjusted basis for traders positioned with the seasonal trend.
Intraperiod behavior has been choppy rather than straight‑line. In 2006, for example, the contract’s best point‑to‑peak move within the window was a 13.83% rally against shorts before ultimately closing 8.83% lower, while the worst drawdown from entry reached 13.8% at one point. In 2002, the maximum favorable move for shorts was 11.51% even though the final net decline was a more modest 4.13%. That mix of large maximum favorable excursion and sizable maximum adverse excursion shows that this window has historically offered both opportunity and stress for anyone trading it too tightly.
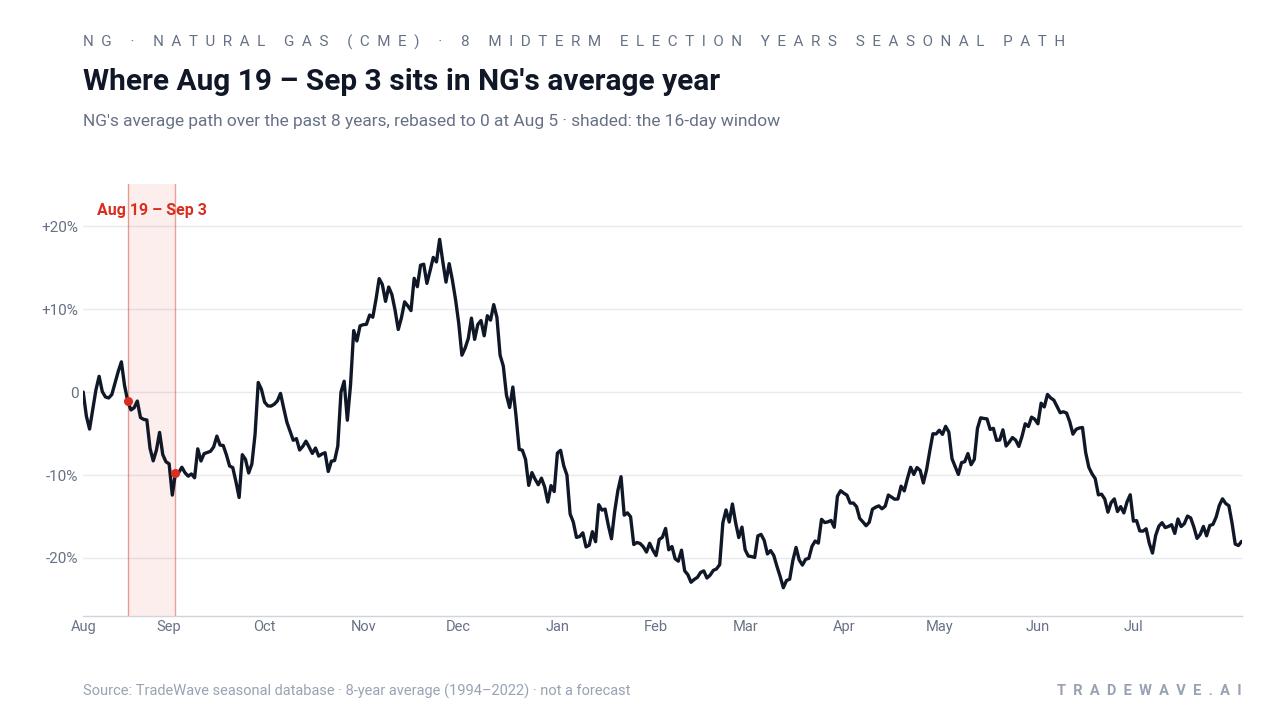
A second view of yearly ranges highlights how far NG has tended to swing inside this 16‑day stretch.
The cumulative chart of this window compounds to a 48% gain for the short side across the eight midterm‑year samples, underscoring how repeatedly stacking the same 16‑day pattern has added up over time. Add it up: eight straight lower closes, a 100% win rate for shorts and a TradeWave Ratio of 1.71 describe a window that has not just leaned lower, but has done so with meaningful travel in the trade direction.
History does not guarantee future results, and intraperiod adverse moves have been large in several years, so traders should respect the potential for sharp squeezes even inside a historically bearish window.
Why does Natural Gas (CME) (NG) follow this seasonal pattern?
One likely driver is commodity supply and demand seasonality, as late August often sits between peak summer cooling demand and the ramp‑up to winter heating season, a shoulder period when storage dynamics can pressure prices. Analysts have also pointed to midterm‑year policy uncertainty and shifting hedging needs for utilities and producers, which may encourage more aggressive selling into rallies during this stretch. The pattern may further reflect how speculative positioning resets after early‑summer volatility, leaving the market more vulnerable to downside drift when weather and demand headlines quiet down.
What is driving Natural Gas (CME) (NG) today?
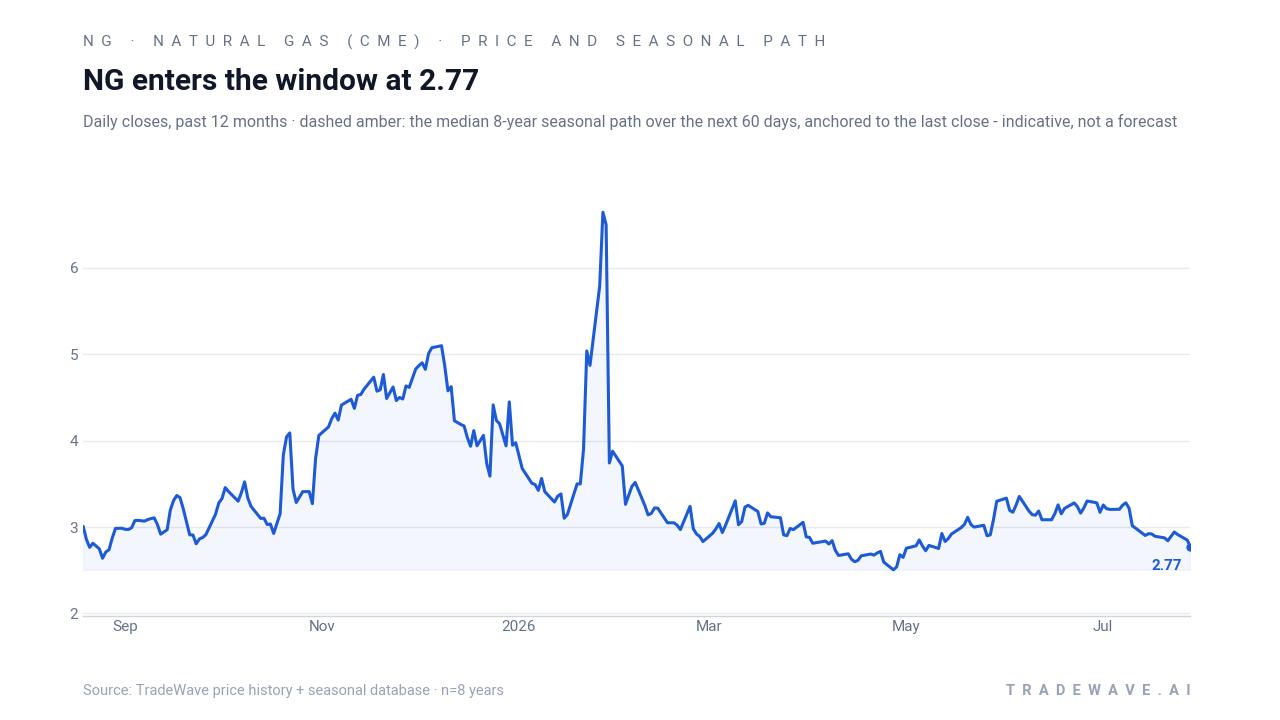
Front‑month Natural Gas (CME) futures settled at 2.673 in the prior session, up 0.11% on the day but still deeply depressed versus the 52‑week high of 7.827 and only about 7.6% above the 52‑week low of 2.483. That level also sits below the 50‑day moving average of 3.0684 and follows a 1‑month slide of 17.64%, signaling a market that has already absorbed heavy selling pressure into the heart of summer. Liquidity remains robust, with 20‑day average volume around 122,443 contracts, even as outright prices have cooled from the explosive spikes seen earlier in the year.
In early 2026, natural gas futures saw large short‑term gains and elevated volatility, with the February 2026 contract trading as high as 7.460 and posting outsized three‑month percentage moves that flagged intense speculative activity and heavy volume in the strip.[1] Those swings left a trail of scar tissue for traders and risk managers, and they help explain why the current pullback toward the low‑$2 handle is drawing close attention from both hedgers and macro funds. On Jul 13, 2026, CME expanded the listing cycle for Henry Hub average price strip spreads, increasing the number of winter, summer and European strip listings, a move designed to deepen liquidity and give commercial players more tools to manage seasonal exposure.[3]
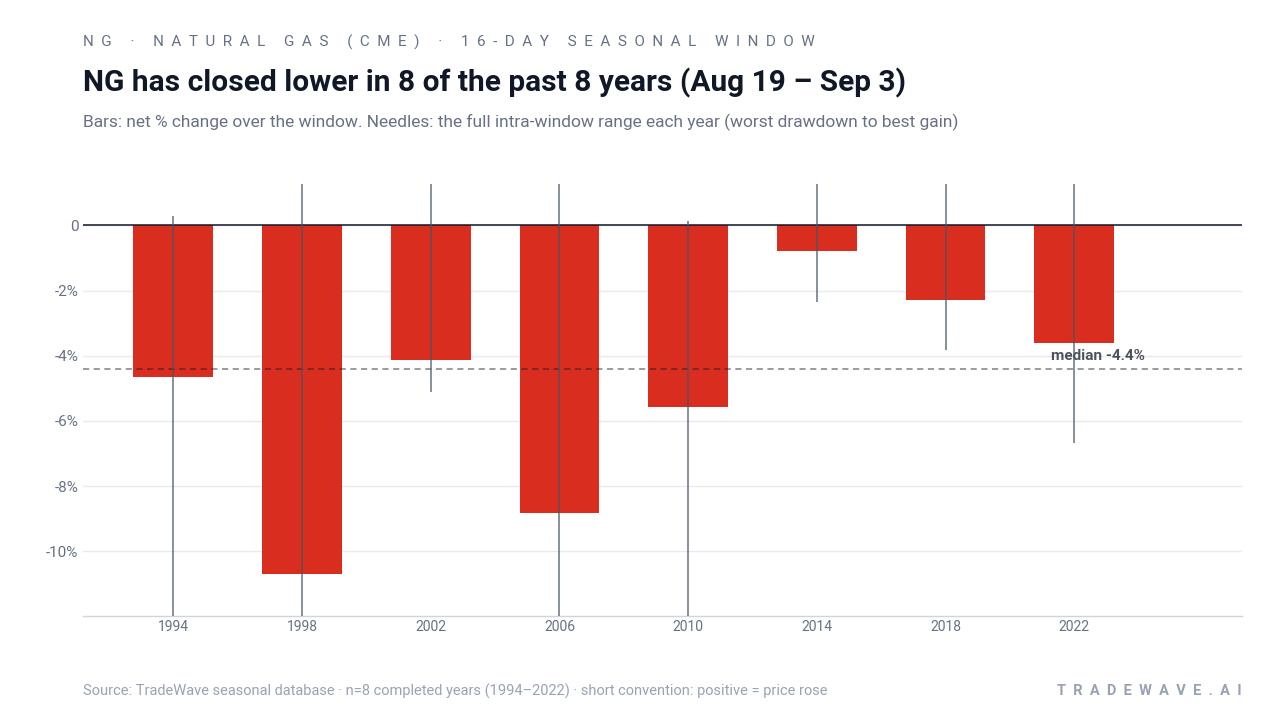
The chart below shows how that volatility has bled into a steady grind lower, alongside a 60‑day seasonal projection based on prior midterm‑year behavior.
What should traders watch as this seasonal window approaches?
First, the calendar: the 16‑day window begins on Aug 19, so price action in the next ten days will set the entry level that anchors any seasonal comparison. A bounce back toward the 50‑day moving average near 3.07 would give shorts more room to work with, while a continued slide toward the 52‑week low around 2.48 would compress the downside cushion and raise the risk of sharp squeezes if weather or supply headlines flip bullish.
Second, watch how volatility behaves relative to the early‑2026 regime. If realized swings start to resemble the large three‑month moves seen in contracts like February 2026 earlier this year, it would signal that speculative energy is rebuilding into the shoulder season, which could amplify both the favorable and adverse excursions that have historically defined this window.[1] Conversely, a quiet drift with contained intraday ranges would make the historical pattern more about slow grind than violent reversals.
Third, policy and macro headlines tied to the midterm election year will matter at the margin. Budget negotiations, regulatory signals around LNG exports and any shifts in utility hedging behavior can all influence how closely this year tracks the prior eight midterm‑year samples. If NG sells off into the window and continues to close lower through early September, it would mark a ninth straight win for the short seasonal pattern. A sustained rally that holds above the Aug 19 entry level, especially if driven by renewed volatility and strong demand signals, would be the clearest sign that this midterm‑year playbook is finally breaking.
Sources
- Barchart.com, "Natural Gas Feb '26 Futures Price - Barchart.com" (Jan 28, 2026).
- Barchart.com, "Natural Gas Feb '26 Futures Contract Specifications - Barchart.com".
- CME Group, "CME Globex Notice: July 13, 2026 - CME Group" (Jul 16, 2026).
- Barchart.com, "Natural Gas Mar '26 Futures Price - Barchart.com" (Feb 25, 2026).
About this seasonal analysis
Seasonal pattern data is sourced from TradeWave.ai, which analyzes historical price behavior across annual calendar windows going back up to 30 years. Read the full data methodology or the book The 100-Year Pattern by Afshin Moshrefi (2026 edition). Past performance of seasonal patterns does not guarantee future results. This article is for informational purposes only and does not constitute investment advice.