8-for-8 Midterm Slide: Natural Gas (CME) (NG) Has Dropped Every Aug 19-Sep 3 Window
Natural Gas (CME) is trading around $2.79 and down double digits year to date as it moves through a midterm-year late-August window that has historically favored short positions and sharp swings.
Price as of Aug 20, 2026: $2.79 (intraday).

What is the seasonal pattern for Natural Gas (CME) (NG)?
Natural Gas (CME) has fallen in 8 of 8 midterm-year Aug 19–Sep 3 windows, with an average 5.07% gain for short positions in winning years.
- 8 for 8 in this window, with short trades averaging 5.07% profit across the last eight midterm election years.
- The current 16-day Natural Gas (CME) trading window runs from Aug 19 to Sep 3 and has historically favored downside moves.
- Percent Profitable is 100%, with 8 winners and 0 losers for the short-side pattern in this late-August stretch.
- Average winner profit of 5.07% stacks to a 48% cumulative gain when the window is repeated across all eight cycles.
- The TradeWave Ratio of 1.71 signals that price typically travels meaningfully in the trade direction within the window, even before final settlement.
- Intraperiod swings have been wide, with both strong favorable moves and notable drawdowns showing this is a high-volatility seasonal window rather than a gentle drift.
According to historical data from TradeWave.ai, this late-August slice of the calendar has behaved very differently from an average month for Natural Gas (CME), and the current midterm election year keeps that pattern in play.
How has Natural Gas (CME) (NG) traded in the late-August midterm-year window?
Natural Gas (CME) has closed lower in every single Aug 19–Sep 3 window across the last eight midterm election years, a clean 8-for-8 record for short positions. The current window is already underway, with front-month futures around $2.789 and the contract still down about 12% year to date as traders weigh shoulder-season demand and storage dynamics.
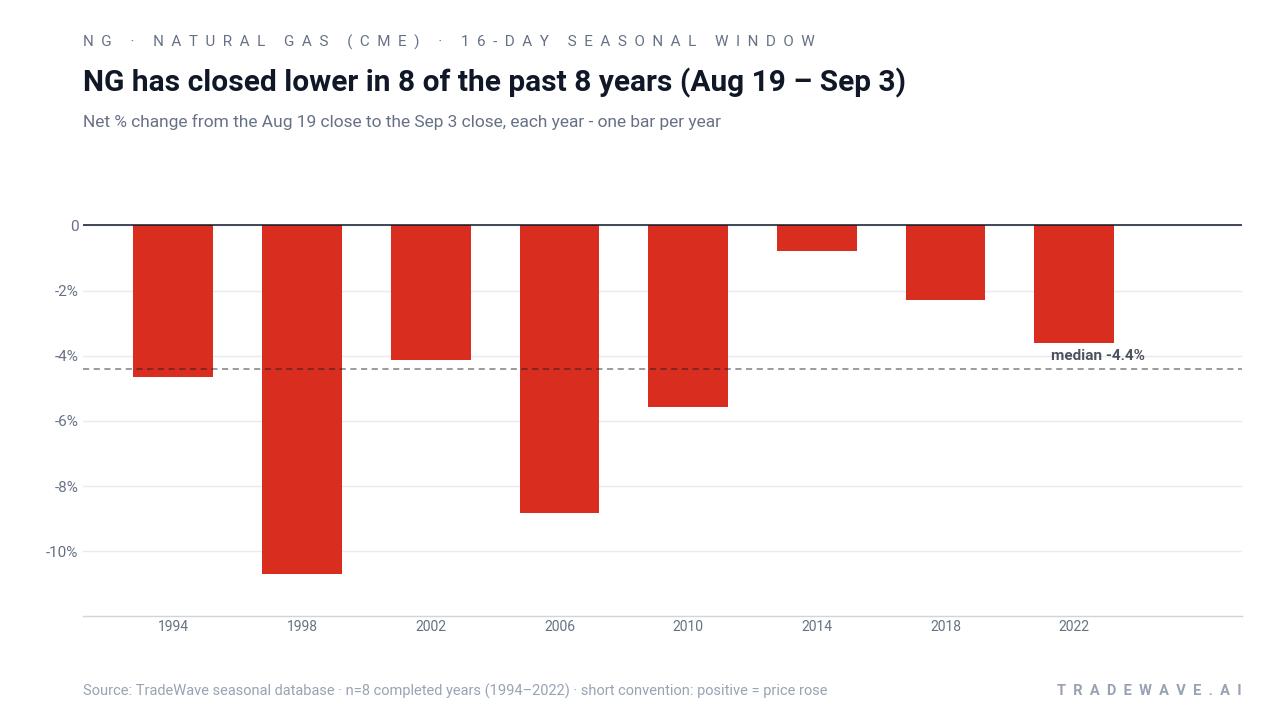
The pattern is grouped by the presidential election cycle, focusing only on the last eight midterm election years rather than every calendar year. That matters for energy because midterm years often coincide with shifting policy debates on drilling, LNG export approvals and environmental rules, which can alter hedging behavior and speculative flows in natural gas futures even before winter demand hits.
Across those eight midterm-year samples from 1994 through 2022, every Aug 19–Sep 3 window delivered a negative close-to-close return for the underlying contract, which translates into a positive outcome for the short-side seasonal strategy. Average profit for winning shorts was 5.07%, with a median of 4.39%, and the compounded effect of repeating the window across all eight cycles adds up to a 48% cumulative gain. The Sharpe ratio of 1.49 for this slice of the calendar is unusually high for a commodity contract, reflecting both the consistency of the direction and the size of the moves.
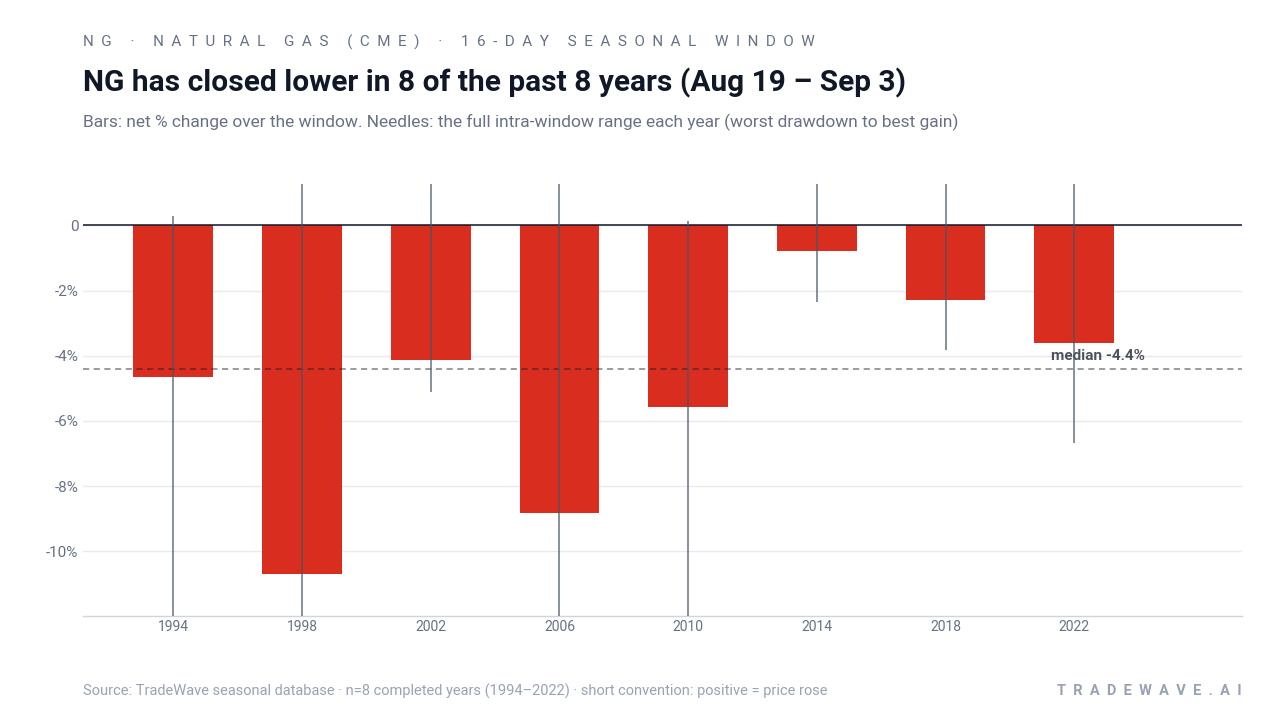
Intraperiod behavior has been anything but quiet. Maximum favorable excursions, the best point-to-peak move in the trade direction within each window, ranged from 0.14% in 2010 to 13.83% in 2006, showing that some years delivered deep, fast drops after entry. On the other side, maximum adverse excursions, the worst drawdowns from entry, stretched as far as 16.01% in 1998 and 13.8% in 2006, underscoring that even winning short windows have seen sharp squeezes before settling lower.
Individual years tell the story. In 1998, the contract fell 10.69% from entry to exit for shorts, but not before a 4.33% intraperiod rally that would have pressured anyone leaning into the seasonal pattern early. In 2002, the net short-side gain was a more modest 4.13%, yet the best intraperiod move in the trade direction reached 11.51%, suggesting that traders who managed risk intraday or scaled out had multiple chances to lock in larger profits than the final close shows.
The TradeWave Ratio of 1.71 captures this tendency for price to travel meaningfully in the trade direction within the window. By definition, TradeWave Ratio (TWR) is how far price typically travels in the trade direction within the window, independent of the final close. For Natural Gas (CME) in this late-August stretch, that means the contract has usually offered more intraperiod movement than the simple entry-to-exit change implies, which is consistent with the contract’s reputation for violent shoulder-season swings.
A second view that layers net returns with full intraperiod ranges shows how often sharp rallies and deep drops have coexisted inside this window.
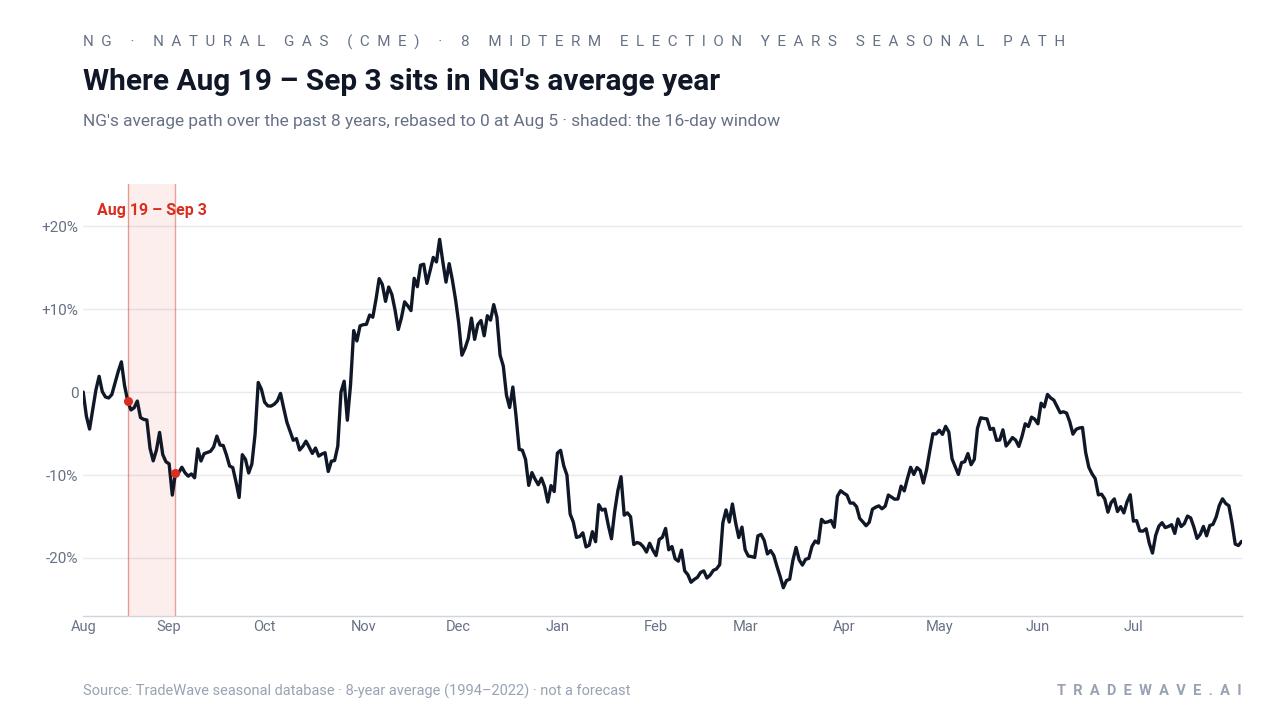
Put together, the record is striking: eight midterm election years, eight lower closes for the contract in this 16-day span, and a 48% cumulative gain for the short-side pattern. History does not guarantee a repeat, but the combination of a 100% hit rate and sizable intraperiod excursions makes this one of the cleaner seasonal tendencies on the natural gas calendar.
Why does Natural Gas (CME) (NG) follow this seasonal pattern?
One likely driver is commodity supply and demand seasonality, with late August often landing in a shoulder period between peak summer cooling demand and the ramp into winter heating season. Analysts have also pointed to storage report timing and hedging flows from utilities and producers, which can lean more defensive in midterm election years when policy and regulatory signals are in flux.[2][3] The result has often been a window where rallies struggle to hold and downside pressure dominates, even if the broader year’s trend is mixed.
History does not guarantee future results, and adverse excursions within this window have been large even in years that ultimately finished as winners for the short-side pattern.
What is driving Natural Gas (CME) (NG) today?
Front-month Natural Gas (CME) futures last traded around $2.789, edging about 0.2% higher from the prior session’s settlement and leaving the contract well below last year’s highs after a roughly 12% slide so far in 2026.[1] The move comes as the continuous contract rolls through the October 2026 delivery cycle, with standard Henry Hub specifications of 10,000 mmBtu per contract keeping it the benchmark for US gas pricing.[2]
Term-structure quotes show a relatively flat curve in the near months, with September and October 2026 both around $2.78, then a lift toward $2.965 in November and $3.52 into December as the market prices in winter risk.[1] That shape is typical for natural gas, where winter contracts often carry a premium, but the modest level of the front month underscores how comfortable traders remain with current storage and production trends.
On the structural side, CME Group’s Micro Henry Hub Natural Gas futures and options continue to broaden access, giving smaller accounts a way to express views on the NG seasonal trend with less capital and more granular sizing.[3] Those micro contracts mirror the main Henry Hub contract’s around-the-clock liquidity and standardized delivery terms, which helps keep the benchmark deep and responsive when seasonal windows like this one line up with macro catalysts.
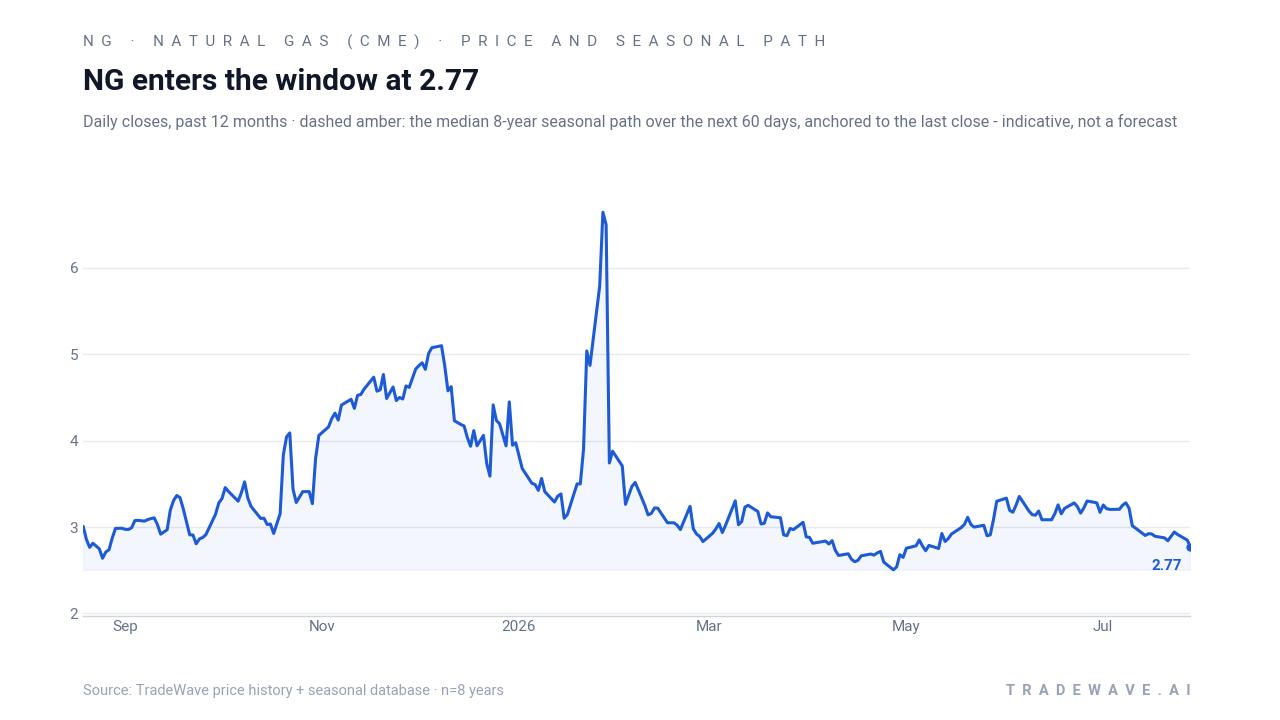
The chart below places the latest bounce in the context of the past year’s slide and the historical seasonal projection for the next two months.
What should traders watch in this late-August window?
For the remainder of the Aug 19–Sep 3 stretch, the key test is whether Natural Gas (CME) respects its historical tendency to fade rather than extend rallies. In prior midterm election years, strong intraperiod bounces often gave way to lower closes by the end of the window, so traders will be watching whether any squeeze above the recent range stalls quickly or turns into a more durable trend change.
Fundamentally, weekly US storage data and updated production and consumption figures will be critical, especially given that 2025 saw supply grow faster than demand, a backdrop that can cap upside unless weather or policy shocks intervene.[2] The curve already prices a winter premium, so a surprise on storage injections or early cold-weather forecasts could challenge the usual late-August softness.
Levels matter too. The front month’s ability to hold above the recent $2.78 area while staying below the richer winter strip will shape how aggressively hedgers and speculators lean into the NG seasonal trend. A decisive break lower during the window would line up with the 8-for-8 short-sided history, while a sustained push higher that survives intraperiod volatility would be the first clear violation of this midterm-year pattern.
Finally, watch liquidity and participation in both the standard and micro Henry Hub contracts, which can amplify moves when seasonal tendencies and macro headlines collide.[1][3] If volumes build into the end of August and early September while price action starts to mirror the historical pattern, it would reinforce the idea that election-cycle seasonality still matters for natural gas; if instead the market shrugs off the usual late-August weakness, that would be an early signal that the next pre-election year may be rewriting the script.
Sources
About this seasonal analysis
Seasonal pattern data is sourced from TradeWave.ai, which analyzes historical price behavior across annual calendar windows going back up to 30 years. Read the full data methodology or the book The 100-Year Pattern by Afshin Moshrefi (2026 edition). Past performance of seasonal patterns does not guarantee future results. This article is for informational purposes only and does not constitute investment advice.