Softer US CPI Lifts Gold (COMEX) (GC) as a Historically Bullish Midterm Fall Run Approaches
Gold (COMEX) is trading well below its 52-week high as it heads toward a mid-September seasonal window that has quietly delivered gains in every midterm election year since 2002.
Price as of Aug 18, 2026: $4,453.50 (intraday).

What is the seasonal pattern for Gold (COMEX) (GC)?
Gold (COMEX) has risen in 6 of 6 midterm election years during the Sep 12 to Jan 16 window, with an average gain of 8.31% in winning years.
- 6 for 6 in this window, averaging 8.31% gains in winning years across the last six midterm election cycles.
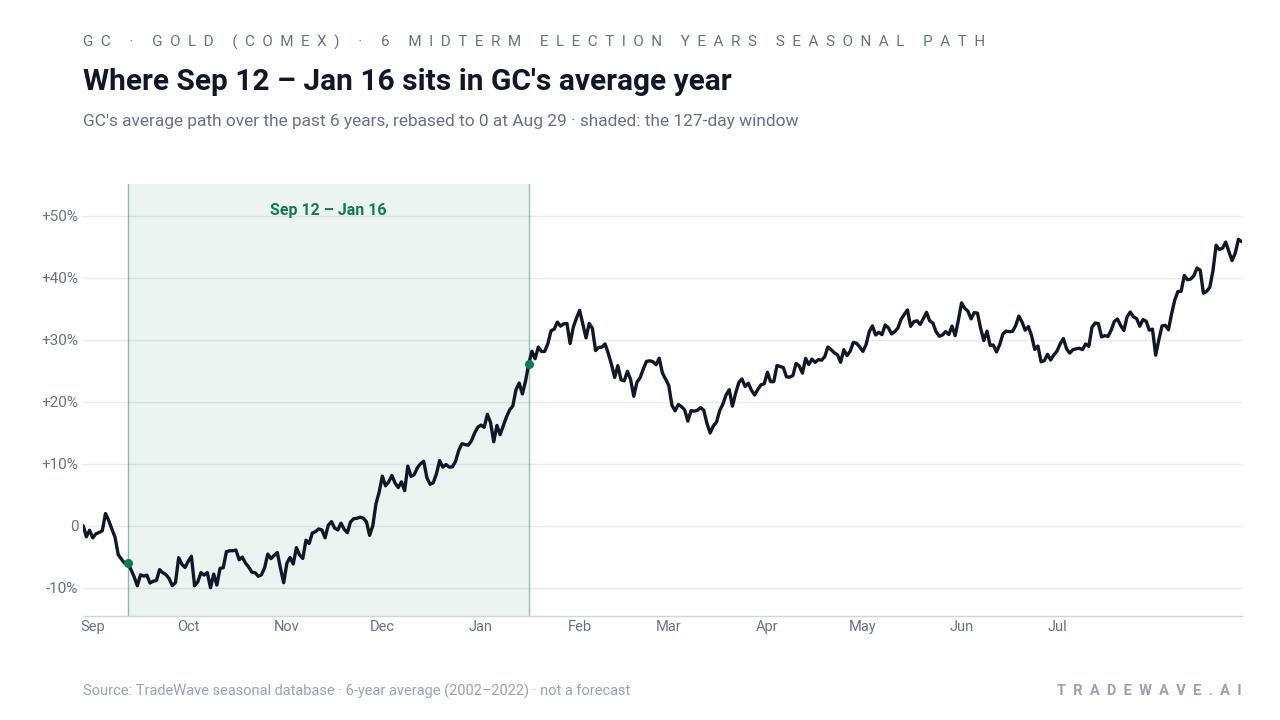
- Seasonal window runs from Sep 12 through Jan 16, spanning 127 calendar days in the midterm election year.
- Percent Profitable is 100%, with 6 winners and 0 losers in the historical sample.
- Avg Profit of 8.31% compares with a cumulative return of 61% when stacking the window across all six years.
- TradeWave Ratio of 2.28 suggests price has typically traveled meaningfully in the long direction within the window.
- Sharpe ratio of 2.27 points to a historically favorable risk-adjusted profile for long exposure in this specific GC seasonal trend.
According to historical data from TradeWave.ai, this midterm-year autumn stretch in Gold (COMEX) has behaved very differently from an average slice of the calendar. The next section looks at how that pattern has played out and what it implies for the upcoming Sep 12 start date.
How has Gold (COMEX) (GC) traded in past midterm-year fall windows?
Gold (COMEX) has risen in 6 of 6 midterm election years during the Sep 12 to Jan 16 window, averaging 8.31% gains and never posting a loss across the sample. Today the front-month GC contract settled at 4,453.5, leaving it about 20.3% below its 52-week high of 5,586.2 and well above the 52-week low of 3,382.0. That combination of a strong historical seasonal pattern and a pullback from the highs gives this year’s window extra weight for traders watching the Gold (COMEX) trading window into year-end.
This pattern is grouped by the presidential election cycle, focusing on the last six midterm election years rather than consecutive calendar years. That matters because midterm years often bring shifting expectations around fiscal policy, regulation and central bank reaction functions, which can change how safe-haven assets like gold trade relative to other years in the cycle.
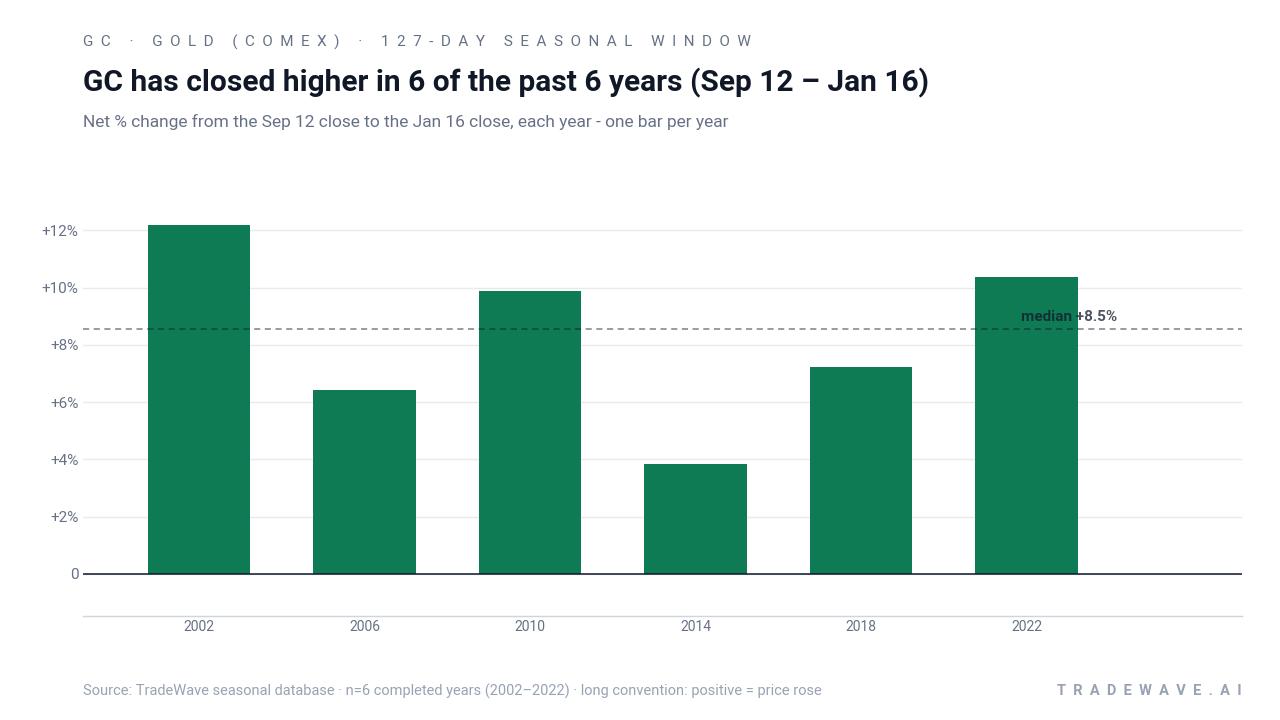
Across the six midterm-year samples from 2002 through 2022, the strongest year in this GC seasonal trend was 2002, when the contract gained 12.17% between the Sep 12 entry and the Jan 16 exit. The softest outcome was 2014, which still delivered a 3.82% gain despite a deeper intraperiod drawdown. That consistency is what pushes the Percent Profitable metric to 100% and keeps the standard deviation of outcomes at a relatively contained 3.05%.
Intraperiod swings have still mattered. In 2010, Gold (COMEX) never traded below its entry level during the window, with the worst drawdown effectively flat and a maximum favorable move of 14.94% before settling with a 9.88% net gain. By contrast, 2014 saw a worst drawdown of 7.88% below the entry before recovering into positive territory by the end of the window. The pattern has favored longs, but it has not been a straight line.
A second view combines yearly net results with the full intraperiod range of gains and drawdowns.
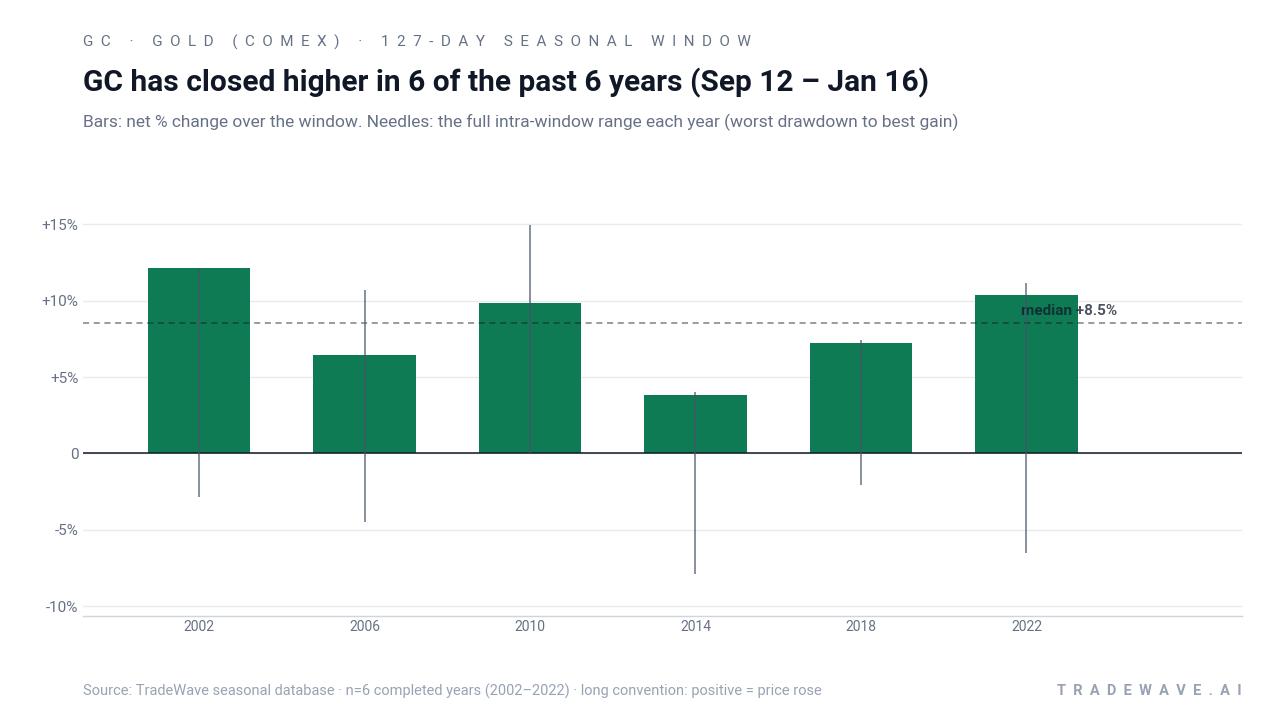
Put together, the record is striking: six for six, with average gains north of 8% and a cumulative 61% return if an investor had only been long during this specific Sep 12 to Jan 16 window in each midterm election year. History does not guarantee a repeat, but this is one of the cleaner bullish seasonal stretches on the GC calendar.
Why does Gold (COMEX) (GC) follow this seasonal pattern?
One likely driver is the way midterm election years cluster policy uncertainty, central bank signaling and year-end portfolio rebalancing into the same part of the calendar. Analysts often point to a mix of Fed communication, fiscal debates and geopolitical risk that tends to build into autumn and keep safe-haven demand for gold elevated into the new year.[3] This pattern may also reflect institutional positioning as funds rebalance around year-end while managing inflation and rate expectations, which can amplify moves in a relatively tight Gold (COMEX) seasonal window.
History does not guarantee future results, and even in winning windows the worst intraperiod drawdowns (MAE) have reached as much as 7.88% below the entry level in past years.
What is driving Gold (COMEX) (GC) today?
Gold (COMEX) futures ended the prior session at 4,453.5, down 0.44% on the day, after trading between 4,450.0 and 4,493.1. The contract is still up 11.54% over the past month, trading above its 50-day moving average of 4,151.7 on solid 20-day average volume of 11,890 contracts, which keeps the broader trend constructive even after the latest pullback.
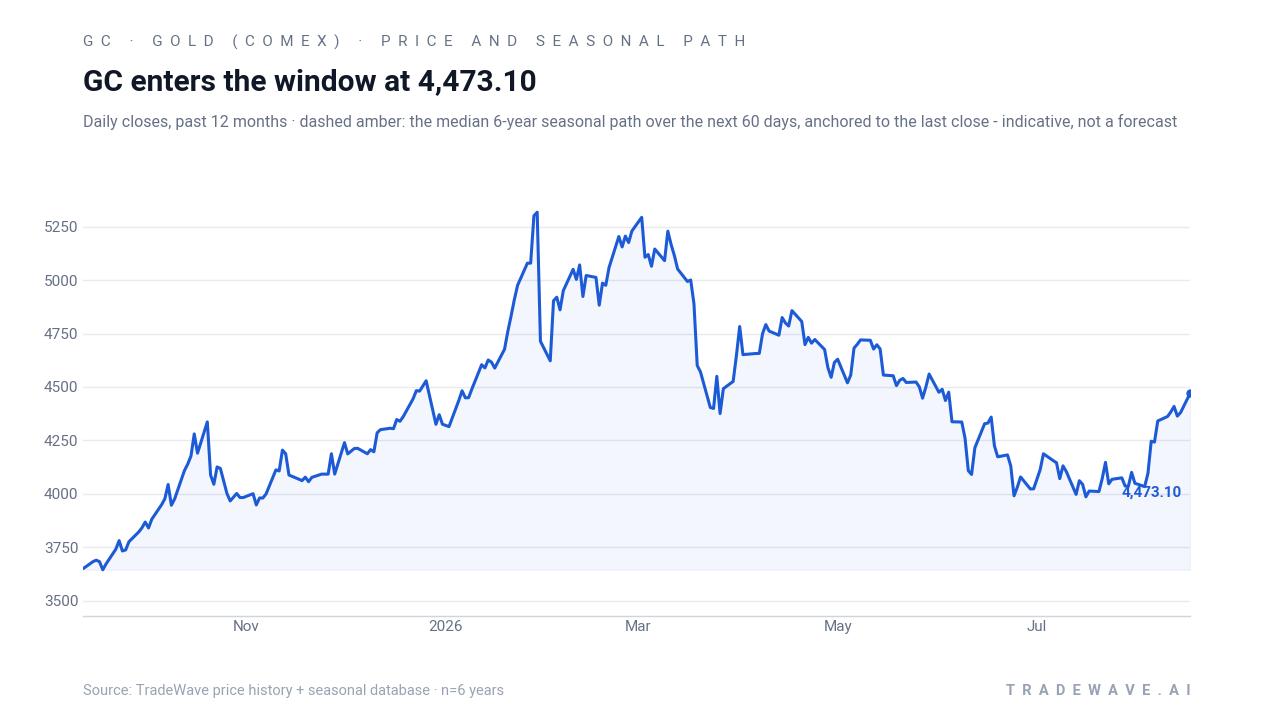
Macro drivers have been doing most of the work. On Jul 14, a softer-than-expected US CPI print pushed the dollar and Treasury yields lower, helping lift COMEX gold as traders marked down the odds of additional Fed tightening.[1] Earlier in the year, on Mar 26, gold sold off as markets reassessed the prospects of a ceasefire in the Middle East, with analysts citing speculative flows and liquidity-driven selling as geopolitical risk premium briefly came out of the market.[3] Those swings underline how quickly the macro and geopolitical backdrop can flip the switch on gold, even before the historically strong Sep 12 seasonal window opens.
The chart below shows how that mix of inflation data and geopolitical headlines has played out in price, alongside the median seasonal path for the next two months.
What should traders watch as this Gold (COMEX) seasonal window approaches?
First, the calendar. The 127-day window begins on Sep 12 and runs through Jan 16, so positioning and volatility in late August and early September will set the tone for how Gold (COMEX) enters a historically strong stretch. A firm base above the 50-day moving average into that date would align with the bullish historical seasonality, while a sharp break lower would test how durable the pattern really is.
Second, the macro tape. Upcoming US inflation releases and any shift in Fed rhetoric around the path of policy rates will be critical, given how closely gold has tracked real yields this year.[1] Traders will also be watching Middle East headlines and other geopolitical flashpoints after the March episode showed how quickly ceasefire expectations can knock safe-haven demand out of the market.[3]
Third, levels. The 52-week high near 5,586.2 and the 50-day moving average around 4,151.7 bracket a wide range for GC. A move back toward the upper end of that band during the window would be consistent with the historical pattern of midterm-year autumn strength, while a failure to hold above the moving average would mark a clear departure from prior cycles.
Finally, behavior inside the window. In past midterm election years, the strongest GC seasonal trend outcomes have often featured early drawdowns followed by sustained rallies into year-end, as in 2014 and 2022. If this year’s window again sees an initial shakeout followed by buying on dips, it would echo that playbook. If instead gold grinds sideways or sells off persistently through October and November, traders will have evidence that the 6-for-6 record is meeting a tougher macro regime.
Sources
About this seasonal analysis
Seasonal pattern data is sourced from TradeWave.ai, which analyzes historical price behavior across annual calendar windows going back up to 30 years. Read the full data methodology or the book The 100-Year Pattern by Afshin Moshrefi (2026 edition). Past performance of seasonal patterns does not guarantee future results. This article is for informational purposes only and does not constitute investment advice.