RBOB Gasoline (RB) Has Dropped in 10 Straight Late-August Windows, Averaging 8.94% for Shorts
RBOB Gasoline futures are hovering near $3 as traders head toward a late-August window that has seen prices fall in 10 straight years, raising questions about how seasonality will interact with today’s geopolitically driven rally.
Price as of Aug 19, 2026: $3.03 (last close).

What is the seasonal pattern for RBOB Gasoline (RB)?
RBOB Gasoline has fallen in 10 of 10 years during the Aug 29 to Sep 4 window, with an average 8.94% gain for short positions in winning years.
- 10 for 10 in this window, with short trades averaging 8.94% profit across the past decade.
- Seasonal window runs from Aug 29 to Sep 4, a historically weak stretch for RBOB Gasoline prices.
- Percent Profitable is 100%, with 10 winners and 0 losers for the short-direction pattern.
- Annualized return across the window is 8.89%, with a Sharpe ratio of 2.63 for end-of-window outcomes.
- The TradeWave Ratio of 2.91 signals that price typically travels meaningfully in the short direction within the seven-day span.
- Individual years have seen double-digit declines, underscoring that intraperiod drawdowns for longs can be sharp even in a short window.
According to historical data from TradeWave.ai, this late-August stretch in RBOB Gasoline has behaved very differently from an average summer week. The next section walks through how that pattern has played out and where the upcoming window fits into today’s market backdrop.
How has RBOB Gasoline (RB) traded in the late-August seasonal window?
RBOB Gasoline has dropped in every single Aug 29 to Sep 4 window for the past 10 years, with short positions averaging 8.94% gains over that span. Futures settled at 3.0276 in the prior session, leaving the contract about 20.8% below its 52-week high of 3.8232 and well above the 52-week low of 1.6656. That combination of a strong year-long rebound and a historically weak seven-day window gives late-August a very different profile from the rest of the driving season.
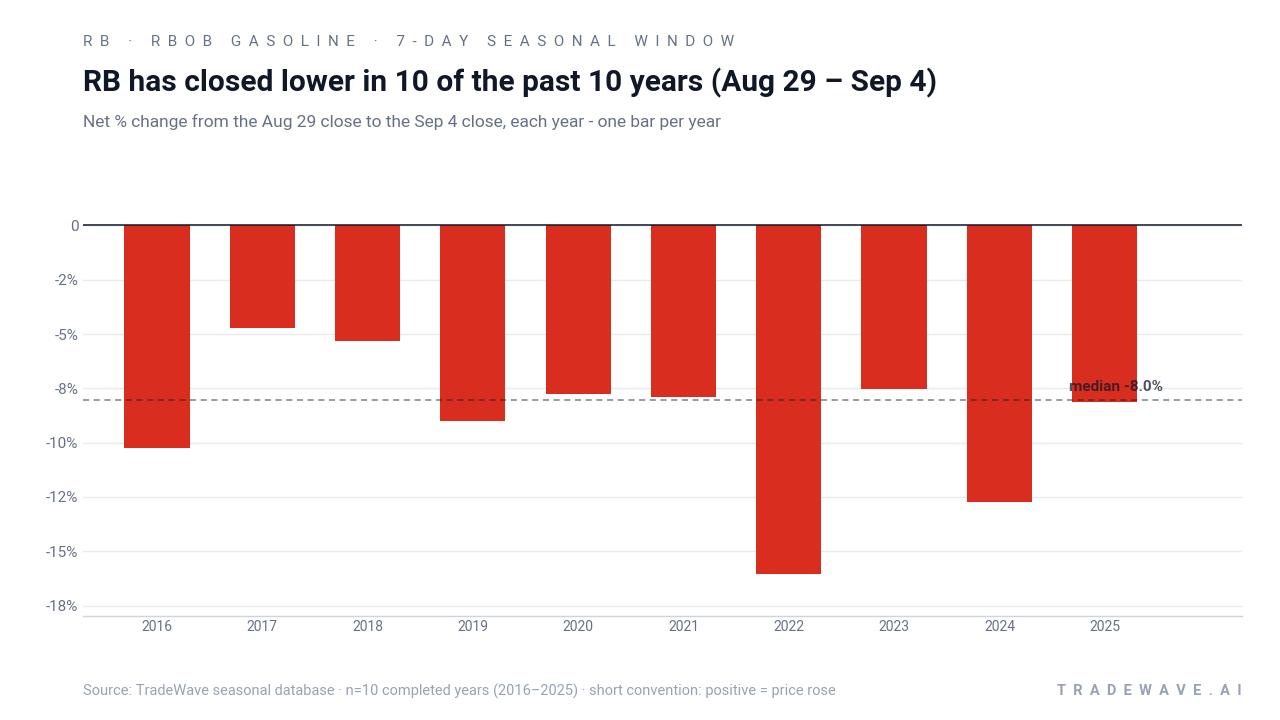
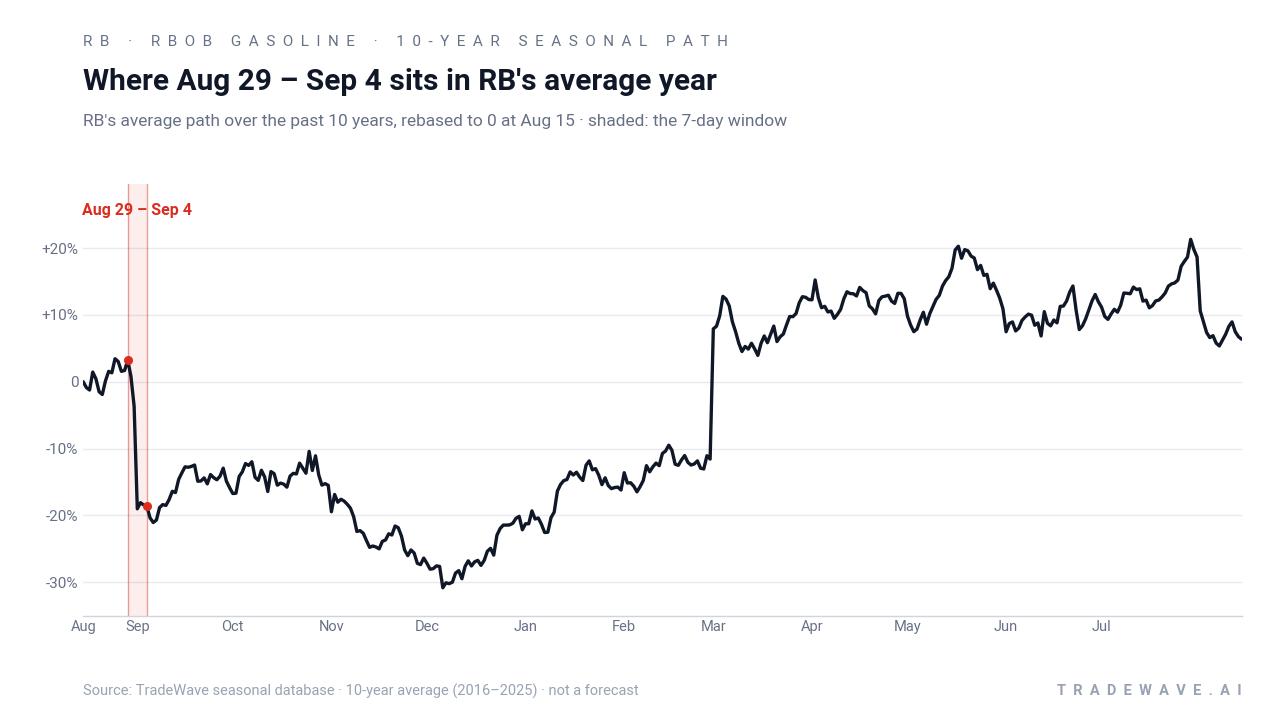
Year-by-year ranges show how far prices have swung within the window before settling lower.
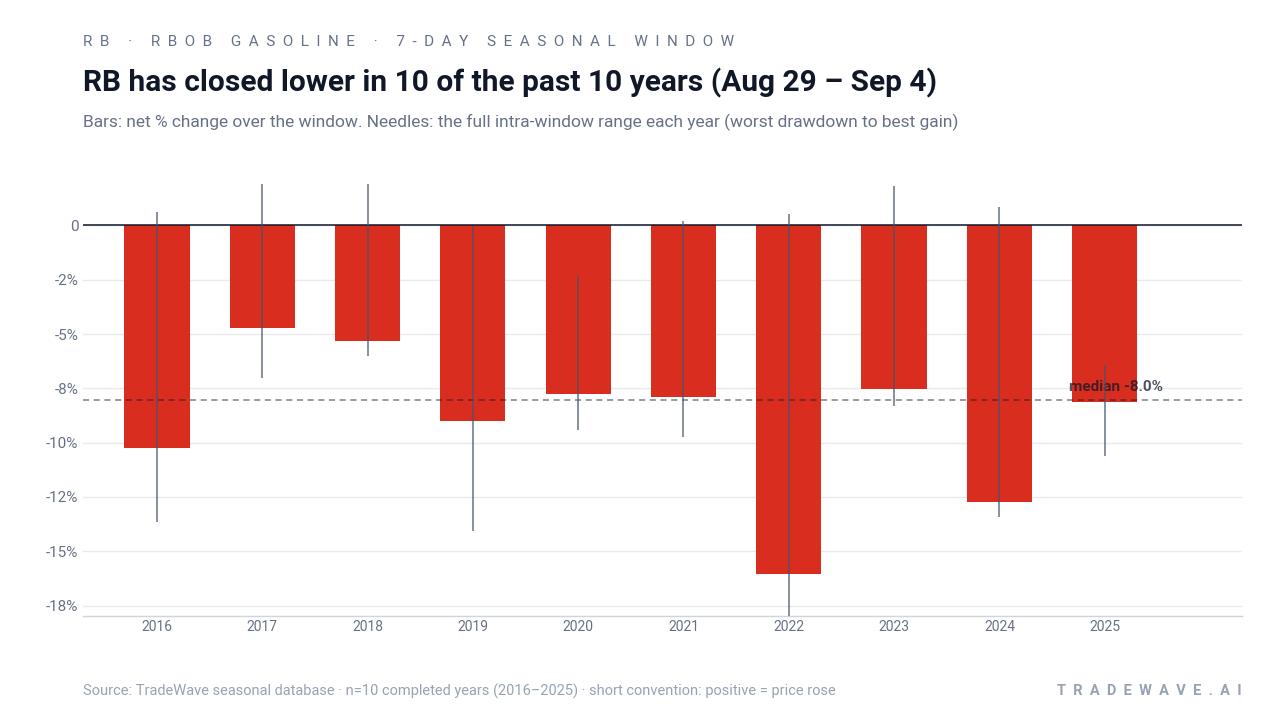
Across the 2016 to 2025 sample, every completed Aug 29 to Sep 4 window ended with RBOB Gasoline lower, which is favorable for the short-direction pattern. The weakest year for prices was 2022, when the contract fell 16.04% over the seven days, while 2016 and 2024 also posted double-digit declines of 10.26% and 12.72% respectively. On the milder side, 2017 and 2018 still saw prices slip 4.72% and 5.31%, underscoring that even the “soft” years have not been flat.
The intraday and intraperiod swings inside the window have been meaningful. In 2017, for example, RBOB Gasoline briefly rallied as much as 21.71% from the entry level before finishing the week down 4.72%, a reminder that short setups have historically had to weather sharp squeezes before paying off. In contrast, years like 2019 and 2022 saw the worst drawdowns for longs, with maximum adverse moves of 14.08% and 18.33% from the entry price, reflecting how quickly sentiment can flip once the summer driving peak passes.
The TradeWave Ratio of 2.91 captures this tendency for price to travel a long way in the trade direction within just seven calendar days. Combined with a Sharpe ratio of 2.63 based on end-of-window outcomes, the pattern has not only been consistent but also relatively efficient on a risk-adjusted basis for traders aligned with the short bias. The cumulative return chart compounds those seven-day moves into a 134% gain over the decade, showing how stacking the same calendar slice has added up.
History does not guarantee future results; adverse excursions (MAE) can be large even in winning windows.
Why does RBOB Gasoline (RB) follow this seasonal pattern?
This late-August weakness likely reflects the transition out of peak U.S. driving season, when gasoline demand typically starts to fade and refiners begin shifting toward winter-grade output. Analysts often point to inventory builds, refinery maintenance schedules, and the roll-off of summer travel as structural forces that can pressure prices in this period. The pattern may also capture positioning resets by funds that have ridden earlier summer strength and look to reduce exposure before Labor Day liquidity thins out.
What is driving RBOB Gasoline (RB) today?
RBOB Gasoline futures ended the prior session at 3.0276, up 0.44% on the day, after trading between 3.0109 and 3.0325 on relatively light volume compared with the 20-day average of 47,972 contracts. The contract has pulled back about 12.02% over the past month, but it remains well above its 52-week low of 1.6656 as geopolitical risk in key shipping lanes keeps a floor under refined products.
Supply concerns around the Strait of Hormuz have been the dominant macro driver this summer. On Jul 20, 2026, reports of escalating hostilities and fears of a potential closure helped trigger sharp gains in both crude and RBOB Gasoline futures as traders priced in the risk of disrupted flows from the Gulf region.[1] By Aug 12, uncertainty over the timing of any reopening was still supporting prices, with gasoline tracking crude higher as the dollar weakened.[2] The situation tightened further by Aug 18, when continued closure and deadlock over the Strait were cited as key reasons RBOB Gasoline and crude pushed to multi-week highs.[3]
Those spikes have come against a backdrop of shifting shipping routes elsewhere. On Jul 29, 2026, confirmation that oil shipments through the Red Sea were continuing helped cool some of the earlier rally, contributing to pullbacks in both WTI and RBOB Gasoline after prior sharp gains.[4] Earlier in the year, on May 13, a stronger dollar had already shown how quickly currency moves can flip the script, inducing long liquidation in energy futures even as supply concerns lingered.[5] For gasoline traders, the message has been clear: geopolitics, the dollar, and shipping logistics are interacting in real time, often overpowering the usual summer demand narrative.
The chart below situates the latest move in its recent multi-month context and overlays the median 10-year seasonal path into early autumn.
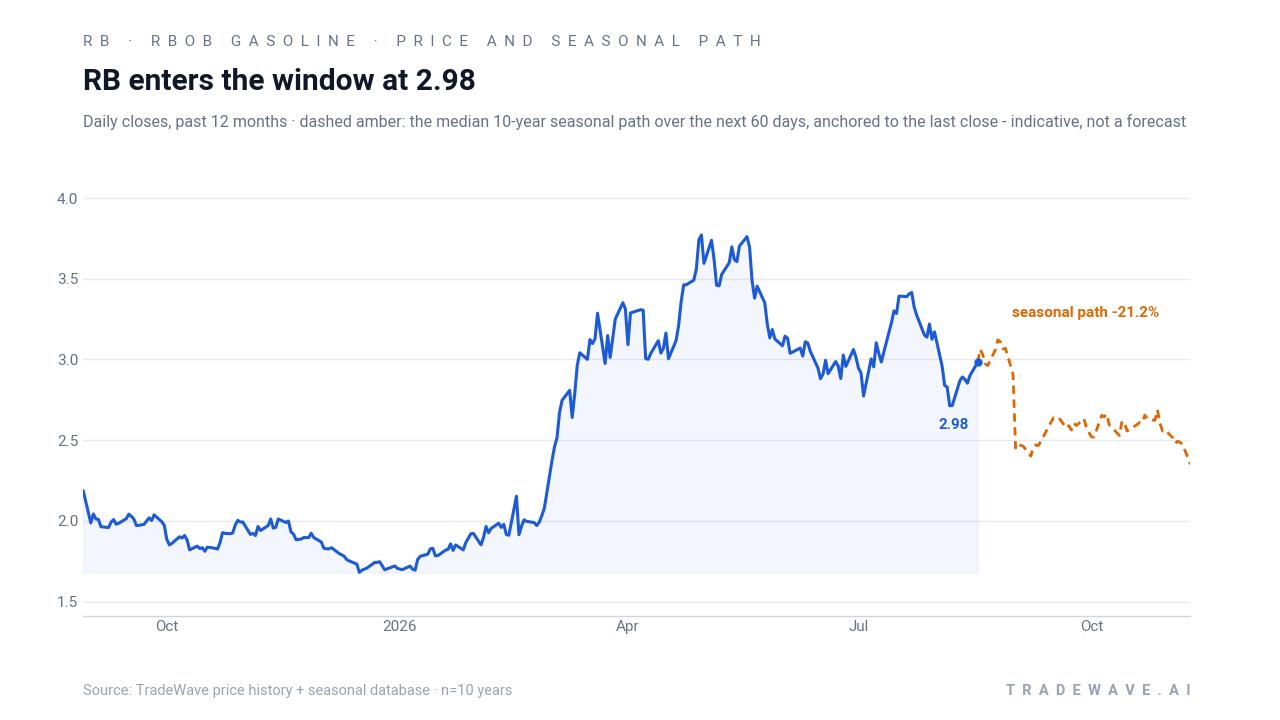
Against that macro backdrop, the looming Aug 29 to Sep 4 seasonal window stands out as a potential inflection point. RBOB Gasoline is trading in a firm uptrend relative to last year’s lows and remains a key reference for inflation expectations and consumer fuel costs. Even so, TradeWave’s seasonal data highlights a short, historically sharp window where prices have repeatedly rolled over, often with double-digit declines in just a week. Because gasoline feeds directly into headline inflation and household budgets, any volatility in this period can ripple into rate expectations, energy equities, and broader risk sentiment.
What should traders watch as the late-August window approaches?
First, the Strait of Hormuz remains the swing factor for supply. Any clear progress toward reopening could remove a key pillar of support for RBOB Gasoline just as the historical late-August weakness window opens, while fresh disruptions or escalation would test how much seasonal gravity can matter against a genuine supply shock.[1][3] Second, watch weekly inventory data and refinery utilization as the market transitions out of peak driving season; a turn from draws to builds has often coincided with softer gasoline pricing in prior years.
Third, price behavior inside the Aug 29 to Sep 4 span will be the real test of the pattern. A quick fade from current levels, especially if accompanied by rising volumes and easing geopolitical risk, would line up with the 10-for-10 historical record. A sustained squeeze higher through the window, particularly if driven by renewed shipping disruptions or a weaker dollar, would mark a clear break from the past decade’s RB seasonal trend and could force systematic and discretionary traders to reassess how much weight to give this slice of the calendar.
Sources
- Crude Oil Prices Surge as Geopolitical Risks Intensify (Jul 20, 2026)
- Uncertainty Over Reopening of Strait of Hormuz Lifts Crude Prices (Aug 12, 2026)
- Crude Prices Supported as Strait of Hormuz Remains Closed (Aug 18, 2026)
- Oil Prices Fall Back as Red Sea Oil Shipments Continue (Jul 29, 2026)
- Crude Oil Prices Erase Early Gains as the Dollar Strengthens (May 13, 2026)
- Crude Oil Prices Weakens on Oversupply Concerns (Dec 10, 2025)
- Energies / Refined products: gasoline futures trends and seasonality (2025)
- Geopolitical risk and the Strait of Hormuz: impact on crude and gasoline supplies (2026)
- Seasonal Market News: Seasonal analysis methodology (2026)
- Afshin Moshrefi, The 100-Year Pattern (2026 edition)
About this seasonal analysis
Seasonal pattern data is sourced from TradeWave.ai, which analyzes historical price behavior across annual calendar windows going back up to 30 years. Read the full data methodology or the book The 100-Year Pattern by Afshin Moshrefi (2026 edition). Past performance of seasonal patterns does not guarantee future results. This article is for informational purposes only and does not constitute investment advice.