RBOB Gasoline (RB) Slides With Crude, Just as a 10-for-10 Late-August Losing Stretch Nears
RBOB Gasoline futures sit well below their 52-week high just as a late-August seasonal window that has produced consistent short-side gains approaches, putting a rare historical pattern up against tight inventories and volatile crude.
Price as of Aug 27, 2026: $2.91 (last close).

What is the seasonal pattern for RBOB Gasoline (RB)?
RBOB Gasoline has fallen in 10 of 10 years during the Aug 29 to Sep 4 window, with an average gain of 8.94% for short positions in winning years.
- 10 for 10 in this window, with short trades averaging 8.94% profit across winning years over the past decade.
- The upcoming seasonal window runs from Aug 29 to Sep 4 and has historically favored downside moves in RBOB Gasoline futures.
- Percent Profitable sits at 100%, with 10 winners and 0 losers for the short-side pattern across the 10-year lookback.
- Average winner gains of roughly mid-to-high single digits stack to a 134% cumulative return when the window is repeated each year.
- The TradeWave Ratio of 2.91 signals that price has typically traveled meaningfully in the trade direction within the window, even before final closes.
- Intraperiod swings have included sizable adverse moves in some years, so short setups have not been painless even when they finished profitable.
According to historical data from TradeWave.ai, this late-August stretch in RBOB Gasoline has behaved very differently from an average week on the calendar. The next section walks through what that pattern has looked like and how it fits into today’s macro backdrop.
How has RBOB Gasoline (RB) traded in the late-August seasonal window?
RBOB Gasoline has dropped in every single Aug 29 to Sep 4 window for the past 10 years, with short positions averaging 8.94% profit and no losing years. The front-month contract last settled at 2.9113 dollars per gallon, about 23.8% below its 52-week high of 3.8232 and well above the 52-week low of 1.6656, after sliding roughly 7.81% over the past month.[1][2] That combination of a strong historical short-side edge and a market that has already come off its highs makes this upcoming week one of the more statistically charged stretches on the gasoline calendar.
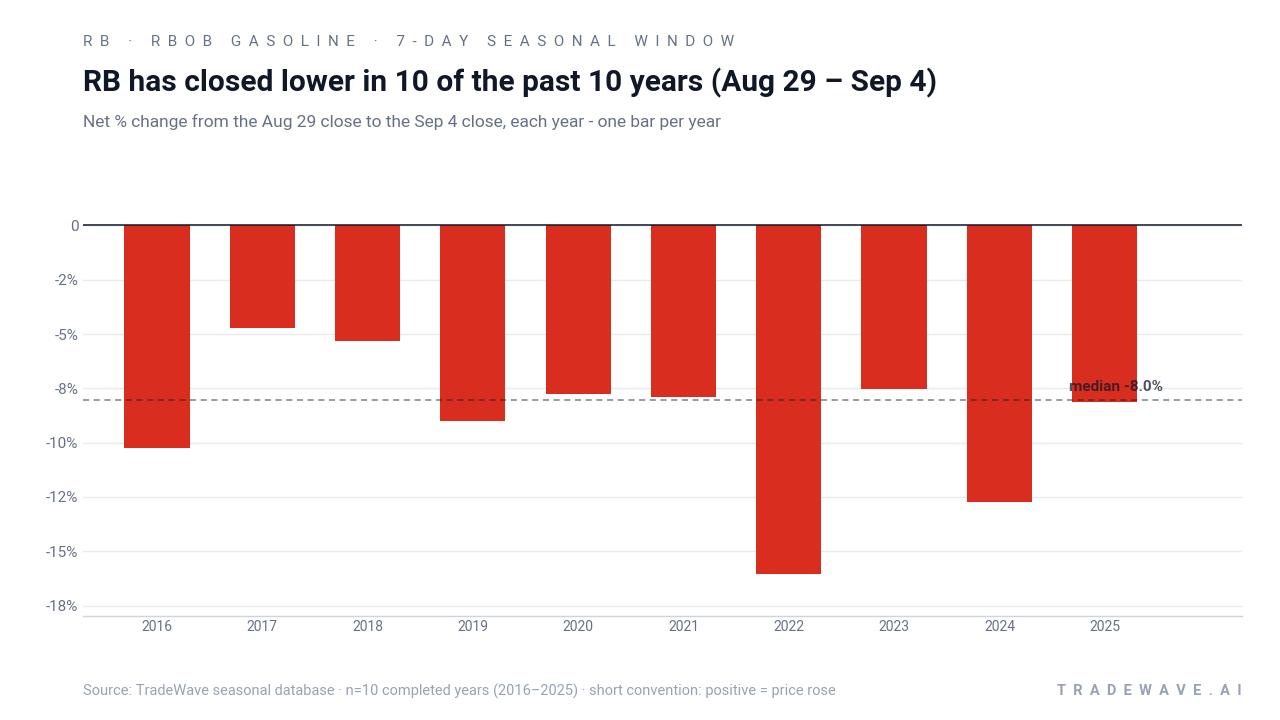
The trade direction for this pattern is explicitly short. Across the 2016 to 2025 sample, every Aug 29 to Sep 4 window finished with RBOB lower on a close-to-close basis, which translates into 100% Percent Profitable with 10 winners and 0 losers for short positions. Average profit of 8.94% reflects the mean gain for those short trades, while the 134% cumulative return figure shows what happens when that 7-day window is repeated and compounded over the decade.
The per-year breakdown shows how that consistency has played out. The strongest year for the pattern was 2022, when RBOB fell about 16.04% over the window from an entry near 2.8776 dollars per gallon to an exit around 2.4159. The softest outcome still delivered a meaningful move for shorts in 2017, with a 4.72% decline from roughly 1.7833 to 1.6991, even though intraperiod trading saw a sizable upside spike before the final fade.
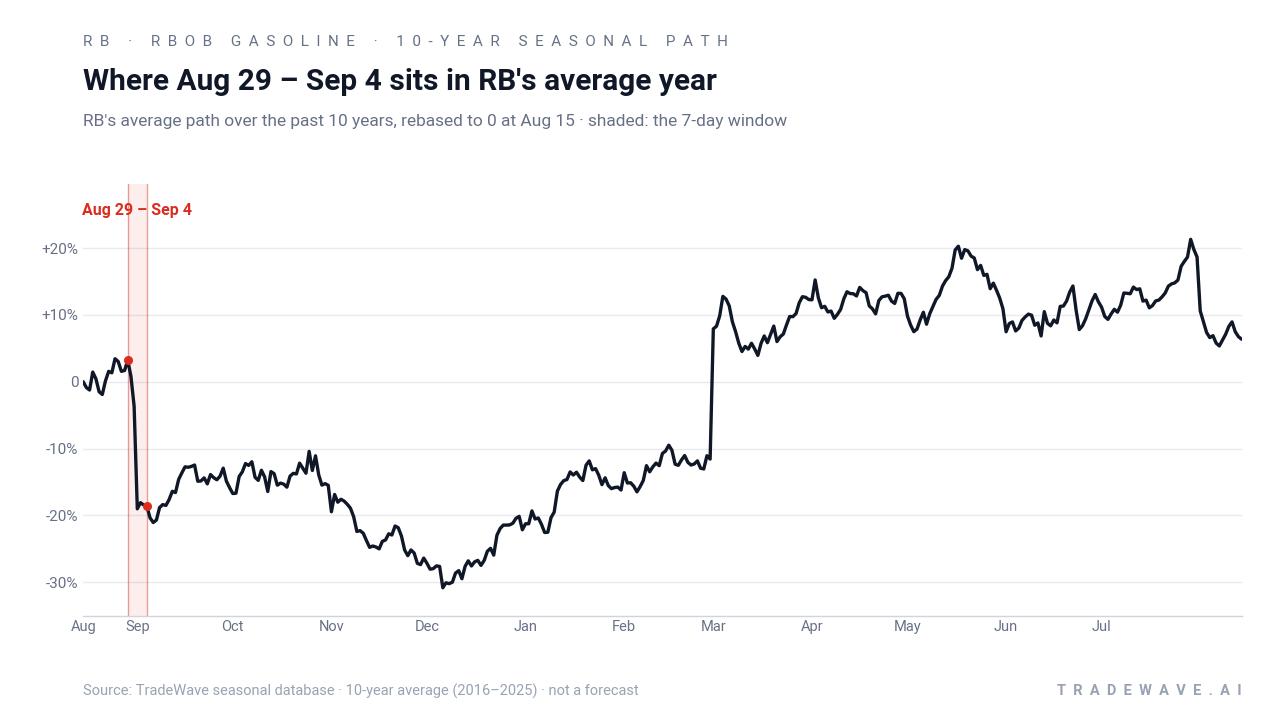
The historical seasonal average suggests that RBOB tends to peak or stall in the second half of August, then drift or break lower into early September. In the composite path, the shaded Aug 29 to Sep 4 window lines up with a clear downslope, which is consistent with the short-side bias seen in the individual years. The pattern does not look like a single shock year skewing the data; instead, the decline shows up as a recurring feature in the average year profile.
Year-by-year ranges highlight how far RBOB has tended to swing inside this 7-day window before settling at lower closes.
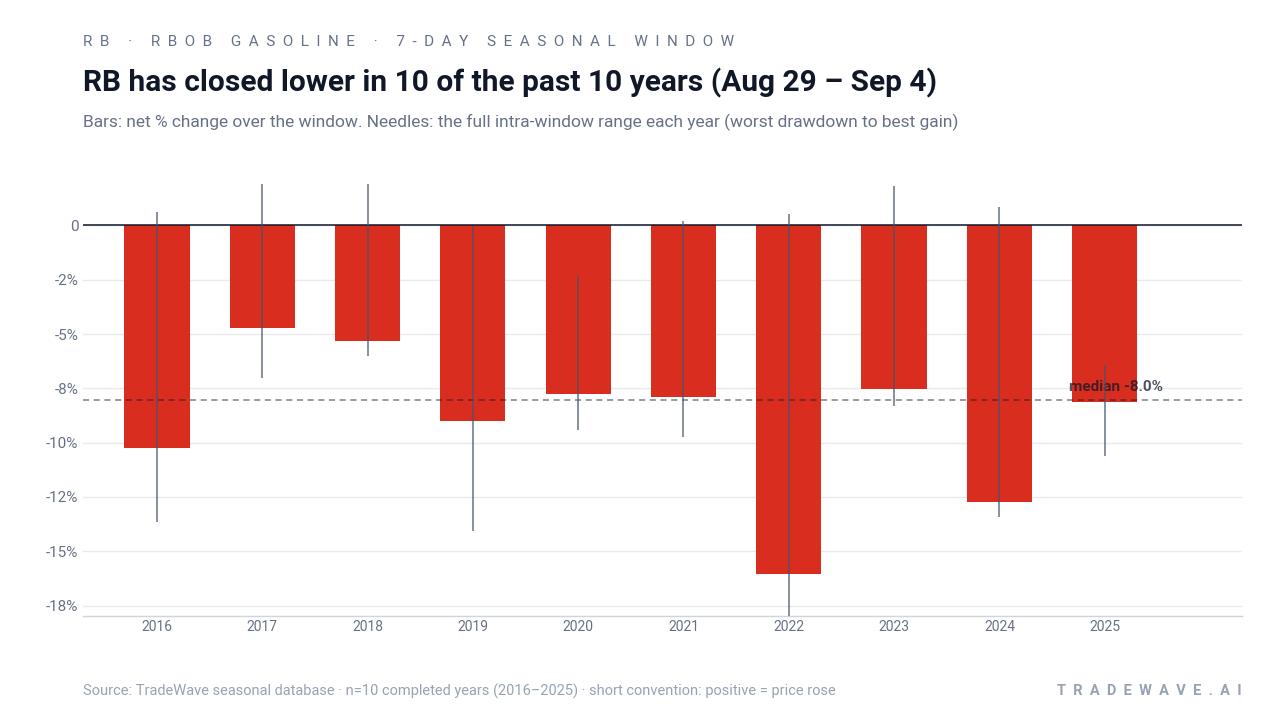
The combined net / range chart shows that this has been a volatile but ultimately directional window. Maximum favorable excursions for shorts have often been deep, with several years posting double-digit declines from entry to intraperiod lows. At the same time, maximum adverse excursions have not been trivial, especially in 2017 when RBOB briefly rallied more than 20% from the entry level before reversing, underscoring that short trades in this window have historically required tolerance for sharp squeezes.
The bottom line is simple. Ten for ten is a rare record for any commodity window, and in this case it has come with sizable average moves and a TradeWave Ratio that points to meaningful travel in the trade direction inside just seven calendar days.
Why does RBOB Gasoline (RB) follow this seasonal pattern?
This late-August pattern likely reflects the transition from peak U.S. summer driving demand into the shoulder season, when refiners begin shifting blends and traders reassess gasoline exposure. Analysts have pointed to consumer demand cycles and refinery maintenance schedules as recurring drivers of refined product seasonality, especially around Labor Day.[4] The pattern may also capture portfolio repositioning in energy markets as desks roll out of summer gasoline trades and back toward crude or distillates.
History does not guarantee future results, and intraperiod drawdowns have been large in some years even when the window ultimately finished profitable for short positions.
What is driving RBOB Gasoline (RB) today?
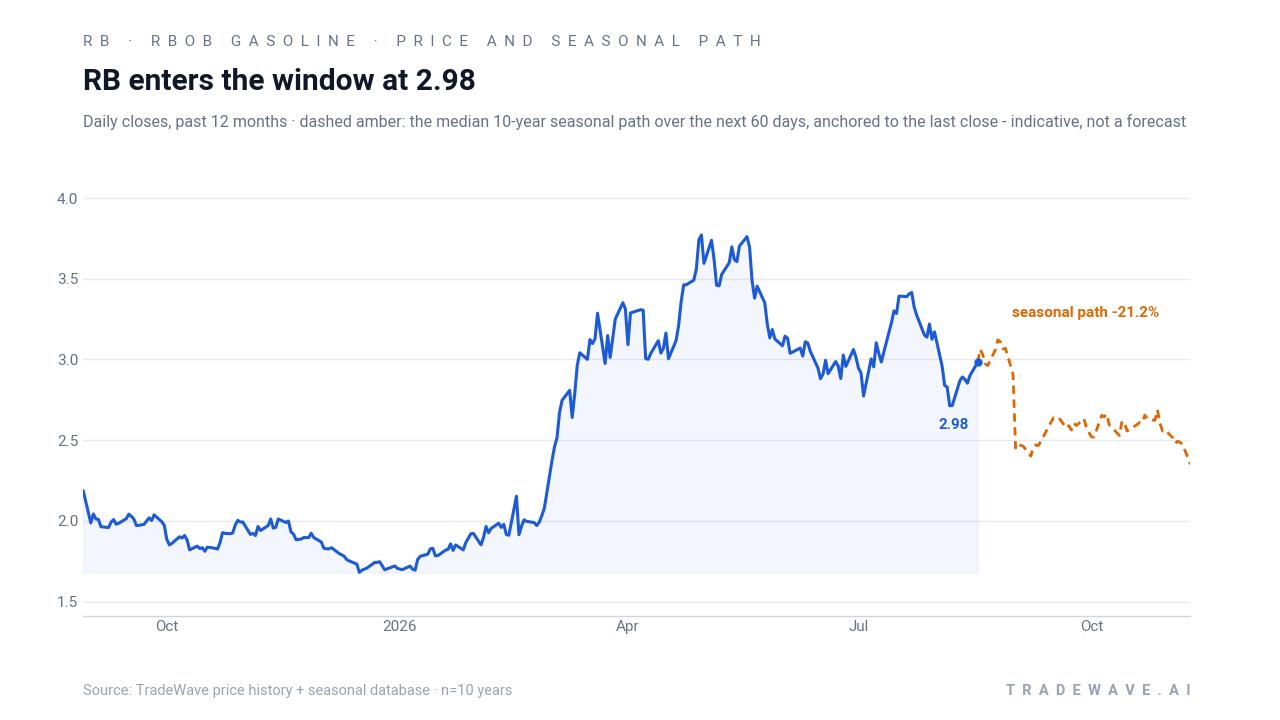
Front-month RBOB Gasoline futures last settled at 2.9113 dollars per gallon, down about 0.7% on the day and roughly 7.81% over the past month, leaving the contract about 23.8% below its 52-week high of 3.8232 and well above the 52-week low of 1.6656.[1][2] The latest pullback follows a sharp decline in both crude and gasoline futures earlier this week, when October RBOB contracts closed lower alongside a broader energy selloff.[3] That move has come against a backdrop of still-tight physical gasoline markets, where crack spreads had widened into the high 30s to low 40s dollars per barrel range earlier in the summer and inventories were described as at multiyear lows heading into the driving season, a setup that had previously supported higher prices.[3][4]
RBOB remains a key benchmark for U.S. refined product pricing, with futures trading on CME Globex in units of 42,000 gallons and reacting quickly to refinery outages, demand surprises and swings in crude benchmarks.[4] CME’s open interest tools show that positioning in the contract is closely watched by commercial hedgers and speculators alike, which can amplify moves when macro headlines or inventory data hit during thin late-summer liquidity.[5] With the contract now below its 50-day moving average of roughly 3.03 dollars per gallon and trading on lighter-than-average volume compared with its 20-day norm, the market is heading into the seasonal window from a position of cooling momentum rather than outright euphoria.[1]
The chart below places the latest decline in the context of the past year and overlays the median seasonal path for the next two months.
How do supply and demand shape this RBOB Gasoline seasonal window?
RBOB futures are tightly linked to refined product fundamentals, with prices responding to refinery disruptions, seasonal demand patterns and the underlying crude oil tape.[4] Earlier in the summer, commentary highlighted physical gasoline tightness, with crack spreads jumping from around 27 dollars to as high as 43 dollars per barrel and inventories sitting at multiyear lows as the U.S. driving season ramped up.[3] That environment supported a bullish tone for RBOB, but as the calendar moves toward Labor Day, demand typically begins to cool and refiners start to adjust runs and blends, which can ease some of that tightness.
The seasonal pattern from Aug 29 to Sep 4 lines up with this fundamental transition. In years when inventories have been tight, the window has often captured the first signs of loosening as gasoline demand expectations roll over and traders look ahead to autumn maintenance. In years with more balanced stocks, the same week has still tended to see profit-taking after summer rallies, which shows up in the consistent short-side wins in the historical data. Add it up and the pattern looks less like a random quirk and more like a recurring inflection point in the gasoline supply-demand cycle.
What does positioning say about RBOB Gasoline (RB) into this window?
While detailed CFTC positioning data is not included here, CME’s open interest tools for RBOB Gasoline futures underline how actively both commercial hedgers and speculative accounts use the contract.[5] When open interest is elevated heading into late August, the seasonal window can become a pressure valve as hedgers adjust coverage and macro funds rebalance energy exposure after the core of the driving season. In lower open-interest regimes, the same week can still produce sharp moves because thinner liquidity allows relatively modest order flow to push prices around.
For traders watching this year’s setup, the key will be how quickly open interest and volume respond if prices start to break lower again into the window. A pickup in activity alongside renewed downside would rhyme with prior years where the seasonal pattern played out cleanly. A muted response, or a squeeze higher on light volume, would look more like the outlier intraperiod rallies that have historically tested short positions before the eventual fade.
What should traders watch in the upcoming RBOB Gasoline window?
Three things will matter most as RBOB Gasoline approaches the Aug 29 to Sep 4 seasonal window. First, watch how prices behave around the 3.00 dollar area and the 50-day moving average near 3.03; sustained trade below that zone would keep the contract in a corrective posture heading into a historically weak stretch, while a squeeze back above it would test how durable the seasonal pattern really is.[1] Second, keep an eye on weekly gasoline inventory data and crack spreads, since any sign that multiyear-low stocks are rebuilding or that margins are compressing could reinforce the historical tendency for late-August softness.[3][4]
Third, monitor futures volume and open interest as the window opens. A build in participation alongside downside follow-through would echo prior years where short positions captured sizable moves in a short span, while a drop-off in activity or a sharp intraperiod rally would look more like the years where maximum adverse excursions spiked before the pattern reasserted itself. If RBOB were to hold firm or rally through the window despite the 10-for-10 track record, that would be a clear break from the historical seasonality and a signal that this year’s supply-demand and macro mix is overpowering the usual late-summer script.
Sources
About this seasonal analysis
Seasonal pattern data is sourced from TradeWave.ai, which analyzes historical price behavior across annual calendar windows going back up to 30 years. Read the full data methodology or the book The 100-Year Pattern by Afshin Moshrefi (2026 edition). Past performance of seasonal patterns does not guarantee future results. This article is for informational purposes only and does not constitute investment advice.