6-for-6 Midterm Run: Gold (COMEX) (GC) Averages 8.31% Gains From Sep 12 to Jan 16
Gold (COMEX) futures are climbing again as they head toward a mid-September seasonal window that has delivered gains in every midterm election year since 2002, setting up a closely watched stretch into January.
Price as of Aug 24, 2026: $4,694.80 (intraday).

What is the seasonal pattern for Gold (COMEX) (GC)?
Gold (COMEX) has risen in 6 of 6 midterm election years during the Sep 12 to Jan 16 window, with an average gain of 8.31% in winning years.
- 6 for 6 in this window, averaging 8.31% gains in winning years across the last 6 midterm election cycles.
- Seasonal window runs from Sep 12 to Jan 16, spanning 127 calendar days in the heart of the midterm election year and into the pre-election year.
- Percent Profitable is 100%, with 6 winners and 0 losers in the historical sample.
- Median profit of 8.54% suggests the typical year has delivered a solid single-digit gain rather than relying on one outlier.
- TradeWave Ratio of 2.28 indicates price has typically traveled meaningfully in the long direction within the window, while the Sharpe ratio of 2.27 points to strong risk-adjusted returns.
- Individual years have still seen notable drawdowns inside the window, with adverse moves as deep as roughly 7% before recovering.
According to historical data from TradeWave.ai, this mid-September window has behaved very differently from an average stretch on the gold calendar. The next section walks through how that pattern has played out across past midterm election years.
How has Gold (COMEX) (GC) traded in the Sep 12 to Jan 16 midterm-year window?
Gold (COMEX) has finished higher in every Sep 12 to Jan 16 window across the last six midterm election years, averaging an 8.31% gain for long positions. Futures are heading into this year’s iteration from a strong base, with front-month GC settling at 4,693.70 in the prior session, up 1.5% on the day and trading between 3,485.70 and 5,586.20 over the past 52 weeks. That combination of a clean 6-for-6 historical record and a contract already near the upper half of its one-year range gives this fall’s GC seasonal trend unusual weight for macro traders.
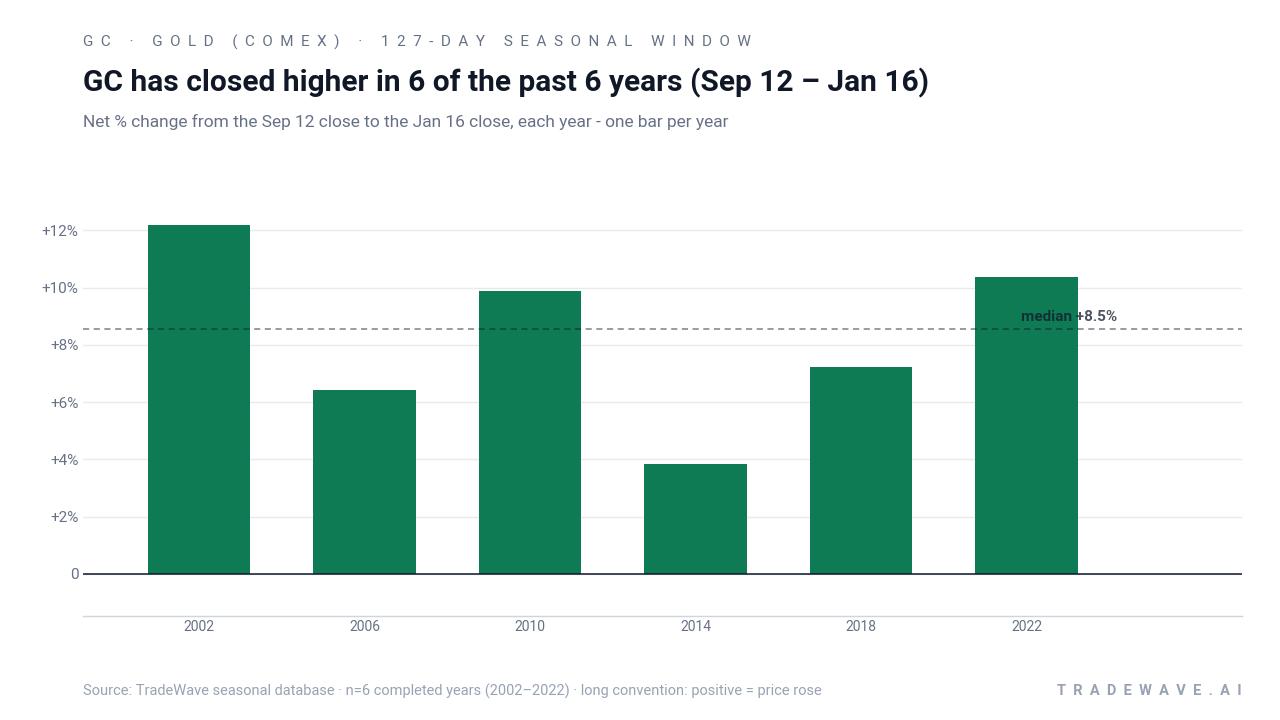
The pattern is built on the last six midterm election years, from 2002 through 2022, and it lines up with a familiar macro rhythm. Midterm years often bring policy uncertainty and tighter financial conditions, while the following pre-election year has historically leaned more supportive for risk assets. For gold, that has translated into a late-year stretch where hedging demand, central-bank positioning and year-end portfolio rebalancing have tended to push prices higher.
Across those six cycles, the strongest year in this GC seasonal window was 2002, when the contract gained 12.17% between Sep 12 and Jan 16. The softest outcome still delivered a 3.82% rise in 2014, underscoring how consistent the upside bias has been even when gold was not in a powerful secular bull market. The median profit of 8.54% sits close to the average, which suggests the record is not being skewed by a single blockbuster year.
Intraperiod swings have been meaningful. In 2010, for example, gold’s best point-to-peak move inside the window, known as the maximum favorable excursion, reached 14.94% before settling back to a 9.88% net gain by Jan 16. On the downside, the worst drawdown from entry, or maximum adverse excursion, hit roughly 7.88% in 2014 before the contract recovered to finish positive. That mix of double-digit upside potential and mid-single-digit to high-single-digit pullbacks is typical of a high-conviction but volatile commodity window.
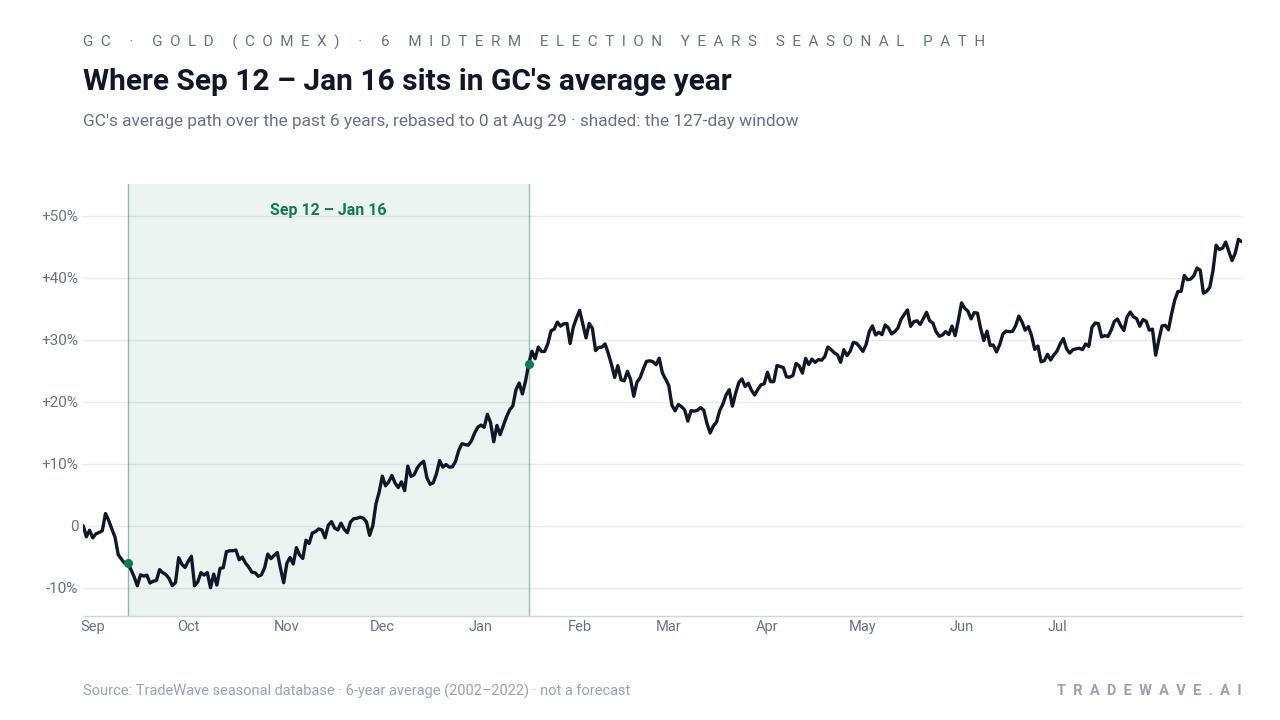
The historical seasonal average, which rebases each year’s path and then smooths them together, shows GC often starting the window with a firm tone, consolidating in the middle, and then grinding higher into early January. That shape fits the macro calendar: autumn rate expectations, year-end risk hedging and early pre-election positioning have often clustered in this period. The cumulative return chart compounds each of the six windows and reaches a total gain of about 61%, which means simply stacking this slice of the calendar has historically produced a sizable contribution to long-term gold performance.
Yearly net and intraperiod ranges highlight how upside and drawdowns have coexisted inside this window.
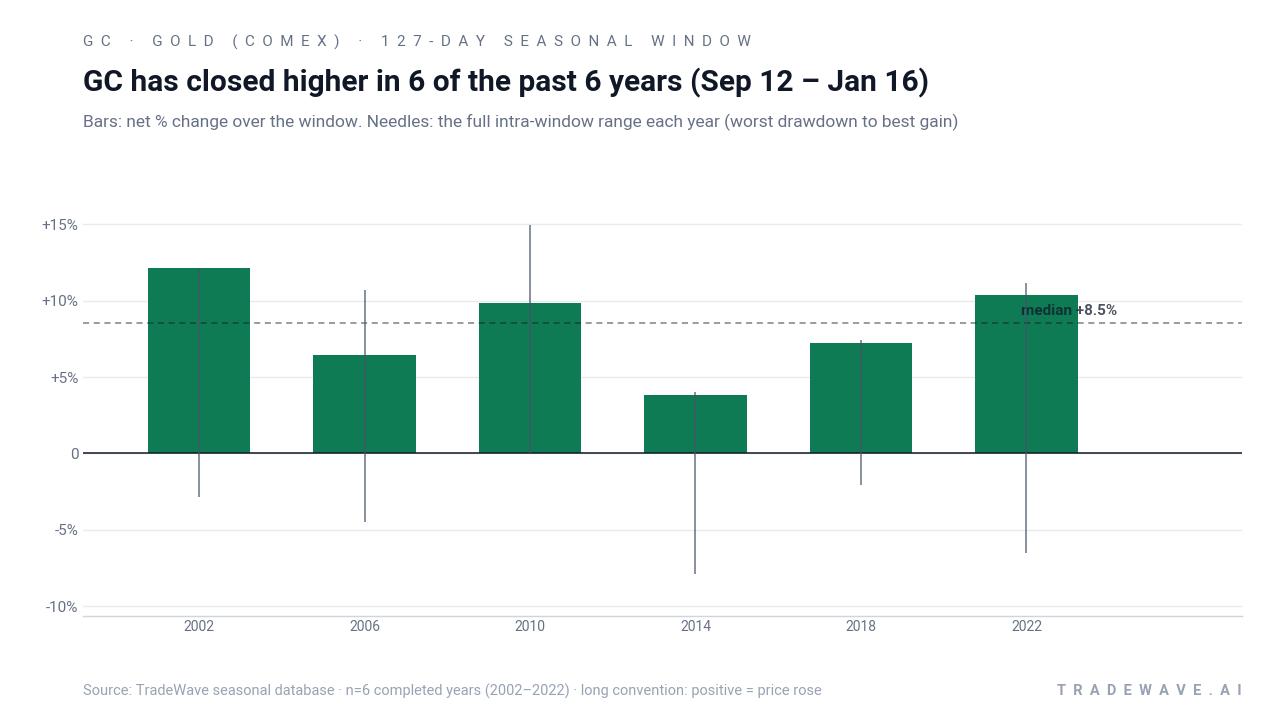
History does not guarantee future results; adverse excursions can still be large inside this window even when the final outcome is positive.
Why does Gold (COMEX) (GC) follow this seasonal pattern?
One likely driver is the way the policy calendar and investor behavior cluster around midterm election years. Analysts have pointed to a mix of geopolitical hedging, central-bank reserve activity and year-end portfolio rebalancing that tends to build through autumn and into early January, especially when fiscal and regulatory paths look uncertain. This pattern may also reflect commodity supply and demand seasonality, with physical buying in Asia and options-related positioning in Western markets combining to support gold prices into the turn of the year.
What is driving Gold (COMEX) (GC) today?
Gold (COMEX) futures ended the prior session at 4,693.70, up 69.60 points or 1.5%, after trading between 4,651.80 and 4,713.80 on relatively light volume of 35,022 contracts versus a 20-day average of 48,895.30. The contract sits between its 52-week low of 3,485.70 and high of 5,586.20, and it is trading comfortably above its 50-day simple moving average of 4,182.37, reflecting a firm medium-term uptrend. Technical gauges on the December 2026 contract show a composite “Buy” bias, with roughly 72% of indicators pointing higher, even as some moving-average crossovers flash mixed signals that argue for selectivity rather than blind momentum chasing.[3]
In early 2026, gold’s role as a geopolitical hedge was on full display when prices slid as markets reassessed prospects for an Iran ceasefire and a firmer dollar, reminding traders how quickly macro narratives can flip.[5] At the same time, structural shifts are reshaping the GC market. Elevated volumes and deeper liquidity during Asian hours have become a recurring feature, as regional demand and derivatives growth pull more trading into the overnight session for U.S. investors.[2] A separate report on Asia’s growing gold appetite described how that demand has helped fuel a surge in derivatives activity, including COMEX futures, which in turn can amplify intraday swings when macro headlines hit outside New York hours.[6]
Derivatives innovation is another layer. The expansion of weekly options and more granular hedging tools around gold has broadened participation and given both macro funds and retail traders more ways to express short-term views. That flexibility can concentrate positioning around key dates such as central-bank meetings or geopolitical milestones, increasing the odds of sharp, options-driven moves when those catalysts land.[2] Add it up and GC is entering its historically strong fall seasonal window with a bullish technical backdrop, deeper global liquidity and a derivatives ecosystem that can turn quiet sessions into fast-moving ones when sentiment shifts.
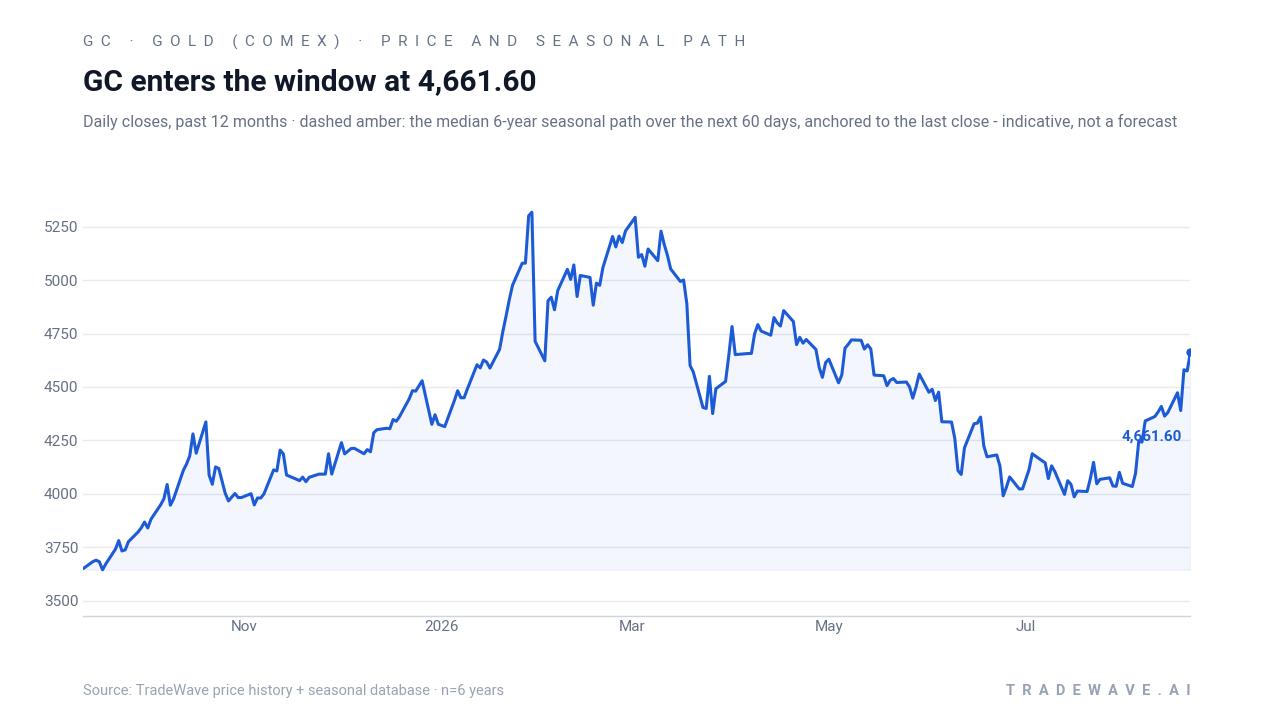
The chart below situates the latest move in its recent multi-month context alongside the historical 60-day seasonal projection.
What should traders watch as this Gold (COMEX) seasonal window approaches?
The first marker is timing. The 127-day window opens on Sep 12 and runs through Jan 16, so any sharp move in GC that begins clustering around mid-September will be unfolding inside a slice of the calendar that has never produced a losing year in this sample. Traders will be watching whether early strength follows the historical script or whether a deeper pullback appears first, similar to the 2014 pattern where an almost 8% drawdown preceded a positive finish.
Second, levels matter. With GC trading well above its 50-day moving average and within striking distance of the upper half of its 52-week range, a sustained break below that 50-day line would signal that this cycle is diverging from the typical midterm-year seasonal trend. Conversely, a series of higher highs into October and November, especially if accompanied by rising open interest and firm Asian-session liquidity, would look more like prior winning years.
Third, macro catalysts will shape how the pattern expresses itself. Upcoming central-bank meetings, inflation prints and any renewed geopolitical flare-ups could all feed into gold’s role as a hedge, either reinforcing the historical upside bias or overwhelming it with dollar and rate moves.[5] Traders will also be monitoring how derivatives positioning evolves around those dates, since concentrated options flows can accelerate both the maximum favorable and maximum adverse excursions that have characterized this window in the past.[2]
Finally, behavior inside the window will be the real test. If GC rallies early, consolidates without breaking key support and then grinds higher into year-end, it would echo the historical seasonal pattern and keep the 6-for-6 streak intact. A choppy tape with repeated failures at resistance or a decisive break of the 50-day average would suggest this midterm election year is writing a different script, reminding traders that even the cleanest seasonal trends are tendencies, not guarantees.
Sources
- MarketWatch - Gold (NYM $/ozt) Front Month Overview | MarketWatch
- Barchart - Complacency in Gold May Be Hiding the Next Big Move
- Barchart - Gold Dec '26 Futures Barchart Opinion - Barchart.com
- Barchart - Gold Dec '26 Futures Trader's Cheat Sheet - Barchart.com
- CNBC - Gold falls as markets assess prospects of Iran ceasefire
- Reuters (CME plus) - Asia’s growing gold demand fuels surging derivatives market
About this seasonal analysis
Seasonal pattern data is sourced from TradeWave.ai, which analyzes historical price behavior across annual calendar windows going back up to 30 years. Read the full data methodology or the book The 100-Year Pattern by Afshin Moshrefi (2026 edition). Past performance of seasonal patterns does not guarantee future results. This article is for informational purposes only and does not constitute investment advice.