Corn (CME) (ZC) Has Rallied in 12 Straight Sep-Oct Windows, Averaging 7.24% Gains
Corn (CME) futures sit just below 52-week highs as they trade through a late‑summer window that has delivered gains every year for more than a decade, amplifying an already strong 2026 advance.
Price as of Sep 9, 2026: $529.25 (intraday).

What is the seasonal pattern for Corn (CME) (ZC)?
Corn (CME) has risen in 12 of 12 years during this Sep 7–Oct 28 window, with an average gain of 7.24% in winning years.
- 12 for 12 in this window, averaging 7.24% gains in winning years across the past 12 seasons.
- Seasonal window runs from Sep 7 through Oct 28, a 52‑day stretch that has been consistently bullish for ZC.
- Percent Profitable is 100%, with 12 winners and 0 losers over the lookback period.
- Avg Profit of 7.24% reflects all years, since every season in the sample finished higher.
- TradeWave Ratio of 2.27 indicates price has typically traveled meaningfully in the long direction within the window.
- Sharpe ratio of 1.4 points to a strong risk‑adjusted profile for this recurring Corn (CME) trading window.
According to historical data from TradeWave.ai, this late‑summer stretch has behaved very differently from an average month on the corn calendar. The next section digs into how that pattern has played out and where the current contract sits inside it.
How has Corn (CME) (ZC) traded in the Sep 7–Oct 28 seasonal window?
Corn (CME) has finished higher in every single Sep 7–Oct 28 window for the past 12 years, with average gains of 7.24% and a cumulative return of 128%. Futures are trading at 529.25 cents per bushel in the latest session, up 21.8% year to date and about 2.6% below the 52‑week high of 543.5. That combination of a powerful historical tailwind and prices already pressing the top of the recent range makes this seasonal regime hard for grain traders to ignore.
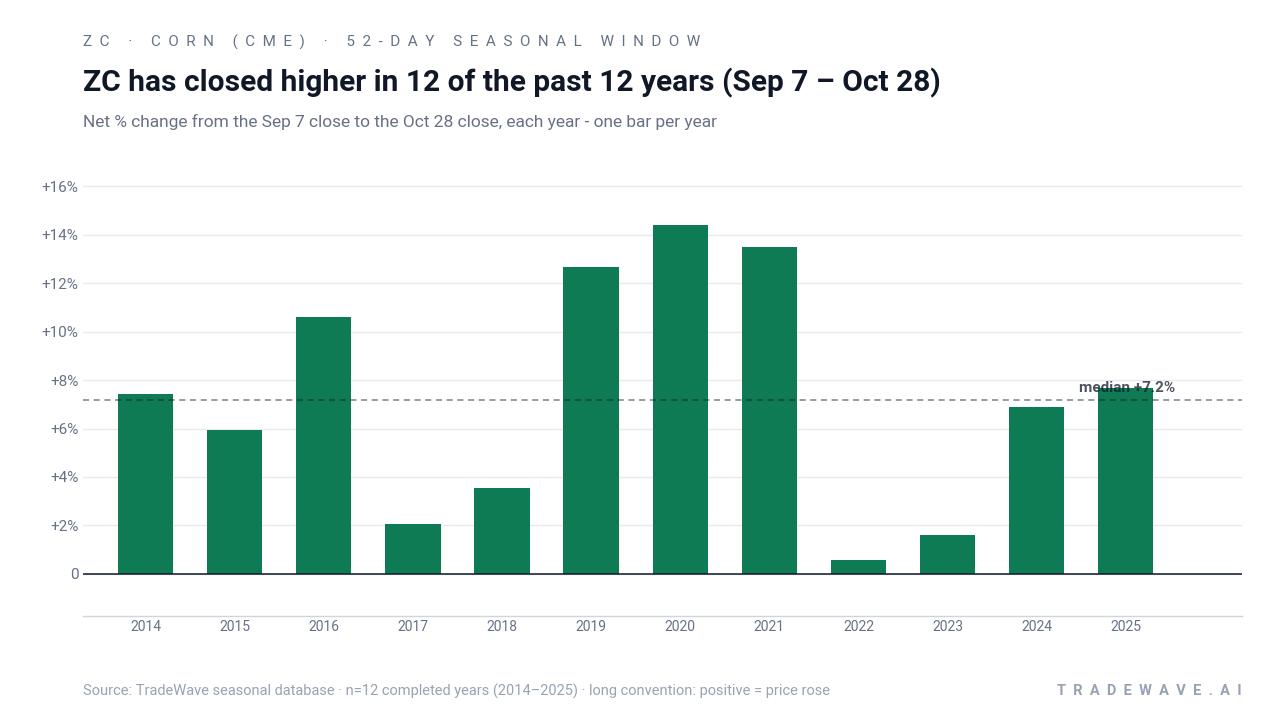
For this long‑biased pattern, every completed year since 2014 has been a “favorable” season, with net returns ranging from modest gains of around 0.59% to double‑digit advances above 14%. The median profit of 7.17% sits close to the average, which suggests the window has not been skewed by a single outlier year. Even the softer seasons, such as 2017 and 2022, still finished in the green, though with smaller net moves.
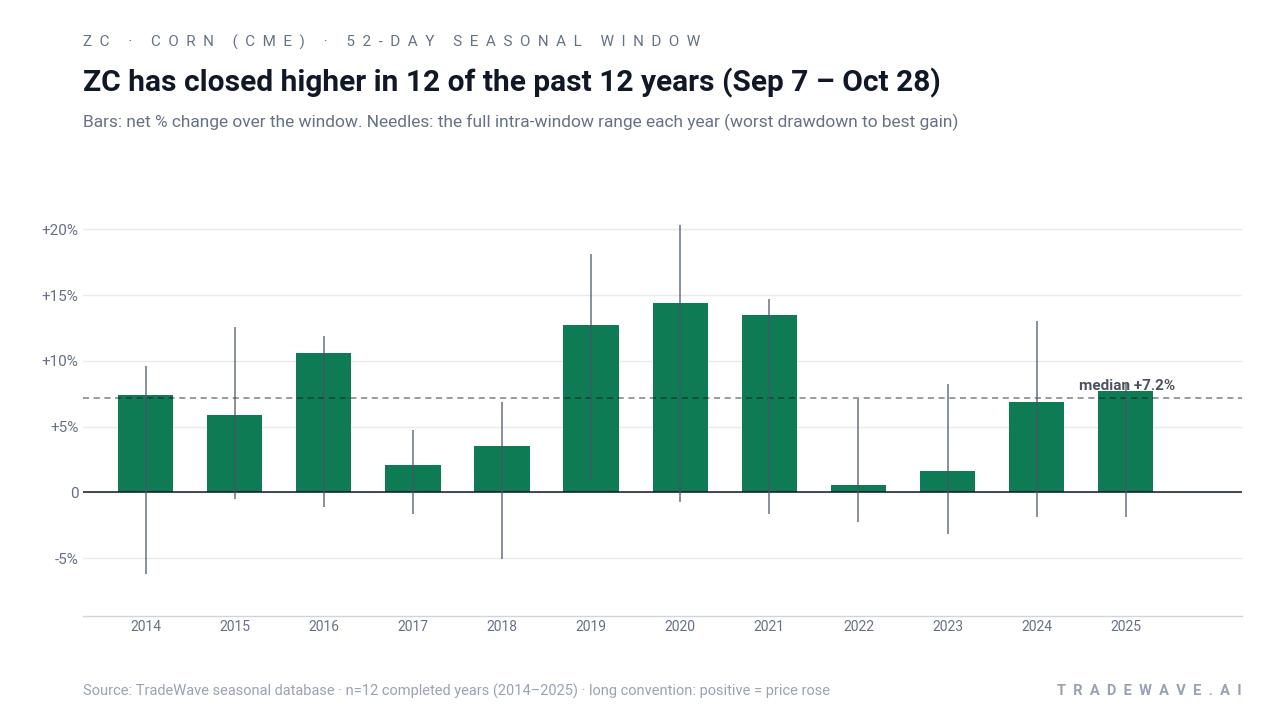
Intraperiod swings have been meaningful. In stronger years like 2019 and 2020, the maximum favorable move inside the window reached 18.12% and 20.3% respectively, showing how far rallies have stretched before the window closed. On the downside, the worst intraperiod drawdowns have generally been contained, with the largest adverse move of the sample at -5.08% in 2018 and many years seeing MAE closer to -2% or less. That mix of sizable upside excursions and relatively shallow pullbacks underpins the pattern’s 1.4 Sharpe ratio.
The trend profile is also telling. Trend‑tracking metrics show the window aligning with long setups in 88 of 100 trend observations, while short‑side trend readings are scarce. In practice, that has meant corn often starts to firm early in September, accelerates through late month and early October, then cools into the end of the window as harvest pressure and fresh USDA data reset expectations.
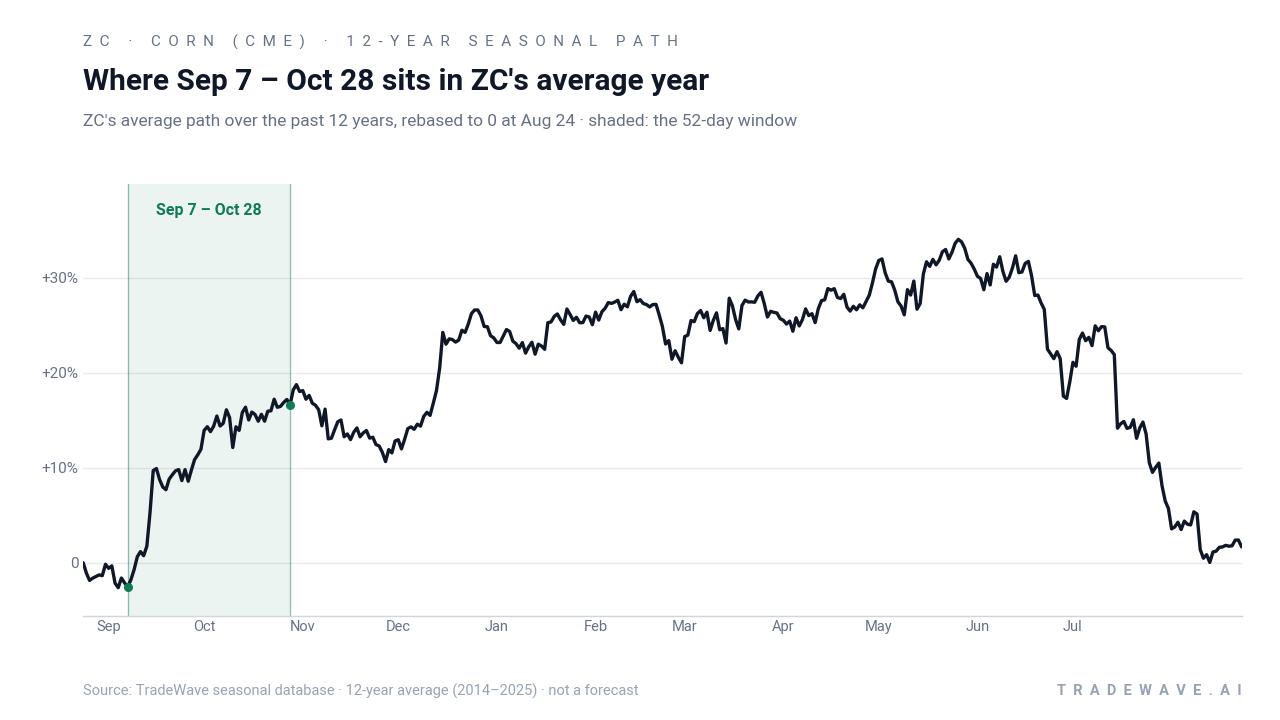
Yearly net and intraperiod ranges highlight how consistently upside has dominated, even when drawdowns appeared mid‑window.
Stacking these 52‑day windows year after year compounds to a 128% cumulative gain across the 12‑year sample. Add it up: this has been one of the most reliable bullish slices of the calendar for Corn (CME) in the modern era.
History does not guarantee future results; adverse excursions can still be sizable within the window even when the final outcome is positive.
Why does Corn (CME) (ZC) follow this seasonal pattern?
This pattern likely reflects classic commodity supply and demand seasonality. The Sep–Oct stretch lines up with U.S. harvest, when yield clarity replaces weather speculation and end‑users often step in to secure physical supply, supporting futures even as on‑farm selling picks up. Analysts have also pointed to the clustering of key USDA reports and export sales updates in this period, which can trigger repricing when yields or ending stocks diverge from expectations.
What is driving Corn (CME) (ZC) today?
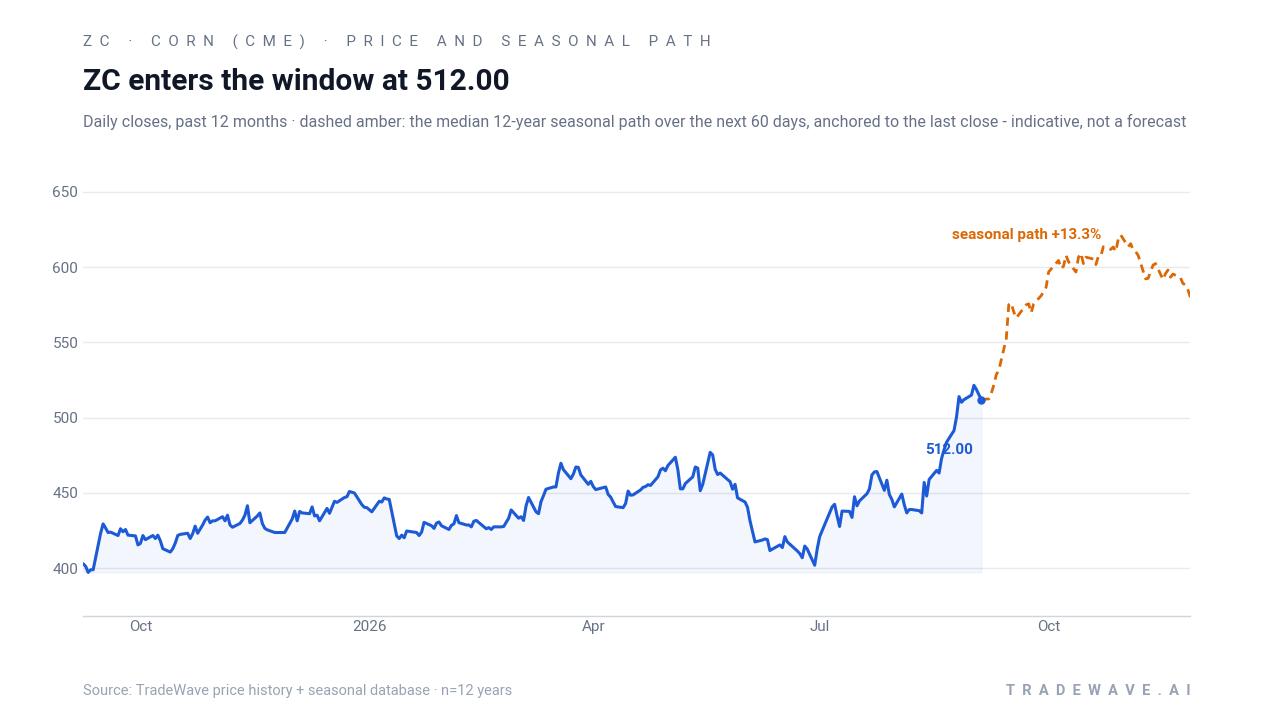
Corn (CME) futures slipped 0.66% in the latest session to 529.25, easing from last week’s push to a 52‑week high of 543.5 but still up 21.8% so far in 2026. The contract has been buoyed by a sharp rally since late August, when fresh USDA data cut U.S. yield estimates and stoked concern about tighter domestic supply, sending corn and wheat to their highest levels in more than three years.[1] That move built on a year shaped by shifting USDA ending‑stocks projections and changing acreage expectations, which have kept traders focused on every incremental data point.[2][3]
Macro and geopolitical currents are adding fuel. Russia‑Ukraine tensions and disruptions to Black Sea exports have tightened global grain flows, supporting corn alongside wheat as importers look to diversify origins and secure coverage ahead of winter.[1] At the same time, monthly USDA WASDE and weekly export‑sales reports continue to swing sentiment as traders recalibrate around yield, demand and stockpile revisions.[2][3] Earlier in the year, a stretch of improved U.S. weather and softer crude oil briefly knocked Chicago grains back, but the latest supply concerns have pulled the market firmly higher again.[3]
The chart below situates the latest pullback against the past year’s rally and the typical seasonal path over the next two months.
On the supply side, the market is juggling higher projected U.S. ending stocks from earlier in the year with more recent yield cuts and acreage debates.[2] In February 2026, an analyst poll pointed to 94.9 million acres of corn plantings, a level that would keep acreage elevated and potentially weigh on prices if yields hold up, though that survey reflected conditions well before the latest weather and yield revisions.[2] USDA’s January WASDE had already lifted projected ending stocks to 2.23 billion bushels, up roughly 200 million from December, which pressured prices at the time before the subsequent rally reset the tape.[2]
Positioning has been active but not one‑way. Commodity funds were reported as net sellers of corn in at least one recent period, even as USDA weekly export sales came in broadly in line with expectations, suggesting some profit‑taking into strength rather than outright bearish conviction.[3] In the background, agriculture strategists describe grains as moving into a relative‑strength phase after lagging broader commodities, with renewed interest from funds and ETFs that track the sector.[2] That flow backdrop, combined with the current ZC seasonal trend, helps explain why pullbacks have been shallow so far.
Logistics and weather remain the wild cards. Drier Corn Belt forecasts earlier this year briefly eased fears of yield loss and weighed on prices, while any fresh disruption to river levels, export channels or Black Sea shipping could quickly tighten the balance sheet again.[1][3] For now, the market is trading a tug‑of‑war between elevated U.S. stock projections on paper and a global supply chain that still looks fragile heading into winter.
What should traders watch in this Corn (CME) seasonal window?
First, watch how price behaves relative to the 52‑week high near 543.5. A sustained push through that level during a window that has historically favored longs would fit the 12‑for‑12 pattern, while a failure and deeper pullback would be an early sign that this year may diverge from the script. Intraperiod history shows that even winning years have seen drawdowns of up to about 5%, so a shakeout inside the range would not be unusual.
Second, keep an eye on the next USDA WASDE and weekly export‑sales reports, which have repeatedly reset expectations around yields, ending stocks and demand.[1][2][3] Surprises on either side of the ledger can quickly overwhelm seasonal tendencies, especially when prices are already near multi‑year highs. Export demand from key buyers and any fresh headlines out of the Black Sea will be just as important, given how much of this year’s rally has been tied to supply‑chain risk.[1]
Third, monitor fund positioning and volume behavior. Reports of commodity funds turning from net sellers back to net buyers, or a pickup in volume as prices test resistance, would suggest that macro and seasonal forces are pulling in the same direction.[3] Conversely, heavy selling into strength or a sharp drop in participation would hint that large players are fading the historical pattern rather than leaning into it.
Finally, traders should track how closely the actual path of Corn (CME) tracks the historical ZC seasonal trend over the coming weeks. A grind higher with contained pullbacks would echo the typical pattern of this Sep 7–Oct 28 window. A sharp break below recent lows, especially if tied to a string of bearish USDA surprises or a rapid easing of geopolitical risk, would be a clear sign that 2026 is writing its own chapter.
Sources
About this seasonal analysis
Seasonal pattern data is sourced from TradeWave.ai, which analyzes historical price behavior across annual calendar windows going back up to 30 years. Read the full data methodology or the book The 100-Year Pattern by Afshin Moshrefi (2026 edition). Past performance of seasonal patterns does not guarantee future results. This article is for informational purposes only and does not constitute investment advice.