Gold (COMEX) (GC) Has Finished Higher in 6 of 6 Midterm Fall-Winter Runs, Averaging 8.31% Gains
Gold (COMEX) is hovering near $4,468 as it heads into a historically strong Sep 12–Jan 16 window that has delivered gains in every midterm election year in the sample.
Price as of Sep 8, 2026: $4,468.10 (intraday).
What is the seasonal pattern for Gold (COMEX) (GC)?
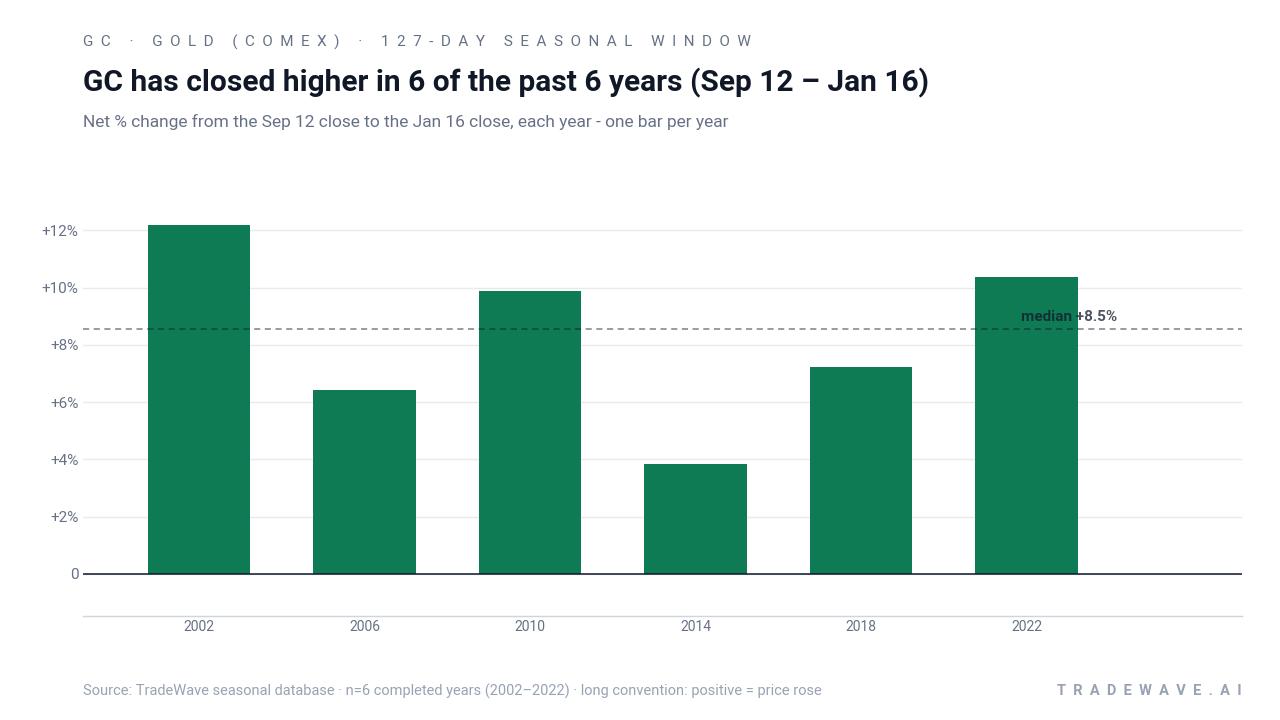
Gold (COMEX) has risen in 6 of 6 midterm-year Sep 12–Jan 16 windows, with an average gain of 8.31% in winning years.
- 6 for 6 in this window, averaging 8.31% gains in winning years across the last 6 midterm election years.
- Seasonal window runs from Sep 12 to Jan 16 (127 days), covering the late part of the midterm election year into the start of the pre-election year.
- Percent Profitable is 100%, with 6 winners and 0 losers in the historical sample.
- Median profit of 8.54% and a Sharpe ratio of 2.27 point to a relatively consistent upside profile for this long setup.
- TradeWave Ratio of 2.28 suggests price has typically traveled meaningfully in the trade direction within the window, even before final outcomes are booked.
- Individual years have still seen notable drawdowns inside the window, so intraperiod risk has been real despite the perfect win record.
According to historical data from TradeWave.ai, this late midterm-year stretch in gold has behaved very differently from an average calendar quarter, with a distinct fall–winter pattern that most futures traders never see quantified.
How has Gold (COMEX) (GC) traded in the upcoming Sep 12–Jan 16 window?
Gold (COMEX) has closed higher in every single Sep 12–Jan 16 window across the last six midterm election years, averaging an 8.31% gain for long positions. The next iteration of this 127-day seasonal regime begins on Sep 12, with futures currently around $4,468 and sitting about 20.0% below the 52-week high near $5,586.[2] That combination of a strong historical fall–winter pattern and a market that has already pulled back from record territory gives this year’s window extra weight for traders watching the GC seasonal trend.
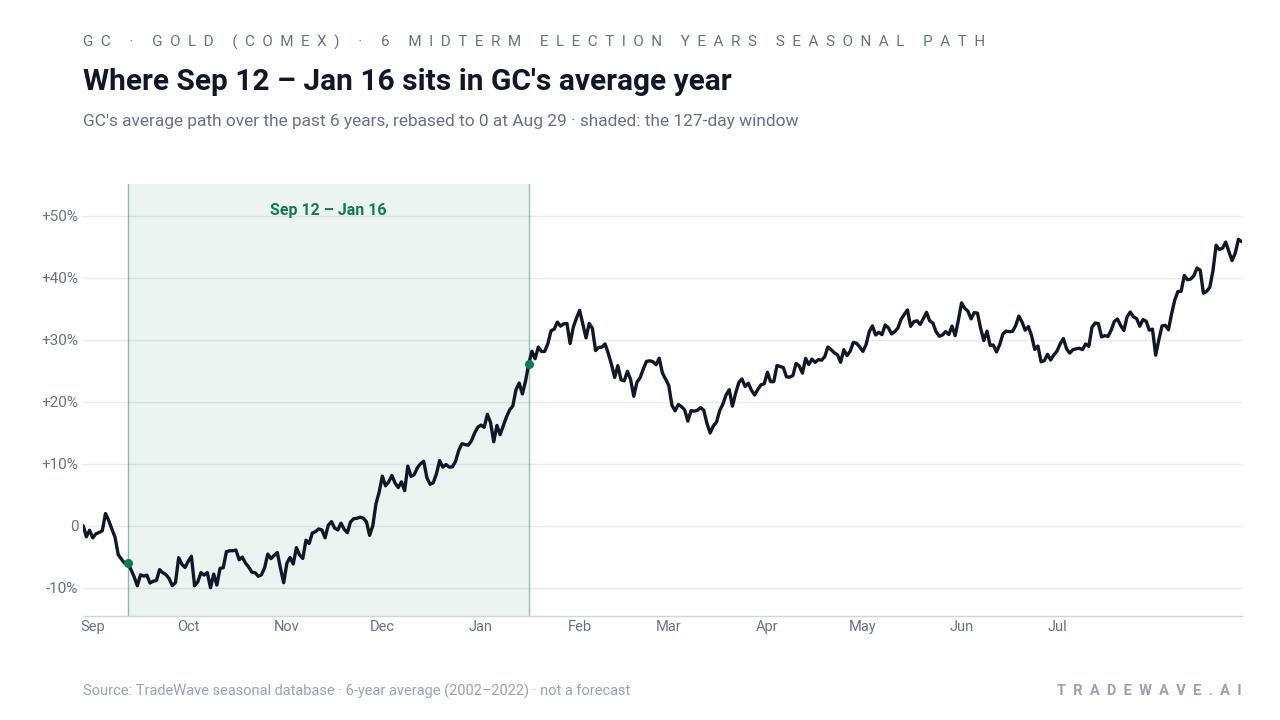
The election-cycle lens matters here because this pattern is built only from the last six midterm election years, not from a generic run of consecutive calendar years. Midterm years often feature shifting expectations around fiscal policy, regulation and central-bank reaction functions, and gold has tended to respond differently in that backdrop than in the year after the presidential election or the pre-election year. This Sep 12–Jan 16 slice also straddles the handoff from the concluding midterm election year into the year before the presidential election, a phase that has historically leaned more risk-on across many asset classes.
Across those six midterm-year windows, the long trade direction has been rewarded every time, with net gains ranging from 3.82% in 2014 to 12.17% in 2002. The median outcome sits at 8.54%, close to the average, which suggests the wins have not been dominated by a single outlier year. Add it up and stacking this same 127-day window across the six cycles compounds to roughly 61% cumulative gains, a notable run for a contract that many investors already view as a slow-moving hedge.
Year-by-year ranges show how much GC has typically swung inside the window before finishing higher.
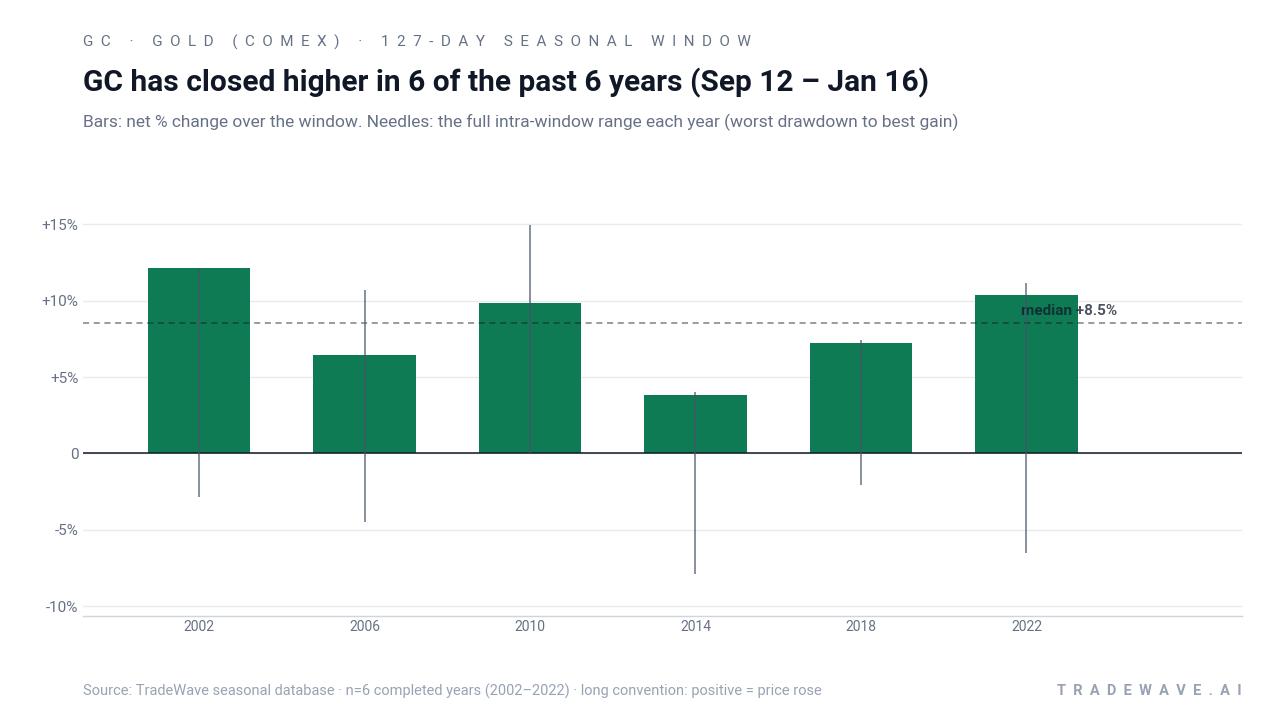
Intraperiod swings have been meaningful. In 2010, for example, the best point-to-peak move within the window reached 14.94%, while the worst drawdown from entry was effectively flat, showing a relatively smooth grind higher that year. By contrast, 2014 delivered a modest 3.82% net gain but saw a worst drawdown of 7.88% at one point, a reminder that even winning windows can test conviction. Across the sample, maximum favorable moves and maximum adverse moves have both been sizable enough to matter for risk management, which is reflected in the TradeWave Ratio of 2.28 and the solid but not extreme Sharpe ratio of 2.27.
The cumulative return chart for this GC seasonal pattern slopes steadily higher rather than lurching in fits and starts, which suggests the edge has been persistent across cycles rather than concentrated in a single boom period. There is still dispersion between the strongest year, 2002, and the softest, 2014, but the absence of any losing years in this long-only setup is unusual for a commodity that often trades in sharp macro-driven bursts. For traders who track stock pattern analysis and commodity seasonality side by side, this fall–winter Gold (COMEX) trading window stands out as one of the cleaner historical seasonality profiles in the precious-metals complex.
History does not guarantee future results; adverse excursions inside the window can be large even when the final outcome has been positive in every prior cycle.
Why does Gold (COMEX) (GC) follow this seasonal pattern?
This midterm-year fall–winter pattern in GC likely reflects a mix of commodity supply and demand seasonality, year-end portfolio rebalancing and shifting policy expectations. Analysts often point to central-bank buying, jewelry demand into the holiday season and institutional risk management around the turn of the year as drivers that can cluster gold flows in this period. In midterm election years specifically, changing expectations for fiscal policy and regulation may add an extra layer of demand for perceived safe-haven assets as investors look ahead to the year before the presidential election.
What is driving Gold (COMEX) (GC) today?
Gold (COMEX) futures slipped about 0.2% in the prior session to roughly $4,468, trading in a $4,426 to $4,486 intraday band and sitting well below the 52-week high near $5,586 even after a powerful multi-year run.[2][3] The front-month continuous contract was last quoted around $4,401 on Sep 7, while the Dec 2026 contract changed hands near $4,436, underscoring a relatively flat term structure with only a modest premium further out the curve.[2][4] In 2025, gold demand hit record levels and spot prices pushed toward $4,560 per ounce by year-end, as investors leaned on the metal as a portfolio cornerstone in the face of geopolitical tensions and shifting Federal Reserve expectations.[3]
The chart below situates the latest pullback against the past year of trading and the median 60-day seasonal path.
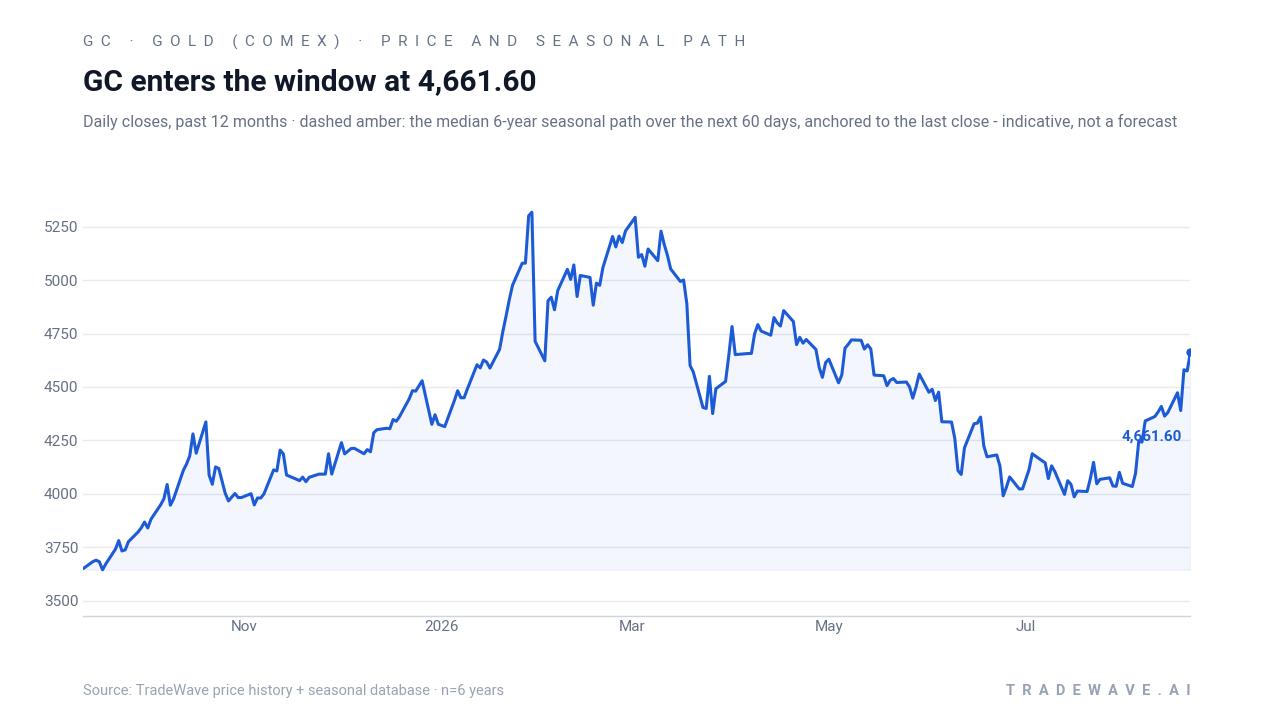
Sector-wide, precious metals have been trading as a macro barometer, with Bloomberg data showing gold among the more active contracts on major commodity boards as investors toggle between inflation hedging and real-yield sensitivity.[3] In January 2026, CME and other venues highlighted how record 2025 demand and spot all-time highs had pulled in a broader base of participants, from central banks to retail traders, reinforcing gold’s role as a flight-to-safety asset when policy uncertainty spikes.[3] Earlier in 2026, news coverage also flagged heavy call-spread activity and large upside option trades in gold, signaling that speculative positioning has at times leaned aggressively bullish even as prices have swung sharply.[6][7]
Looking ahead to this year’s Sep 12–Jan 16 window, the key macro question is how that demand mix evolves as the United States wraps up the midterm election year and moves into the year before the presidential election. If real yields stabilize and geopolitical risks stay elevated, the historical seasonality could align with supportive fundamentals. If policy expectations or liquidity conditions shift, the same GC seasonal trend could play out with more volatility than usual, especially given the contract’s distance from its 52-week peak and the history of sizable intraperiod drawdowns in prior cycles.[2][3]
What should traders watch as this GC seasonal window opens?
First, the calendar: the 127-day window starts on Sep 12 and runs through Jan 16, so the way GC behaves in the first few weeks will be an early tell on whether this cycle is tracking the historical pattern or diverging. Traders will be watching how price reacts around key levels near the recent range highs and lows, and whether dips toward the 50-day moving average around $4,250 attract buying interest or trigger deeper selling.[2] Second, macro catalysts matter, including incoming inflation data, central-bank commentary and any flare-ups in geopolitical risk that could revive safe-haven flows into gold.[3]
Third, options and volume dynamics will be important to monitor. Earlier in 2026, articles highlighted heavy call-spread building and large upside option trades in gold, along with periods of elevated volume and open interest across contracts, which can amplify futures moves when hedging flows kick in.[5][6][7] If similar patterns in options flow or volume reappear as the window opens, that would signal that speculative capital is leaning into the same fall–winter seasonal tendency, potentially increasing both the upside potential and the risk of sharp intraday reversals. Finally, traders will be watching whether GC respects the historical tendency to finish this window higher or whether a break in that 6-for-6 record signals a changing regime for one of the market’s key macro reference points.
Sources
- CNBC - Gold COMEX (Jan'27) - Stock Price, Quote and News - CNBC
- MarketWatch - GC00 | Gold Continuous Contract Overview
- Bloomberg - Commodities - Precious and Industrial Metals (Gold (Comex))
- MarketWatch - GCZ26 | Gold Dec 2026 Overview | MarketWatch
- Barchart - Gold Dec '26 Futures Performance Report - Barchart.com
- Yahoo Finance (republishing GuruFocus content) - Gold Breaks $5,000 as Options Traders Target Further Upside
- Yahoo Finance (republishing GuruFocus content) - Gold Traders Build 11,000 $15,000/$20,000 Call Spreads After 11% Plunge
About this seasonal analysis
Seasonal pattern data is sourced from TradeWave.ai, which analyzes historical price behavior across annual calendar windows going back up to 30 years. Read the full data methodology or the book The 100-Year Pattern by Afshin Moshrefi (2026 edition). Past performance of seasonal patterns does not guarantee future results. This article is for informational purposes only and does not constitute investment advice.