10-for-10 Midterm Run: Cummins (CMI) Averages 17.62% Gains in This 133-Day Window
Cummins is heading into a historically powerful midterm-year seasonal window just as shares cool off from record highs, raising the stakes for a stock that has already logged a strong year-to-date run.
Price as of Aug 21, 2026: $587.68 (last close).

What is the seasonal pattern for Cummins (CMI)?
Cummins has risen in 10 of 10 midterm-election-year Sep 23–Feb 2 windows, with an average gain of 17.62% in winning years.
- 10 for 10 in this window, averaging 17.62% gains in winning years across the last 10 midterm election cycles.
- The upcoming 133-day window runs from Sep 23 to Feb 2 and has historically favored long positions in Cummins.
- Percent Profitable is 100%, with 10 winners and 0 losers in the TradeWave sample for this specific election-cycle slice.
- Average winner gains of 17.62% stack to a 388% cumulative return when the window is repeated across all 10 cycles.
- Intraperiod swings have been meaningful, with some years showing double-digit drawdowns before finishing higher.
- The pattern sits in the midterm election year, a phase where policy and infrastructure themes often drive industrials.
According to historical data from TradeWave.ai, this midterm-election-year stretch has behaved very differently from an average few months on the calendar for Cummins. The next section walks through how that pattern has played out in prior cycles and what it could mean for the coming fall and winter.
How has Cummins (CMI) traded in past midterm-year fall–winter windows?
Cummins has rallied in every single Sep 23–Feb 2 window across the last 10 midterm election years, averaging a 17.62% gain for long positions. Shares finished Monday at $587.68, down 0.9% on the day and about 20.3% below the 52-week high of $737.76, even after an 18.92% climb year to date.
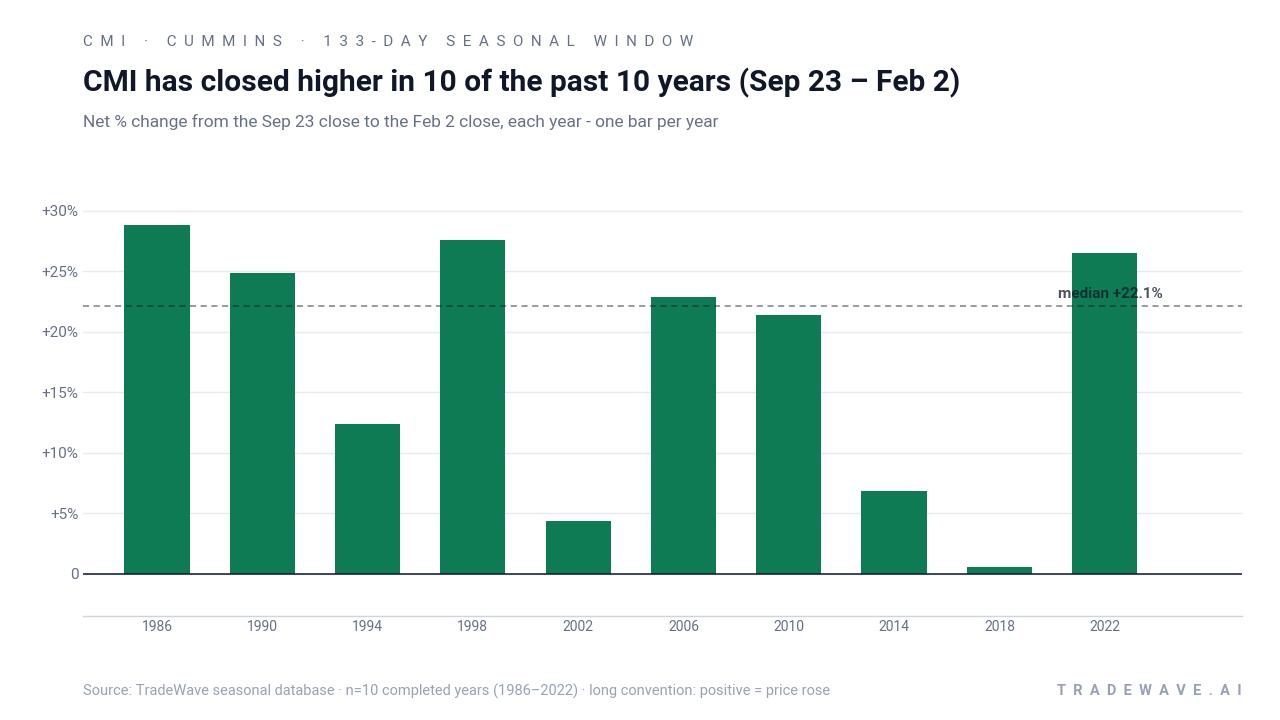
The pattern is grouped by the presidential election cycle, focusing only on the last 10 midterm election years rather than consecutive calendar years. That matters because industrials like Cummins often feel the impact of mid-cycle policy shifts, infrastructure spending debates and energy-transition incentives that tend to cluster in this phase of the White House cycle.[2]
Across the 10 completed midterm-year samples since 1986, the strongest window came in 1986 with a 28.8% net gain, while the softest still finished positive at 0.57% in 2018. Several cycles, including 1990, 1998, 2006, 2010 and 2022, delivered returns north of 20%, underscoring how often this fall–winter stretch has lined up with powerful rallies in the stock.
A second view layers in both the best rallies and the worst drawdowns inside each of those windows.
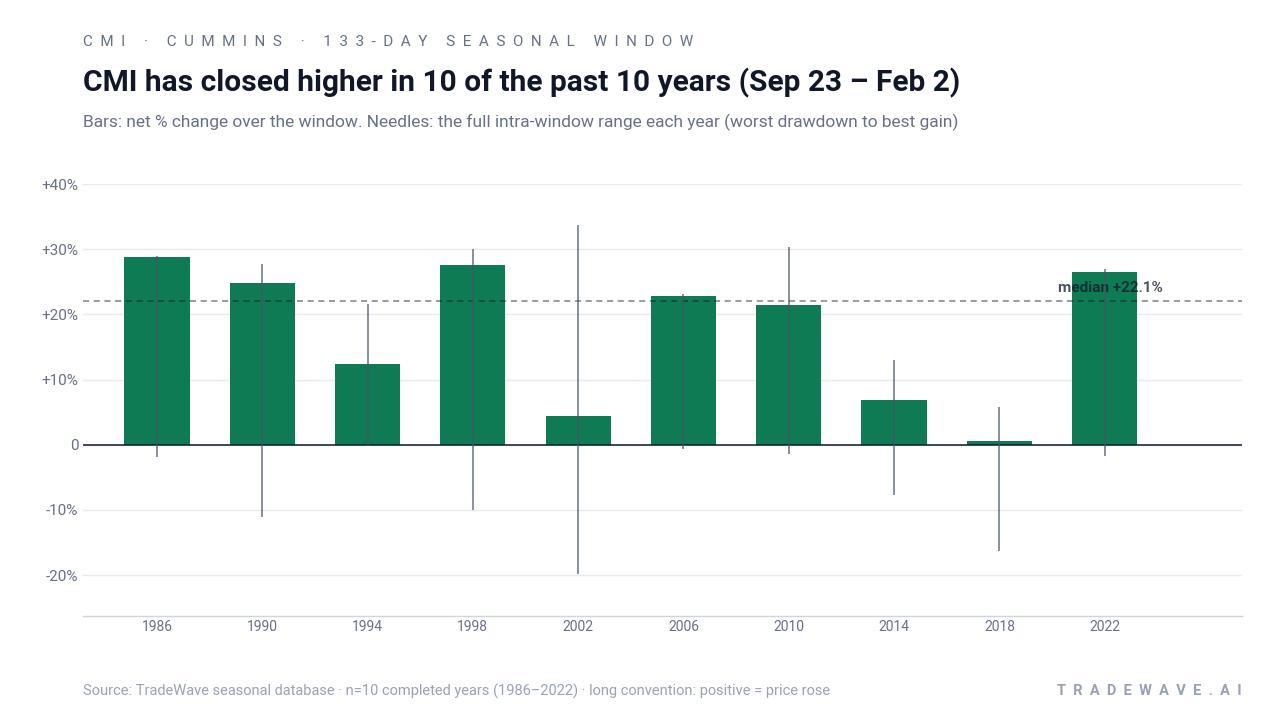
Those intraperiod ranges matter. In 2002, for example, Cummins finished the window up 4.39% but saw a maximum favorable move of 33.66% and a maximum adverse move of 19.8% from the entry, a reminder that the path can be far bumpier than the final print suggests. Other years such as 1990 and 1998 also paired strong peak gains with double-digit drawdowns before the window closed higher.
Put together, the pattern is unusually clean for a single stock: 10 winners, no losers, and a 388% compounded gain if an investor had only been exposed during this 133-day midterm-year slice across the sample. History does not guarantee a repeat, but the consistency across very different macro backdrops is hard to ignore.
Why does Cummins (CMI) follow this seasonal pattern?
One likely driver is the way midterm election years often line up infrastructure and energy-policy decisions in the back half of the year, which can support order books for heavy machinery and power equipment makers like Cummins.[4] Analysts have also pointed to portfolio rebalancing into industrials when investors anticipate stronger power demand and grid investment, themes that tend to build as the political calendar shifts from midterm uncertainty toward the pre-election year.[4] The result is a recurring window where policy, spending expectations and sector rotation have historically leaned in Cummins’ favor.
History does not guarantee future results; adverse excursions can be large even in winning windows, and investors should treat this pattern as context rather than a forecast.
What is driving Cummins (CMI) today?
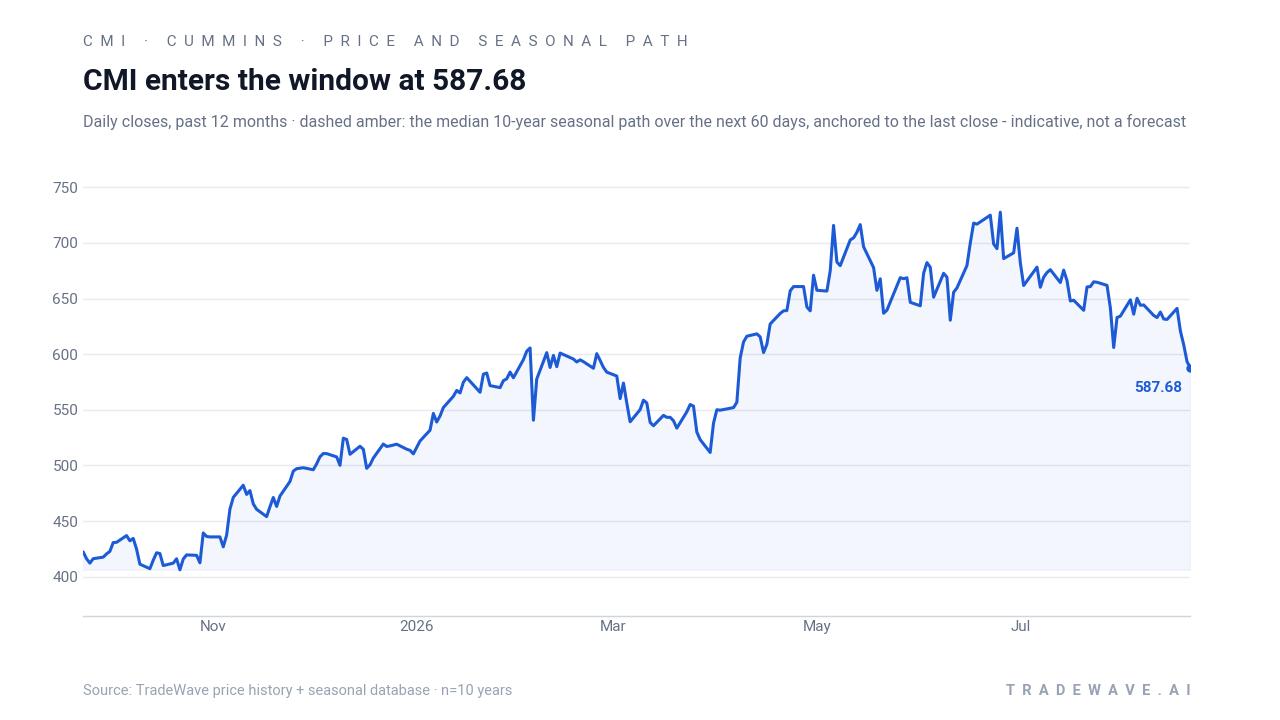
Cummins closed at $587.68 on Aug 24, down 0.94% on the day, extending a roughly 11.58% slide over the past month even as the stock remains up 18.92% year to date and well above its 52-week low of about $384.09.[3][6] The pullback comes after a strong run into mid-2026 that left the shares trading below some valuation estimates of fair value, with Simply Wall St analysis hosted on Yahoo Finance arguing in late July that Cummins could still be about 14% undervalued as power demand supports the bull case.[4]
Fundamentally, the story has been constructive. In Q1 2026, Cummins delivered adjusted EPS of $6.15, up 3.2% year over year and nearly 10% above the Zacks consensus, on revenue of $8.40 billion that also edged past expectations.[5] Ahead of the Aug 4 Q2 report, previews highlighted that beat as a key reference point for investors gauging whether the company could sustain margin and revenue momentum.[1][5]
On the corporate front, Cummins has been leaning into energy-transition themes. On Aug 20, the company landed a large battery energy storage system project, a win that bolsters its presence in grid and power markets tied to rising electricity demand.[3] Two days earlier, Cummins also raised its quarterly dividend to $2.20 per share, or $8.80 annualized, signaling confidence in cash generation and balance-sheet strength.[7] MarketBeat data shows no insider trades over the past three months and insider ownership at just 0.30%, suggesting governance is dominated by institutions rather than management stock moves.[6]
Institutional interest has been steady. Recent filings flagged new or increased positions from firms including MidFirst Bank, Csenge Advisory Group and Flputnam Investment Management, adding to the picture of Cummins as a core industrial holding rather than a speculative trade.[7][8][9][10] At the same time, valuation commentary on Yahoo Finance has framed the stock as trading below some fair-value estimates even after its multi-year rally, with comparisons to machinery-industry and broader industrials sector price-to-earnings multiples.[2][4]
The chart below situates the latest pullback against the past year’s climb and the median seasonal path over the next two months.
What should traders watch as the Cummins seasonal window approaches?
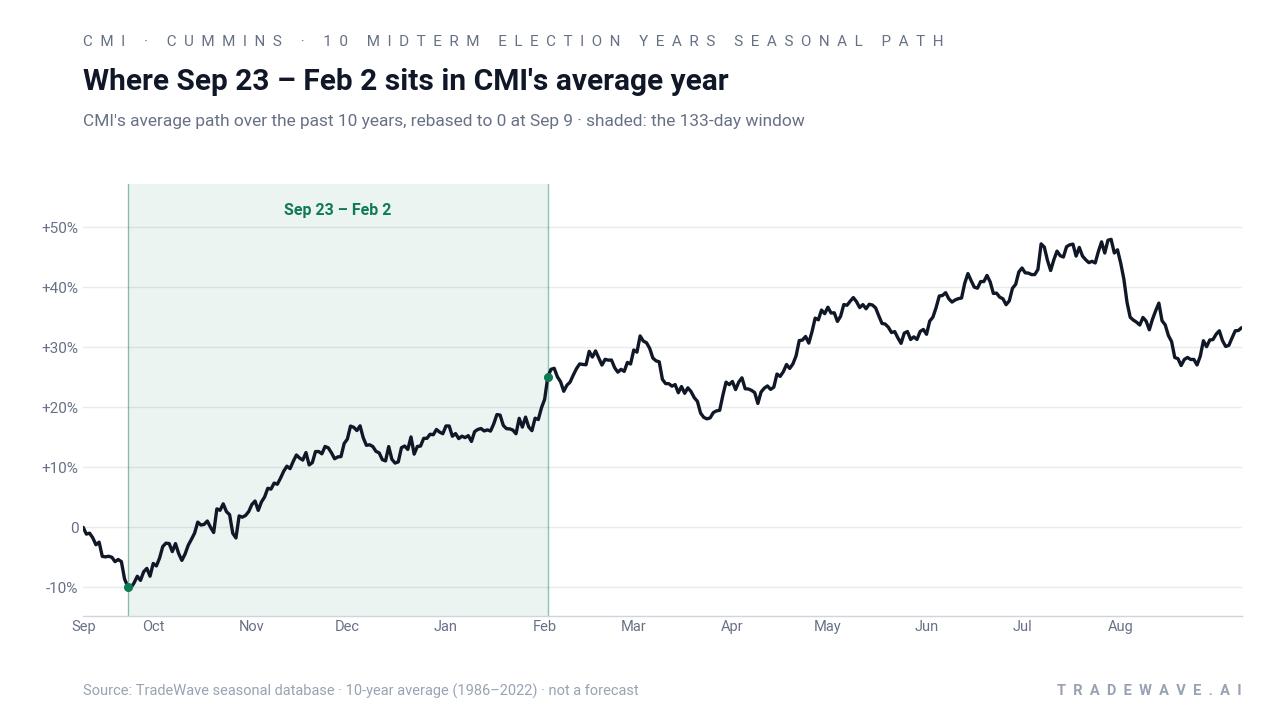
First, the calendar. The 133-day midterm-year window opens on Sep 23 and runs through Feb 2, overlapping earnings season, year-end positioning and the early stages of the 2027 pre-election year. How Cummins trades into and through that date range will show whether the historical 10-for-10 pattern is still exerting any pull.
Second, policy and macro signals tied to infrastructure and power demand. Any fresh headlines on grid investment, industrial spending or incentives for energy storage and backup power could reinforce the themes that prior cycles have rewarded in this window.[3][4] For a stock already benefiting from a large BESS project win and a higher dividend, confirmation that end-market demand is holding up would fit the historical script.[3][7]
Third, price levels. With Cummins trading about 20.3% below its 52-week high after a sharp year-to-date advance, traders will be watching whether the current consolidation stabilizes ahead of the window or whether further weakness resets expectations before the seasonal regime kicks in.[3][6] A firming tape into late September would rhyme with prior midterm-year setups that saw the stock base and then grind higher through winter.
Finally, volatility inside the window. Past cycles show that even “all green” seasonal patterns can involve double-digit drawdowns before finishing higher, so traders may focus less on whether Cummins is up or down on any given day and more on how intraperiod swings compare with prior midterm years. If the stock again shows strong rallies with contained downside during the window, it would echo the historical profile; if drawdowns deepen or gains fail to materialize, that would be an early sign that this particular cycle is breaking from the script.
Sources
- Yahoo Finance (StockStory) - Cummins (CMI) Q2 Earnings Report Preview: What To Look For
- Yahoo Finance / Simply Wall St - Cummins (CMI) Stock Looks Below Fair Value Though Earnings Look Rich
- Yahoo Finance / Simply Wall St - Cummins (CMI) Lands A Large BESS Project, Is The Stock Still 17% Undervalued?
- Yahoo Finance / Simply Wall St - Cummins (CMI) Could Be 14% Undervalued As Power Demand Supports The Bull Case
- Yahoo Finance (Zacks Investment Research) - Cummins Gears Up to Report Q2 Earnings: What's in the Cards?
- MarketBeat - Cummins (CMI) Stock Price, News & Analysis
- MarketBeat (instant alert) - MidFirst Bank Makes New Investment in Cummins Inc. $CMI
- MarketBeat (instant alert) - 3,725 Shares in Cummins Inc. $CMI Acquired by Csenge Advisory Group
- MarketBeat (instant alert) - Knuff & Co LLC Acquires New Position in Cummins Inc. $CMI
- MarketBeat (instant alert) - Flputnam Investment Management Co. Buys New Shares in Cummins Inc. $CMI
About this seasonal analysis
Seasonal pattern data is sourced from TradeWave.ai, which analyzes historical price behavior across annual calendar windows going back up to 30 years. Read the full data methodology or the book The 100-Year Pattern by Afshin Moshrefi (2026 edition). Past performance of seasonal patterns does not guarantee future results. This article is for informational purposes only and does not constitute investment advice.