10-for-10 Midterm Run: Merck & Co. (MRK) Averages 13.04% Gains in This 137-Day Window
Merck & Co. is entering a historically powerful late-August to early-January trading window just as its melanoma vaccine breakthrough propels the stock near record highs, raising the stakes for this year’s seasonal pattern.
Price as of Aug 21, 2026: $152.55 (last close).

What is the seasonal pattern for Merck & Co. (MRK)?
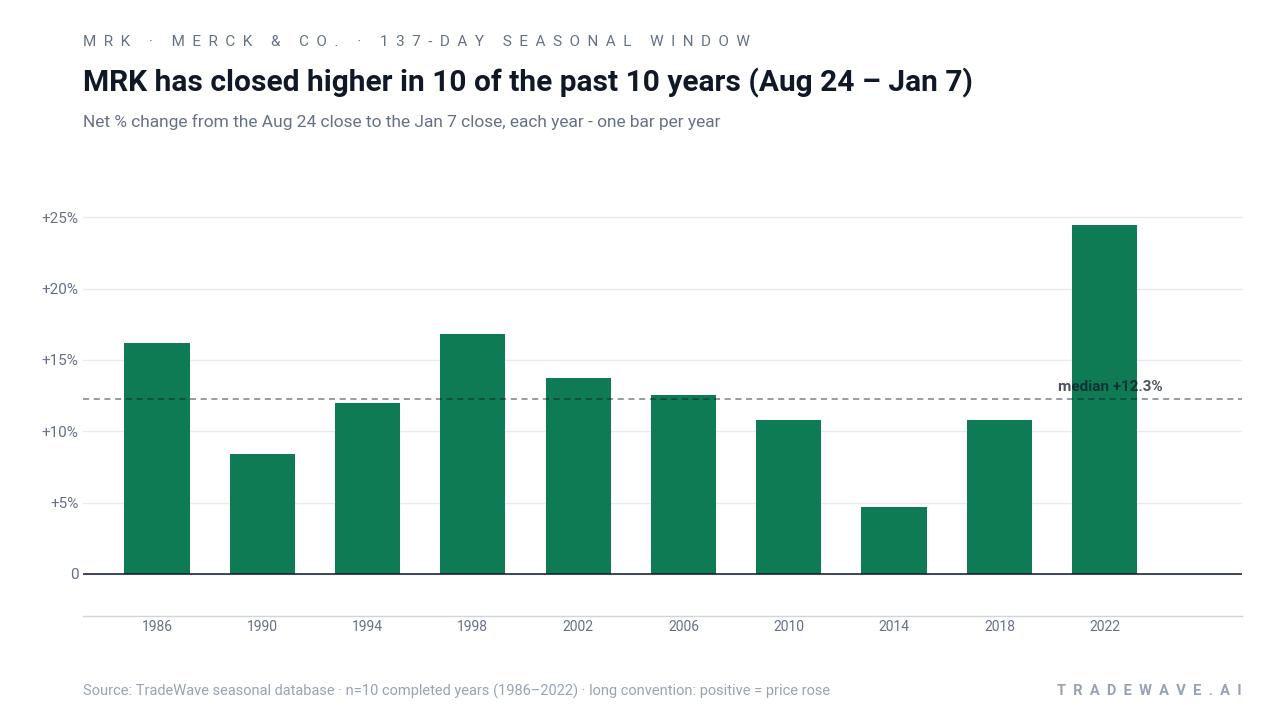
Merck & Co. has risen in 10 of 10 midterm-year Aug 24 to Jan 7 windows, with an average gain of 13.04% in winning years.
- 10 for 10 in this window, averaging 13.04% gains in winning years across the last 10 midterm election cycles.
- Percent Profitable is 100%, with 10 winners and 0 losers in the Aug 24 to Jan 7 Merck & Co. seasonal trend.
- Average profit of 13.04% reflects a long-side pattern where every historical iteration has finished higher.
- The TradeWave Ratio of 2.34 signals that price has typically traveled meaningfully in the trade direction within the window.
- A Sharpe ratio of 2.16 for this window points to unusually strong risk-adjusted returns versus typical stock pattern analysis.
- Intraperiod swings have still been sizable in some years, with notable drawdowns before the stock finished the Merck & Co. trading window higher.
According to historical data from TradeWave.ai, this upcoming stretch for Merck & Co. behaves very differently from an average quarter on the calendar, especially in midterm election years.
How strong is the upcoming seasonal window for Merck & Co. (MRK)?
Merck & Co. has risen in 10 of the last 10 midterm-year Aug 24 to Jan 7 windows, averaging 13.04% gains and stacking to a 237% cumulative return across those cycles. Shares closed Monday at 152.55, up 2.4% on the day and about 1.3% below their 52-week high of 154.49. The stock has also just logged a double-digit surge on heavy volume after its melanoma vaccine trial win with Moderna, a move that has pushed Merck to all-time highs and reset expectations for its oncology franchise.[1][2]
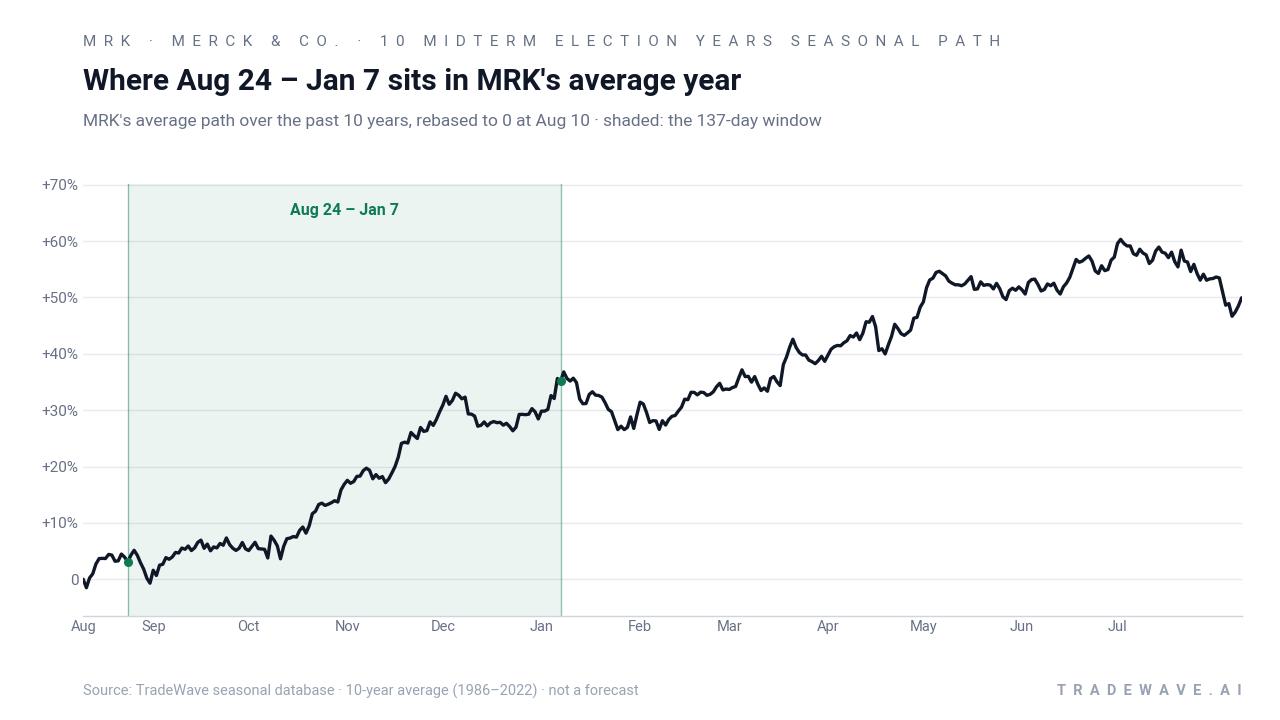
The presidential election cycle matters here because this pattern only looks at the last 10 midterm election years, a phase that often brings policy uncertainty, drug-pricing debate and shifting risk appetite for healthcare stocks. Pattern phase and calendar phase are aligned: 2026 is a midterm election year, and this 137-day Merck & Co. trading window runs from Aug 24 into early January, bridging the late midterm period and the first days of the year before the presidential election.
Historically, the trade direction for this window has been long. Percent Profitable is 100%, with 10 winners and 0 losers, so every midterm-year iteration in the sample finished higher. Average profit of 13.04% means that in a typical winning year, Merck added roughly low-teens gains from the Aug 24 close to the Jan 7 close, while the median outcome of 12.26% shows the distribution has not been skewed by a single outlier year.
The per-year table shows how that plays out in individual cycles. The weakest net gain was 4.69% in 2014, while the strongest was 24.44% in 2022, when Merck rallied from an entry price of 79.78 to an exit price of 99.28 over the window. In between, years like 1998 and 1986 delivered mid-teens returns of 16.85% and 16.21% respectively, reinforcing the idea that this is not just a one-off anomaly but a recurring MRK seasonal trend.
A second view combines net results with the full intraperiod range, highlighting both upside potential and typical drawdowns.
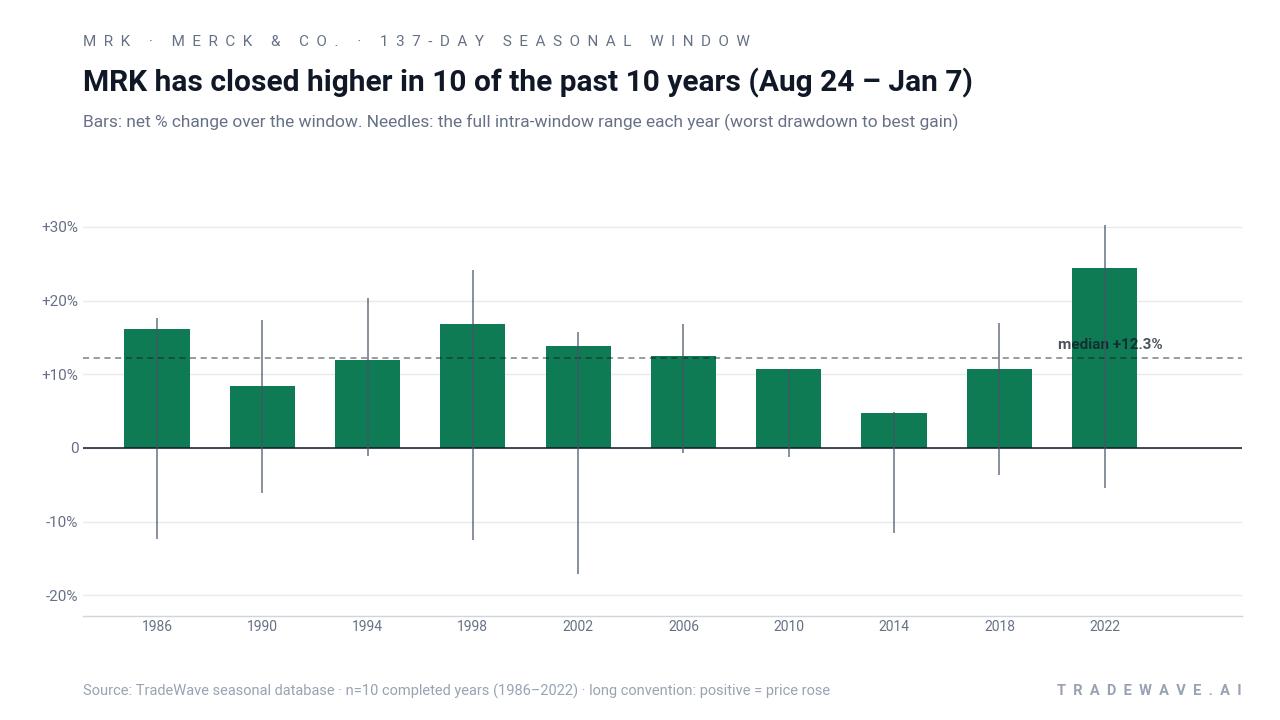
The maximum favorable move, or best intraperiod run-up, has often exceeded the final net gain, especially in years like 1998 and 2022 where the stock briefly pushed 24.09% and 30.2% higher at peak before settling back. On the downside, the maximum adverse move, or worst drawdown from entry, has ranged from shallow dips of less than 2% in 1994, 2006 and 2010 to deeper setbacks of around 12% to 17% in 1986, 1998 and 2002. That mix explains why the TradeWave Ratio sits at 2.34 and the Sharpe ratio at 2.16: the window has historically offered strong upside with volatility that is noticeable but, on average, has been rewarded.
Stacking the window year after year compounds the effect. The cumulative chart shows that repeatedly holding only this 137-day slice across the 10 midterm-year samples would have produced a 237% cumulative return, far outpacing a flat or random pattern. Add it up: ten straight wins, double-digit average gains and a smooth cumulative climb make this one of the cleaner long-side seasonal patterns in large-cap pharmaceuticals.
History does not guarantee future results; adverse excursions (MAE) can be large even in winning windows, and intraperiod drawdowns of more than 10% have occurred in several past cycles.
Why does Merck & Co. (MRK) follow this seasonal pattern?
This pattern may reflect how the pharmaceutical sector trades around late-year catalysts, including oncology conference data, regulatory decisions and year-end portfolio rebalancing. Analysts have pointed to recurring flows into defensive growth names like Merck as investors reposition ahead of the year before the presidential election, when risk appetite often improves but policy noise around healthcare can stay elevated.[1][3] One likely driver is that oncology-heavy drugmakers tend to see a cluster of trial readouts and guidance updates in the back half of midterm years, which can pull forward demand for stocks with visible pipelines.
What is driving Merck & Co. (MRK) today?
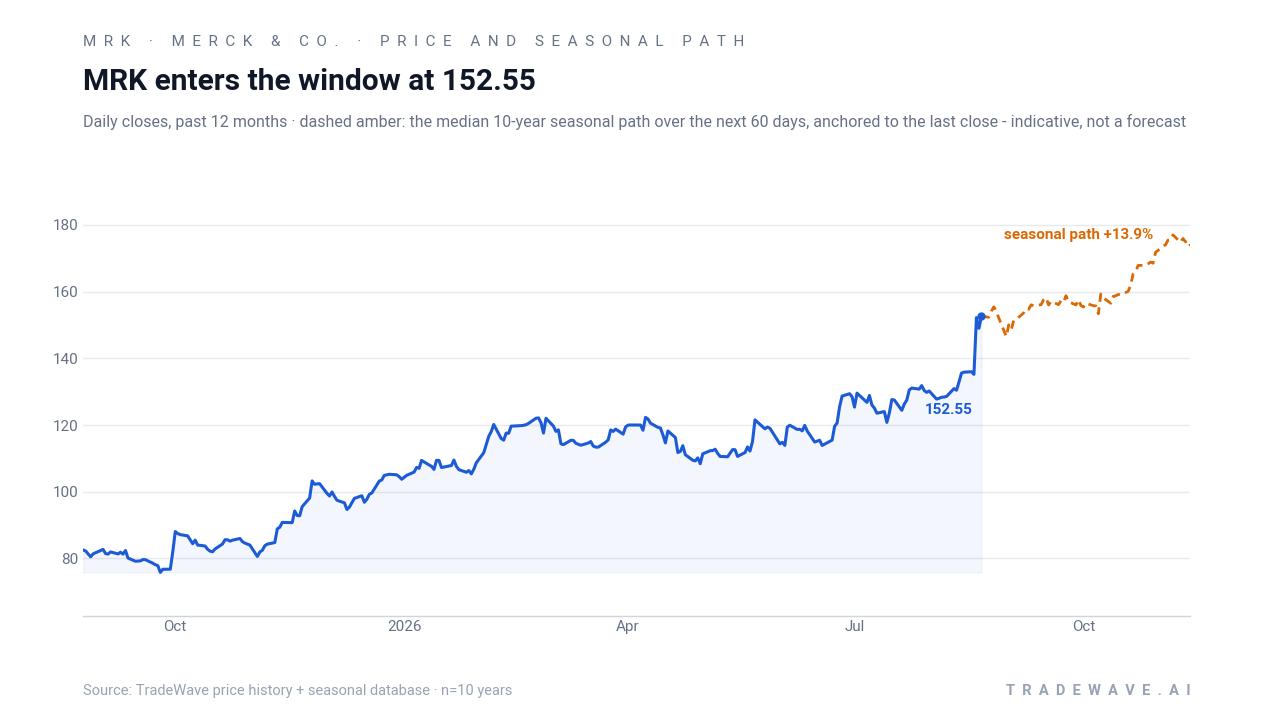
Merck & Co. closed Monday at 152.55, up 3.56 points or 2.4% on the session, after trading between 148.59 and a fresh 52-week high of 154.49 on volume of about 15.9 million shares. The move caps a powerful one-month run of 16.39% that has taken the stock to roughly double its 52-week low of 74.08 and well above its 50-day moving average of 127.93, underscoring how quickly sentiment has flipped in the name.
The catalyst is clear. On Aug 19, Merck and Moderna reported positive Phase 3 results for their personalized melanoma vaccine combined with Keytruda, showing a significant reduction in recurrence risk and sparking a sharp re-rating of Merck’s oncology growth profile.[1][2] Multiple reports describe the stock “soaring” on the news, with double-digit gains and a breakout to all-time highs as investors reassessed the durability of the Keytruda franchise and the potential for mRNA-based cancer vaccines to open new revenue streams.[1][2]
Analysts have been quick to respond. A recent note highlighted upgrades from at least one major bank and fresh debate over valuation, with some houses arguing that the vaccine data and sustained Keytruda momentum justify a higher multiple, while others warn that much of the good news may already be in the price.[3] MarketBeat’s compiled view still shows a “Moderate Buy” rating and a consensus target of 144.1, a level that now sits below the current share price and likely reflects pre-breakout assumptions rather than today’s post-trial regime.[3]
In the background, the broader healthcare innovation story is gaining traction. Validation of personalized mRNA cancer vaccines could reshape oncology treatment pathways and reimbursement dynamics, with Merck positioned as a central player through its Keytruda partnership and broader immuno-oncology pipeline.[1][4] Sector commentary has framed Merck as one of the clearest beneficiaries of this shift, reinforcing its role as a core holding in many pharmaceutical and oncology-focused portfolios.[1]
The chart below situates the latest breakout against Merck’s past year of trading and the typical seasonal path over the next two months.
What should traders watch in this Merck & Co. (MRK) seasonal window?
First, the calendar. This 137-day window runs from Aug 24 through Jan 7, overlapping the heart of the midterm election year and the opening stretch of the year before the presidential election, when risk appetite has often improved and large-cap healthcare has attracted fresh flows. Traders will be watching whether Merck’s price action tracks the historical pattern of steady gains into year-end or diverges in response to policy headlines and macro data.
Second, levels. On the upside, the 154.49 area, Monday’s intraday high and current 52-week peak, is the first reference point; sustained trading above that zone would confirm the breakout and keep the historical seasonal bias intact. On the downside, the 50-day moving average near 127.93 and the prior consolidation band in the low 130s are key markers: in past midterm-year windows, Merck has sometimes seen 10% to 15% drawdowns before finishing the period higher, so a pullback into those areas would not be out of character.
Third, follow-through on the recent volume spike. The double-digit surge after the melanoma vaccine news brought unusually heavy trading, and the question is whether that interest persists or fades.[1][2] Continued elevated volume on up days would suggest that institutional buyers are still building positions into the seasonal window, while a quick slide back to average turnover could signal that the initial reaction was more short-covering and fast money than long-term allocation.
Finally, the policy and pipeline calendar. Any new data on the melanoma vaccine, updates on other Keytruda combinations, or shifts in the U.S. drug-pricing debate could either reinforce or challenge the historical pattern. If Merck can hold above its recent breakout zone while navigating those catalysts, it would line up with the 10-for-10 track record this window carries into the current cycle. A sharp break below the 50-day moving average, especially on heavy volume, would be an early sign that this midterm-year stretch may not follow the usual script.
Sources
- Zacks Investment Research - Moderna or Merck: Which Soaring Cancer Vaccine Stock Is the Better Buy?
- Seeking Alpha - Merck Soars On Cancer Vaccine Trial Win With Moderna, More Upside Ahead
- Seeking Alpha (news) - Merck stock upgraded at Morgan Stanley; RBC ...
- Reuters - Moderna, Merck's skin cancer vaccine shows sustained benefit in five-year follow-up
About this seasonal analysis
Seasonal pattern data is sourced from TradeWave.ai, which analyzes historical price behavior across annual calendar windows going back up to 30 years. Read the full data methodology or the book The 100-Year Pattern by Afshin Moshrefi (2026 edition). Past performance of seasonal patterns does not guarantee future results. This article is for informational purposes only and does not constitute investment advice.